

Chart
Bar, line, area and pie charts, drawn here with no charting package.
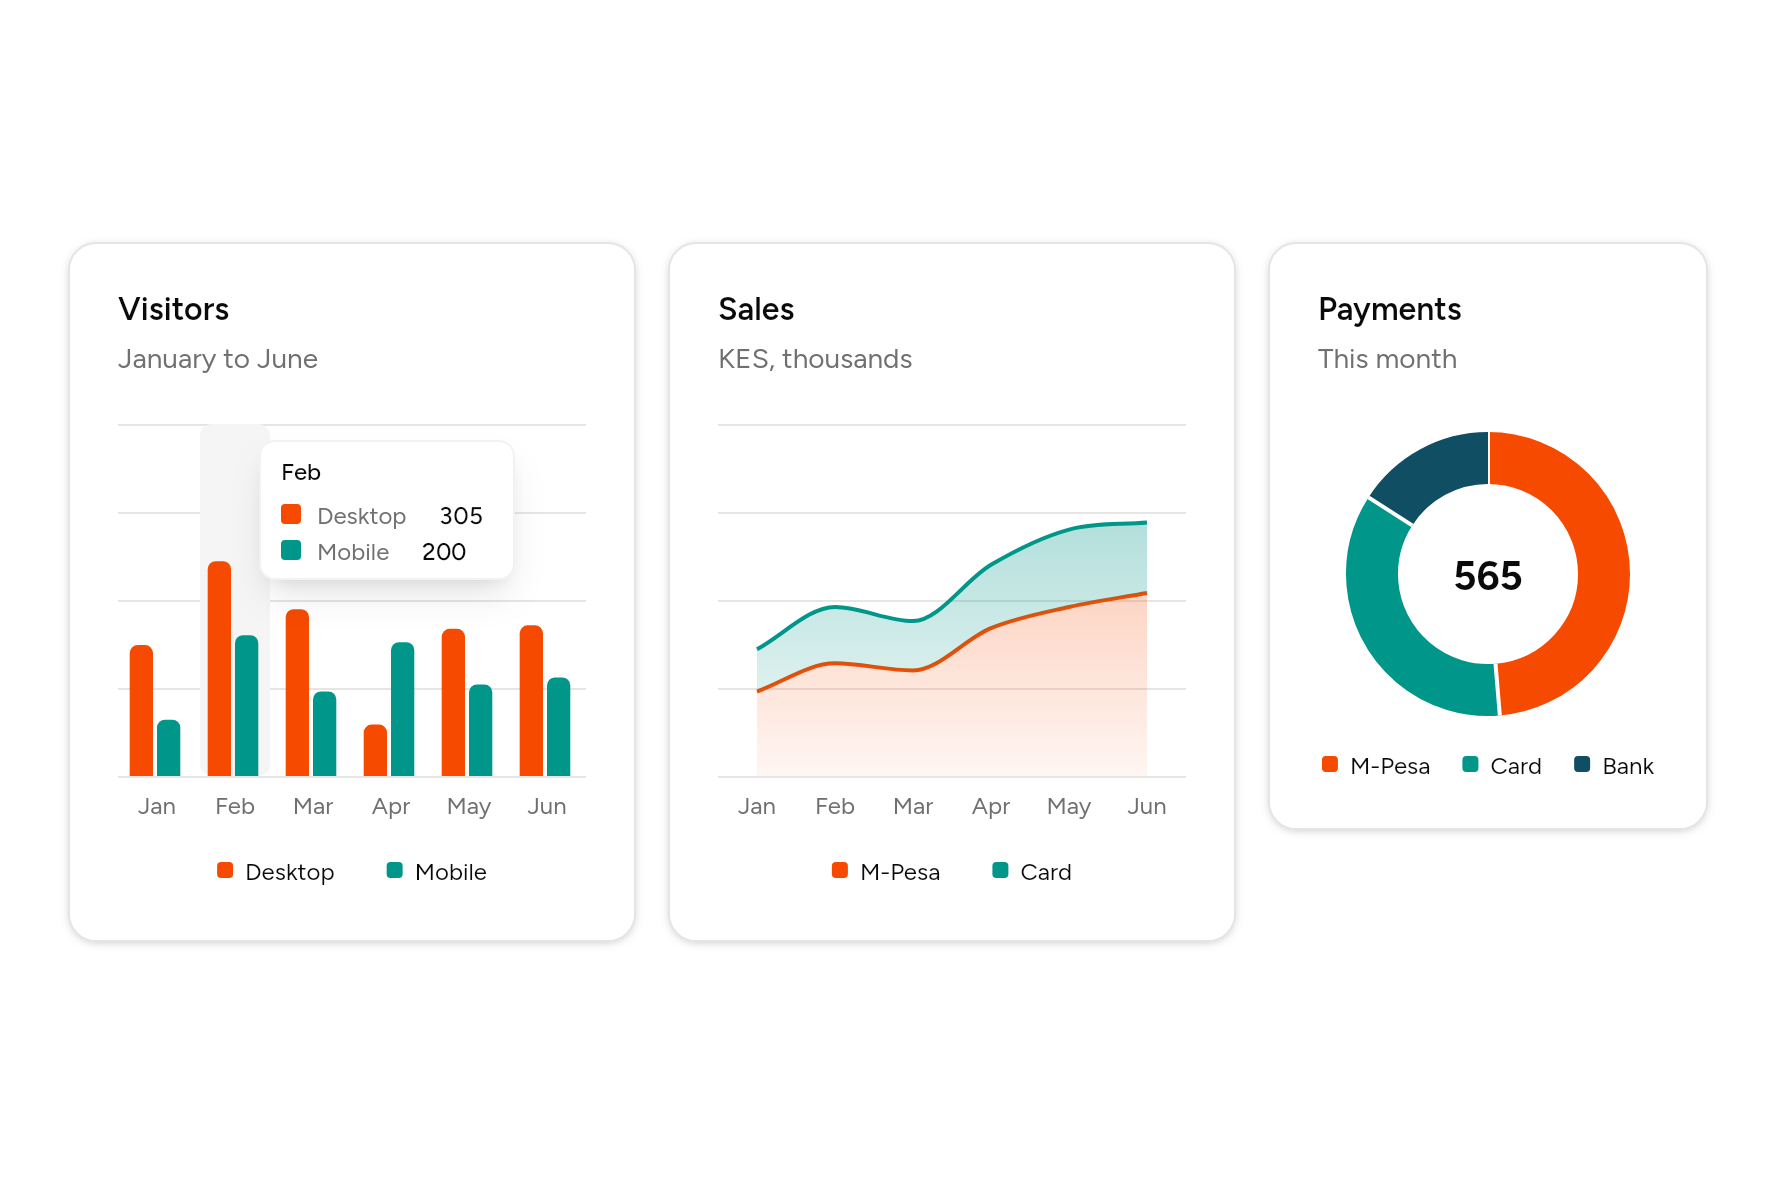
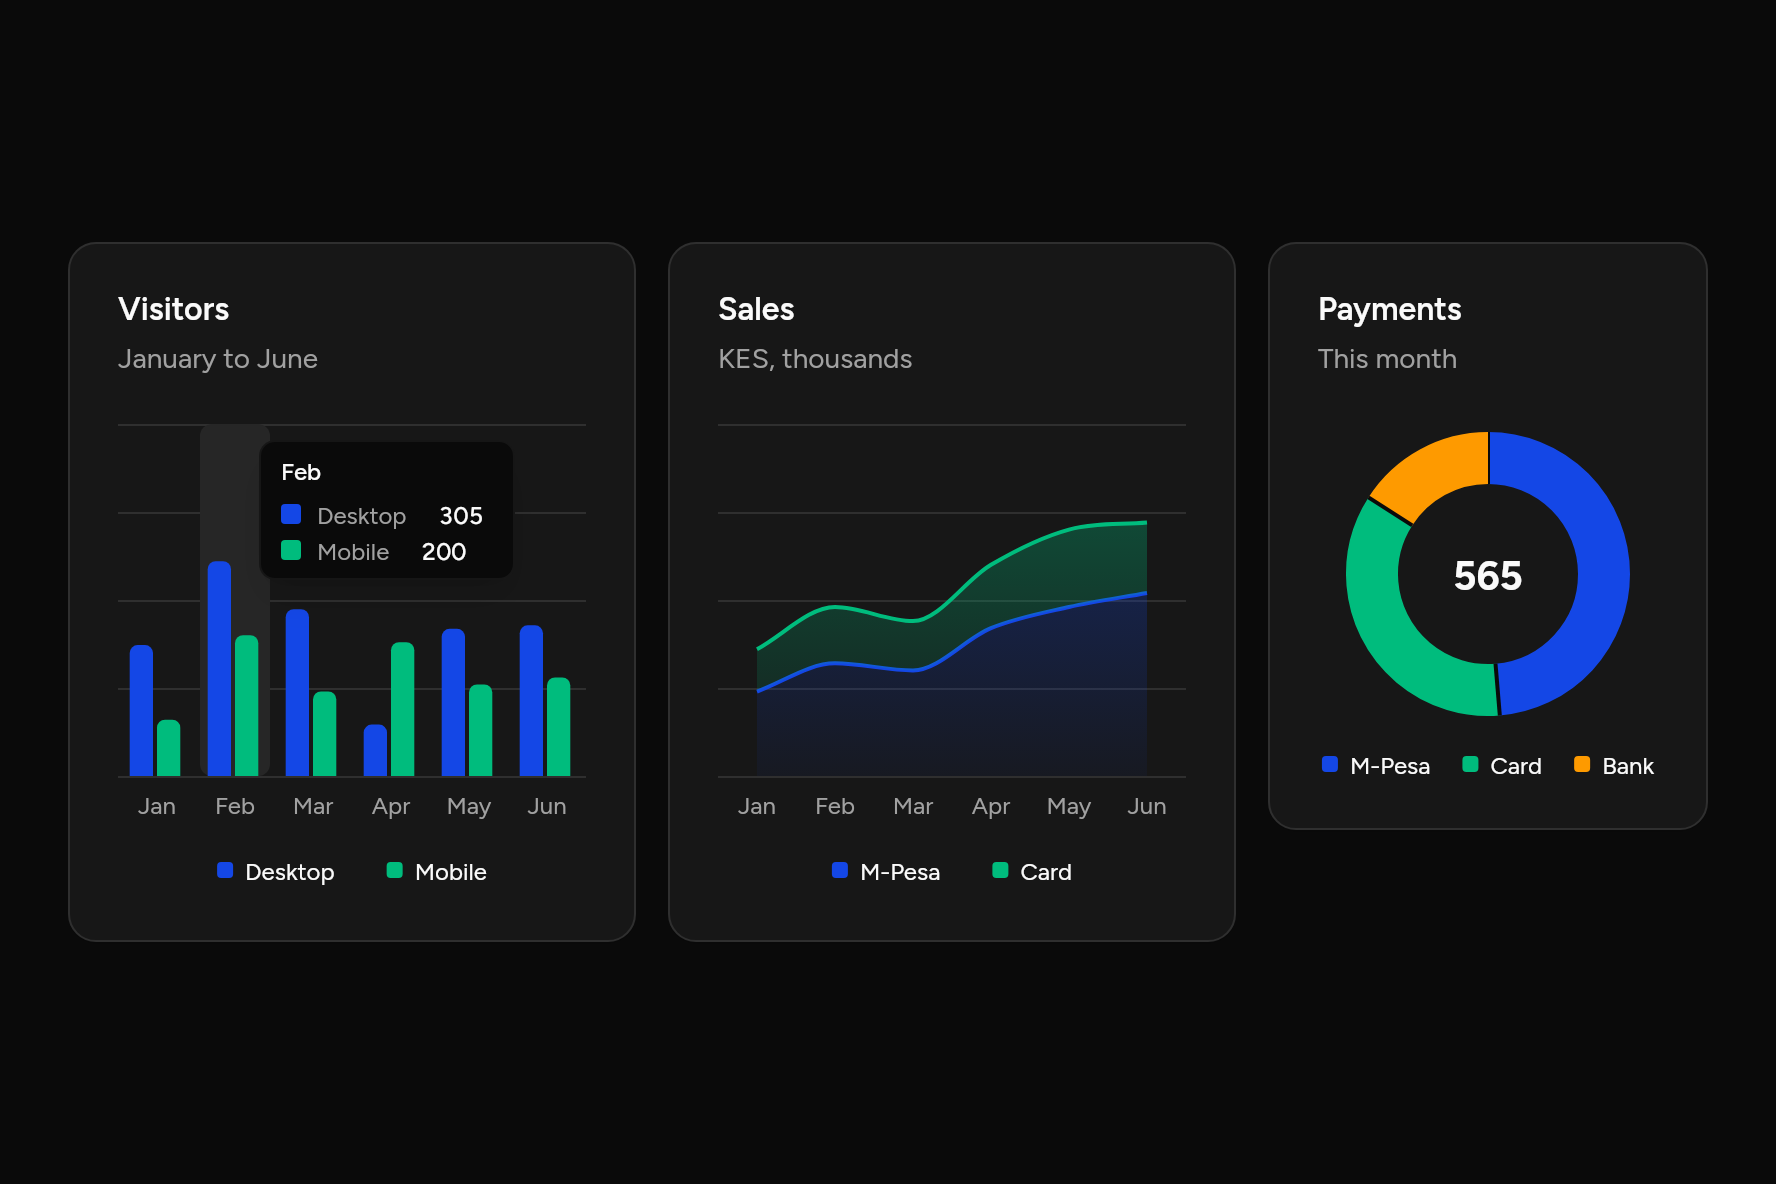
import 'package:flutter/widgets.dart';

import 'ui/card.dart';
import 'ui/chart.dart';

class ChartDemo extends StatelessWidget {
  const ChartDemo({super.key});

  static const months = ['Jan', 'Feb', 'Mar', 'Apr', 'May', 'Jun'];

  @override
  Widget build(BuildContext context) => SizedBox(
    width: 820,
    child: Row(
      crossAxisAlignment: CrossAxisAlignment.start,
      children: [
        Expanded(
          child: Card(
            children: [
              const CardHeader(title: Text('Visitors'), description: Text('January to June')),
              const CardContent(
                child: BarChart(
                  height: 200,
                  labels: months,
                  semanticLabel: 'Visitors by month',
                  series: [
                    ChartSeries('Desktop', [186, 305, 237, 73, 209, 214]),
                    ChartSeries('Mobile', [80, 200, 120, 190, 130, 140]),
                  ],
                ),
              ),
            ],
          ),
        ),
        const SizedBox(width: 16),
        Expanded(
          child: Card(
            children: [
              const CardHeader(title: Text('Sales'), description: Text('KES, thousands')),
              const CardContent(
                child: AreaChart(
                  height: 200,
                  stacked: true,
                  labels: months,
                  semanticLabel: 'Sales by month',
                  series: [
                    ChartSeries('M-Pesa', [120, 160, 150, 210, 240, 260]),
                    ChartSeries('Card', [60, 80, 70, 90, 110, 100]),
                  ],
                ),
              ),
            ],
          ),
        ),
        const SizedBox(width: 16),
        SizedBox(
          width: 220,
          child: Card(
            children: [
              const CardHeader(title: Text('Payments'), description: Text('This month')),
              const CardContent(
                child: Center(
                  child: PieChart(
                    size: 150,
                    semanticLabel: 'Payments by method',
                    center: Text('565'),
                    slices: [ChartSlice('M-Pesa', 275), ChartSlice('Card', 200), ChartSlice('Bank', 90)],
                  ),
                ),
              ),
            ],
          ),
        ),
      ],
    ),
  );
}
Add it
In your Flutter project:
ashlar add chart
It writes theme.dart, palette.dart and chart.dart into lib/ui, keeping any you already have.
API
Read from the source above: each parameter with its type, its default, and what it is for.
ChartSeriesclass
One run of values, one per label: "Desktop", "Mobile".
| Parameter | Type | Default | What it is for |
|---|---|---|---|
labelpositional |
String |
The series' name, in the legend, the tooltip and what a screen reader hears. | |
valuespositional |
List<double> |
The values, in order. | |
color |
Color? |
Null takes the theme's chart colours in turn. | |
colors |
List<Color>? |
A colour for each value, for bars that each mean something of their own. | |
icon |
IconData? |
Shown in the legend and the tooltip in place of the colour swatch. |
ChartSliceclass
One part of a pie, or one ring of a radial chart.
| Parameter | Type | Default | What it is for |
|---|---|---|---|
labelpositional |
String |
The slice's name, in the legend, the tooltip and what a screen reader hears. | |
valuepositional |
double |
Its size; its share is this over the total. | |
color |
Color? |
Null takes the theme's chart colours in turn. | |
icon |
IconData? |
Shown in the legend and the tooltip in place of the colour swatch. |
ChartCurveenum
How a line goes from one value to the next.
| Value | What it is for |
|---|---|
smooth | A smooth curve that never overshoots a value. |
linear | Straight from point to point. |
step |
Level, then up or down halfway between: for values that hold until they change. |
ChartIndicatorenum
The mark beside each value in a tooltip.
| Value | What it is for |
|---|---|
dot | A small square of the series' colour. |
line | A bar of the colour down the side of the rows. |
dashed | The same bar, dashed. |
none | No mark. |
ChartTooltipclass
How a chart's tooltip looks.
| Parameter | Type | Default | What it is for |
|---|---|---|---|
enabled |
bool |
true |
False: no tooltip, though the keys still step and a screen reader still reads. |
indicator |
ChartIndicator |
ChartIndicator.dot |
The mark beside each value: a dot, a line, a dashed line or none. |
showTitle |
bool |
true |
False hides the label (the month, say) at the top. |
title |
String Function(String label)? |
Writes the label at the top: 'July 2026' for 'Jul'. | |
total |
bool |
false |
A last row adding the values up. |
ChartLegendenum
Where a chart's legend sits.
| Value | What it is for |
|---|---|
none | |
top | |
bottom |
BarChartclass
Bars by label, series side by side or stacked; upright or lying horizontal. Values below zero hang down from a zero line.
| Parameter | Type | Default | What it is for |
|---|---|---|---|
labelsrequired |
List<String> |
One per bar, point or group: the months, say. | |
seriesrequired |
List<ChartSeries> |
The values, one run per series. | |
height |
double |
250 |
The chart's height, labels included. |
stacked |
bool |
false |
Each series on top of the one before. |
expand |
bool |
false |
Stacked, and each label's values as shares of their whole, up to 100%. |
horizontal |
bool |
false |
Bars lying along, labels down the side. |
active |
int? |
One label's bars drawn full and the rest faded: the one being talked about. | |
valueLabels |
bool |
false |
Each value written on its bar or point. |
axis |
bool |
false |
The scale's numbers beside the plot. |
grid |
bool |
true |
Lines across the plot at each step of the scale. |
format |
String Function(double value)? |
How a value is written in the tooltip, on the chart and read out: "KES 2,400". Shares are written as percentages unless you say. | |
semanticLabel |
String? |
What the chart shows, read before its values: 'Visitors by month'. | |
legend |
ChartLegend |
ChartLegend.bottom |
Where the legend sits, or none. Tapping a name hides its series. |
tooltip |
ChartTooltip |
const ChartTooltip() |
How the tooltip looks, or that there is none. |
LineChartclass
Lines through each series' values.
| Parameter | Type | Default | What it is for |
|---|---|---|---|
labelsrequired |
List<String> |
One per bar, point or group: the months, say. | |
seriesrequired |
List<ChartSeries> |
The values, one run per series. | |
height |
double |
250 |
The chart's height, labels included. |
curve |
ChartCurve |
ChartCurve.smooth |
Smooth, straight, or in steps. |
dots |
bool |
false |
A dot on each value of a line. |
valueLabels |
bool |
false |
Each value written on its bar or point. |
axis |
bool |
false |
The scale's numbers beside the plot. |
grid |
bool |
true |
Lines across the plot at each step of the scale. |
format |
String Function(double value)? |
How a value is written in the tooltip, on the chart and read out: "KES 2,400". Shares are written as percentages unless you say. | |
semanticLabel |
String? |
What the chart shows, read before its values: 'Visitors by month'. | |
legend |
ChartLegend |
ChartLegend.bottom |
Where the legend sits, or none. Tapping a name hides its series. |
tooltip |
ChartTooltip |
const ChartTooltip() |
How the tooltip looks, or that there is none. |
AreaChartclass
Lines with the area under them filled; stacked puts each series on the one below, and expand shows each label's values as shares of their whole.
| Parameter | Type | Default | What it is for |
|---|---|---|---|
labelsrequired |
List<String> |
One per bar, point or group: the months, say. | |
seriesrequired |
List<ChartSeries> |
The values, one run per series. | |
height |
double |
250 |
The chart's height, labels included. |
stacked |
bool |
false |
Each series on top of the one before. |
expand |
bool |
false |
Stacked, and each label's values as shares of their whole, up to 100%. |
curve |
ChartCurve |
ChartCurve.smooth |
Smooth, straight, or in steps. |
dots |
bool |
false |
A dot on each value of a line. |
gradient |
bool |
true |
An area fades to nothing at the bottom; false fills it evenly. |
axis |
bool |
false |
The scale's numbers beside the plot. |
grid |
bool |
true |
Lines across the plot at each step of the scale. |
format |
String Function(double value)? |
How a value is written in the tooltip, on the chart and read out: "KES 2,400". Shares are written as percentages unless you say. | |
semanticLabel |
String? |
What the chart shows, read before its values: 'Visitors by month'. | |
legend |
ChartLegend |
ChartLegend.bottom |
Where the legend sits, or none. Tapping a name hides its series. |
tooltip |
ChartTooltip |
const ChartTooltip() |
How the tooltip looks, or that there is none. |
PieLabelsenum
How a pie writes on its slices.
| Value | What it is for |
|---|---|
none | |
amounts | Each slice's value, inside it. |
titles | Each slice's name, outside it. |
PieChartclass
Slices of a whole, as a pie or, with a hole, a donut with center in the middle. inner adds a second ring inside, for a whole split two ways.
| Parameter | Type | Default | What it is for |
|---|---|---|---|
slicesrequired |
List<ChartSlice> |
The slices, clockwise from the top. | |
inner |
List<ChartSlice>? |
A second ring inside: the same whole split another way. | |
size |
double |
250 |
Its width and height. |
donut |
bool |
true |
A hole in the middle, for the center widget. |
center |
Widget? |
In the hole: the figure the chart is about. | |
active |
int? |
One slice drawn out from the rest: the one being talked about. | |
labels |
PieLabels |
PieLabels.none |
Writing on the slices: none, each value inside, or each name outside. |
separators |
bool |
true |
A thin line of the page between slices. |
legend |
ChartLegend |
ChartLegend.bottom |
Where the legend sits, or none. |
tooltip |
ChartTooltip |
const ChartTooltip() |
How the tooltip looks, or that there is none. |
format |
String Function(double value) |
_plain |
How a value is written in the tooltip and read out. |
semanticLabel |
String? |
What a screen reader calls it when its visible text does not say, as for an icon alone. |
RadarGridenum
The lines a radar chart is drawn over.
| Value | What it is for |
|---|---|
polygon | Polygons through the axes. |
circle | Circles round the centre. |
none | Nothing behind the shapes. |
RadarChartclass
Several values for each series round a circle, joined into a shape: how a series spreads across the labels, and how series compare.
| Parameter | Type | Default | What it is for |
|---|---|---|---|
labelsrequired |
List<String> |
One per axis, round the circle clockwise from the top. | |
seriesrequired |
List<ChartSeries> |
The values, a shape per series. | |
size |
double |
280 |
Its width and height, labels included. |
grid |
RadarGrid |
RadarGrid.polygon |
Polygons, circles, or nothing behind the shapes. |
spokes |
bool |
true |
Lines from the centre out to each label. |
gridFill |
bool |
false |
The grid's bands filled, every other one. |
fill |
bool |
true |
The shapes filled; false draws their outlines alone. |
dots |
bool |
false |
A dot on each value. |
max |
double? |
The value at the edge; a round number above the largest when not given. | |
legend |
ChartLegend |
ChartLegend.bottom |
Where the legend sits, or none. Tapping a name hides its series. |
tooltip |
ChartTooltip |
const ChartTooltip() |
How the tooltip looks, or that there is none. |
format |
String Function(double value) |
_plain |
How a value is written in the tooltip and read out. |
semanticLabel |
String? |
What a screen reader calls it when its visible text does not say, as for an icon alone. |
RadialChartclass
Values as arcs round a centre: one ring each, or one ring split between them (stacked); round the whole circle, or the top half.
| Parameter | Type | Default | What it is for |
|---|---|---|---|
slicesrequired |
List<ChartSlice> |
The values, a ring each from the outside in, or parts of one ring. | |
max |
double? |
The value a full ring stands for; the largest value, or the total when stacked, when not given. | |
size |
double |
250 |
Its width; a half ring is about half as tall. |
stacked |
bool |
false |
One ring, split between the slices, in place of a ring each. |
half |
bool |
false |
The top half of the circle, a gauge, in place of all of it. |
track |
bool |
true |
A faint full ring behind each arc, to show what a full one would be. |
center |
Widget? |
In the middle: the figure the chart is about. | |
legend |
ChartLegend |
ChartLegend.none |
Where the legend sits, or none. |
tooltip |
ChartTooltip |
const ChartTooltip() |
How the tooltip looks, or that there is none. |
format |
String Function(double value) |
_plain |
How a value is written in the tooltip and read out. |
semanticLabel |
String? |
What a screen reader calls it when its visible text does not say, as for an icon alone. |
Source
What lands in your app. It is yours from then on: change it as you would your own code, and ashlar add
will not write over it.
lib/ui/chart.dart 2291 lines
// Ashlar UI: Chart. Copied into your app by `ashlar add chart`; it is yours to change.
// ashlar: ignore-file. Charts are drawn left to right in any language, as time and
// number lines are read; ashlar check leaves this file out.
//
// Drawn on the canvas here, with no charting package: bars, lines, areas, pies, radars
// and radial bars, with a tooltip on hover, the arrow keys stepping through the values, a
// legend that hides and shows series, and a summary a screen reader can read.
import 'dart:math' as math;
import 'package:flutter/services.dart';
import 'package:flutter/widgets.dart';
import 'theme.dart';
/// One run of values, one per label: "Desktop", "Mobile".
@immutable
class ChartSeries {
const ChartSeries(
this.label,
this.values, {
this.color,
this.colors,
this.icon,
});
/// The series' name, in the legend, the tooltip and what a screen reader hears.
final String label;
/// The values, in order.
final List<double> values;
/// Null takes the theme's chart colours in turn.
final Color? color;
/// A colour for each value, for bars that each mean something of their own.
final List<Color>? colors;
/// Shown in the legend and the tooltip in place of the colour swatch.
final IconData? icon;
}
/// One part of a pie, or one ring of a radial chart.
@immutable
class ChartSlice {
const ChartSlice(this.label, this.value, {this.color, this.icon});
/// The slice's name, in the legend, the tooltip and what a screen reader hears.
final String label;
/// Its size; its share is this over the total.
final double value;
/// Null takes the theme's chart colours in turn.
final Color? color;
/// Shown in the legend and the tooltip in place of the colour swatch.
final IconData? icon;
}
/// How a line goes from one value to the next.
enum ChartCurve {
/// A smooth curve that never overshoots a value.
smooth,
/// Straight from point to point.
linear,
/// Level, then up or down halfway between: for values that hold until they change.
step,
}
/// The mark beside each value in a tooltip.
enum ChartIndicator {
/// A small square of the series' colour.
dot,
/// A bar of the colour down the side of the rows.
line,
/// The same bar, dashed.
dashed,
/// No mark.
none,
}
/// How a chart's tooltip looks.
@immutable
class ChartTooltip {
const ChartTooltip({
this.enabled = true,
this.indicator = ChartIndicator.dot,
this.showTitle = true,
this.title,
this.total = false,
});
/// False: no tooltip, though the keys still step and a screen reader still reads.
final bool enabled;
/// The mark beside each value: a dot, a line, a dashed line or none.
final ChartIndicator indicator;
/// False hides the label (the month, say) at the top.
final bool showTitle;
/// Writes the label at the top: 'July 2026' for 'Jul'.
final String Function(String label)? title;
/// A last row adding the values up.
final bool total;
}
/// Where a chart's legend sits.
enum ChartLegend { none, top, bottom }
String _plain(double v) =>
v == v.roundToDouble() ? v.toInt().toString() : v.toStringAsFixed(1);
String _percent(double v) => '${(v * 100).round()}%';
/// A round number at or above [max] for the end of the scale: 1, 2, 2.5 or 5 times a
/// power of ten.
double _niceTop(double max) {
if (max <= 0) return 1;
final p = math.pow(10, (math.log(max) / math.ln10).floor()).toDouble();
for (final m in [1.0, 2.0, 2.5, 5.0, 10.0]) {
if (m * p >= max) return m * p;
}
return 10 * p;
}
enum _Kind { bar, line, area }
/// Bars by label, series side by side or stacked; upright or lying [horizontal]. Values
/// below zero hang down from a zero line.
///
/// ```dart
/// BarChart(
/// labels: ['Jan', 'Feb', 'Mar'],
/// series: [ChartSeries('Desktop', [186, 305, 237]), ChartSeries('Mobile', [80, 200, 120])],
/// )
/// ```
class BarChart extends _Cartesian {
const BarChart({
super.key,
required super.labels,
required super.series,
super.height,
super.stacked,
super.expand,
super.horizontal,
super.active,
super.valueLabels,
super.axis,
super.grid,
super.format,
super.semanticLabel,
super.legend,
super.tooltip,
}) : super(kind: _Kind.bar);
}
/// Lines through each series' values.
class LineChart extends _Cartesian {
const LineChart({
super.key,
required super.labels,
required super.series,
super.height,
super.curve,
super.dots,
super.valueLabels,
super.axis,
super.grid,
super.format,
super.semanticLabel,
super.legend,
super.tooltip,
}) : super(kind: _Kind.line);
}
/// Lines with the area under them filled; [stacked] puts each series on the one below,
/// and [expand] shows each label's values as shares of their whole.
class AreaChart extends _Cartesian {
const AreaChart({
super.key,
required super.labels,
required super.series,
super.height,
super.stacked,
super.expand,
super.curve,
super.dots,
super.gradient,
super.axis,
super.grid,
super.format,
super.semanticLabel,
super.legend,
super.tooltip,
}) : super(kind: _Kind.area);
}
abstract class _Cartesian extends StatefulWidget {
const _Cartesian({
super.key,
required this.labels,
required this.series,
required this.kind,
this.height = 250,
this.stacked = false,
this.expand = false,
this.horizontal = false,
this.curve = ChartCurve.smooth,
this.dots = false,
this.gradient = true,
this.active,
this.valueLabels = false,
this.axis = false,
this.grid = true,
this.legend = ChartLegend.bottom,
this.tooltip = const ChartTooltip(),
this.format,
this.semanticLabel,
});
/// One per bar, point or group: the months, say.
final List<String> labels;
/// The values, one run per series.
final List<ChartSeries> series;
final _Kind kind;
/// The chart's height, labels included.
final double height;
/// Each series on top of the one before.
final bool stacked;
/// Stacked, and each label's values as shares of their whole, up to 100%.
final bool expand;
/// Bars lying along, labels down the side.
final bool horizontal;
/// Smooth, straight, or in steps.
final ChartCurve curve;
/// A dot on each value of a line.
final bool dots;
/// An area fades to nothing at the bottom; false fills it evenly.
final bool gradient;
/// One label's bars drawn full and the rest faded: the one being talked about.
final int? active;
/// Each value written on its bar or point.
final bool valueLabels;
/// The scale's numbers beside the plot.
final bool axis;
/// Lines across the plot at each step of the scale.
final bool grid;
/// Where the legend sits, or none. Tapping a name hides its series.
final ChartLegend legend;
/// How the tooltip looks, or that there is none.
final ChartTooltip tooltip;
/// How a value is written in the tooltip, on the chart and read out: "KES 2,400".
/// Shares are written as percentages unless you say.
final String Function(double value)? format;
/// What the chart shows, read before its values: 'Visitors by month'.
final String? semanticLabel;
@override
State<_Cartesian> createState() => _CartesianState();
}
class _CartesianState extends State<_Cartesian>
with SingleTickerProviderStateMixin {
late final _grow = AnimationController(
vsync: this,
duration: const Duration(milliseconds: 700),
);
int? _at;
bool _focused = false;
final _hidden = <int>{};
@override
void didChangeDependencies() {
super.didChangeDependencies();
final still = MediaQuery.maybeDisableAnimationsOf(context) ?? false;
if (still) {
_grow.value = 1;
} else if (_grow.isDismissed) {
_grow.forward();
}
}
@override
void dispose() {
_grow.dispose();
super.dispose();
}
bool get _stacked => widget.stacked || widget.expand;
String Function(double) get _format =>
widget.format ?? (widget.expand ? _percent : _plain);
/// The visible series, by their place in [_Cartesian.series].
List<int> get _shown => [
for (var i = 0; i < widget.series.length; i++)
if (!_hidden.contains(i)) i,
];
/// What is drawn for series [s] at label [i]: its value, or its share when expanded.
double _value(int s, int i) {
final v = widget.series[s].values[i];
if (!widget.expand) return v;
final whole = _shown.fold<double>(
0,
(a, k) => a + widget.series[k].values[i],
);
return whole == 0 ? 0 : v / whole;
}
String get _summary => [
for (final (i, label) in widget.labels.indexed)
'$label: ${[for (final s in _shown) '${widget.series[s].label} ${_format(_value(s, i))}'].join(', ')}',
].join('; ');
void _step(int by) {
final n = widget.labels.length;
setState(() => _at = ((_at ?? (by > 0 ? -1 : n)) + by).clamp(0, n - 1));
}
void _toggle(int s) => setState(() {
if (_hidden.contains(s)) {
_hidden.remove(s);
} else if (_shown.length > 1) {
// One series always stays.
_hidden.add(s);
}
});
@override
Widget build(BuildContext context) {
final t = AshlarTheme.of(context);
final c = t.colors;
final colors = [
for (final (i, s) in widget.series.indexed)
s.color ?? c.charts[i % c.charts.length],
];
final n = widget.labels.length;
final shown = _shown;
// The scale: from zero, or from below it, to a round number above the largest.
var lo = 0.0, hi = 0.0;
for (var i = 0; i < n; i++) {
if (_stacked) {
hi = math.max(hi, shown.fold<double>(0, (a, s) => a + _value(s, i)));
} else {
for (final s in shown) {
hi = math.max(hi, _value(s, i));
lo = math.min(lo, _value(s, i));
}
}
}
hi = widget.expand ? 1 : _niceTop(hi);
if (lo < 0) lo = -_niceTop(-lo);
final across = widget.horizontal && widget.kind == _Kind.bar;
// Room for the scale's numbers, and for the labels down the side of lying bars.
final gutter = across ? 80.0 : (widget.axis ? 40.0 : 0.0);
// The labels' line, as tall as their text is at its size.
final line = math.max(20.0, MediaQuery.textScalerOf(context).scale(16) + 4);
final foot = across ? (widget.axis ? line : 0.0) : line + 4;
final legend = widget.legend != ChartLegend.none && widget.series.length > 1
? _Legend(
items: [
for (final (i, s) in widget.series.indexed)
(colors[i], s.label, s.icon, !_hidden.contains(i)),
],
onToggle: _toggle,
)
: null;
return Semantics(
container: true,
label: widget.semanticLabel ?? 'Chart',
value: _summary,
child: Focus(
onFocusChange: (f) => setState(() {
_focused =
f &&
FocusManager.instance.highlightMode ==
FocusHighlightMode.traditional;
if (!f) _at = null;
}),
onKeyEvent: (node, e) {
if (e is! KeyDownEvent && e is! KeyRepeatEvent) {
return KeyEventResult.ignored;
}
final next = across
? LogicalKeyboardKey.arrowDown
: LogicalKeyboardKey.arrowRight;
final back = across
? LogicalKeyboardKey.arrowUp
: LogicalKeyboardKey.arrowLeft;
if (e.logicalKey == next) {
_step(1);
return KeyEventResult.handled;
}
if (e.logicalKey == back) {
_step(-1);
return KeyEventResult.handled;
}
return KeyEventResult.ignored;
},
child: Column(
mainAxisSize: MainAxisSize.min,
crossAxisAlignment: CrossAxisAlignment.stretch,
children: [
if (legend != null && widget.legend == ChartLegend.top) ...[
legend,
const SizedBox(height: 12),
],
SizedBox(
height: widget.height,
child: LayoutBuilder(
builder: (context, box) {
final plot = Rect.fromLTWH(
gutter,
0,
box.maxWidth - gutter,
widget.height - foot,
);
int? indexAt(Offset p) {
if (n == 0) return null;
final along = across
? (p.dy - plot.top) / plot.height
: (p.dx - plot.left) / plot.width;
if (along < 0 || along > 1) return null;
return (along * n).floor().clamp(0, n - 1);
}
final band = (across ? plot.height : plot.width) / n;
return MouseRegion(
onHover: (e) =>
setState(() => _at = indexAt(e.localPosition)),
onExit: (_) => setState(() => _at = null),
child: GestureDetector(
onTapDown: (d) =>
setState(() => _at = indexAt(d.localPosition)),
child: Stack(
clipBehavior: Clip.none,
children: [
Positioned.fill(
child: AnimatedBuilder(
animation: _grow,
builder: (context, _) => CustomPaint(
painter: _CartesianPainter(
kind: widget.kind,
values: [
for (final s in shown)
[
for (var i = 0; i < n; i++)
_value(s, i),
],
],
colors: [for (final s in shown) colors[s]],
barColors: [
for (final s in shown)
widget.series[s].colors,
],
plot: plot,
lo: lo,
hi: hi,
stacked: _stacked,
across: across,
curve: widget.curve,
dots: widget.dots,
gradient: widget.gradient,
active: widget.active,
valueLabels: widget.valueLabels,
axis: widget.axis,
grid: widget.grid,
format: _format,
text: t.text.xs.copyWith(
color: c.mutedForeground,
),
valueText: t.text.xs.copyWith(
color: c.foreground,
fontWeight: FontWeight.w500,
),
grow: Curves.easeOutCubic.transform(
_grow.value,
),
at: _at,
gridColor: c.border,
cursor: c.muted,
ring: _focused ? c.ring : null,
),
),
),
),
// The labels: along the bottom, or down the side for lying
// bars. Time runs left to right in any language, as drawn.
if (across)
for (final (i, l) in widget.labels.indexed)
Positioned(
left: 0,
width: gutter - 8,
top: plot.top + i * band,
height: band,
child: ExcludeSemantics(
child: Align(
alignment: Alignment.centerRight,
child: Text(
l,
maxLines: 1,
overflow: TextOverflow.ellipsis,
style: t.text.xs.copyWith(
color: c.mutedForeground,
),
),
),
),
)
else
Positioned(
left: plot.left,
right: 0,
bottom: 0,
height: line,
child: ExcludeSemantics(
child: Row(
textDirection: TextDirection.ltr,
children: [
for (final l in widget.labels)
Expanded(
child: Text(
l,
textAlign: TextAlign.center,
maxLines: 1,
overflow: TextOverflow.clip,
style: t.text.xs.copyWith(
color: c.mutedForeground,
),
),
),
],
),
),
),
if (_at != null && widget.tooltip.enabled)
_Tooltip(
at: across
? Offset(
plot.right * .6,
plot.top + (_at! + .5) * band,
)
: Offset(plot.left + (_at! + .5) * band, 8),
width: box.maxWidth,
style: widget.tooltip,
title:
widget.tooltip.title?.call(
widget.labels[_at!],
) ??
widget.labels[_at!],
rows: [
for (final s in shown)
(
widget.series[s].colors?[_at!] ?? colors[s],
widget.series[s].label,
_format(_value(s, _at!)),
widget.series[s].icon,
),
],
total: widget.tooltip.total
? _format(
shown.fold<double>(
0,
(a, s) => a + _value(s, _at!),
),
)
: null,
),
],
),
),
);
},
),
),
if (legend != null && widget.legend == ChartLegend.bottom) ...[
const SizedBox(height: 12),
legend,
],
],
),
),
);
}
}
class _CartesianPainter extends CustomPainter {
_CartesianPainter({
required this.kind,
required this.values,
required this.colors,
required this.barColors,
required this.plot,
required this.lo,
required this.hi,
required this.stacked,
required this.across,
required this.curve,
required this.dots,
required this.gradient,
required this.active,
required this.valueLabels,
required this.axis,
required this.grid,
required this.format,
required this.text,
required this.valueText,
required this.grow,
required this.at,
required this.gridColor,
required this.cursor,
required this.ring,
});
final _Kind kind;
/// The values, in order.
final List<List<double>> values;
final List<Color> colors;
final List<List<Color>?> barColors;
final Rect plot;
final double lo, hi, grow;
final bool stacked, across, dots, gradient, valueLabels, axis, grid;
final ChartCurve curve;
final int? active, at;
final String Function(double) format;
final TextStyle text, valueText;
final Color gridColor, cursor;
final Color? ring;
/// Where value [v] falls along the value axis, in pixels: up the plot, or along it for
/// lying bars. Grows from the zero line as the chart appears.
double _at(double v) {
double place(double x) => across
? plot.left + (x - lo) / (hi - lo) * plot.width
: plot.bottom - (x - lo) / (hi - lo) * plot.height;
final zero = place(0);
return zero + (place(v) - zero) * grow;
}
void _write(
Canvas canvas,
String s,
Offset at,
TextStyle style,
Alignment align,
) {
final p = TextPainter(
text: TextSpan(text: s, style: style),
textDirection: TextDirection.ltr,
)..layout();
p.paint(
canvas,
at - Offset((align.x + 1) / 2 * p.width, (align.y + 1) / 2 * p.height),
);
}
@override
void paint(Canvas canvas, Size size) {
if (values.isEmpty || values.first.isEmpty) return;
final n = values.first.length;
final band = (across ? plot.height : plot.width) / n;
// The scale: four steps, the zero line solid.
final line = Paint()
..color = gridColor
..strokeWidth = 1;
for (var i = 0; i <= 4; i++) {
final v = lo + (hi - lo) * i / 4;
if (across) {
final gx = plot.left + (v - lo) / (hi - lo) * plot.width;
if (grid) {
canvas.drawLine(
Offset(gx.roundToDouble() + .5, plot.top),
Offset(gx.roundToDouble() + .5, plot.bottom),
line,
);
}
if (axis) {
_write(
canvas,
format(v),
Offset(gx, plot.bottom + 4),
text,
Alignment.topCenter,
);
}
} else {
final gy =
(plot.bottom - (v - lo) / (hi - lo) * plot.height).roundToDouble() +
.5;
if (grid || v == 0) {
canvas.drawLine(Offset(plot.left, gy), Offset(plot.right, gy), line);
}
if (axis) {
_write(
canvas,
format(v),
Offset(plot.left - 8, gy),
text,
Alignment.centerRight,
);
}
}
}
// The column under the pointer, behind the bars.
if (at != null && kind == _Kind.bar) {
canvas.drawRRect(
RRect.fromRectAndRadius(
across
? Rect.fromLTWH(
plot.left,
plot.top + at! * band + 2,
plot.width,
band - 4,
)
: Rect.fromLTWH(
plot.left + at! * band + 2,
plot.top,
band - 4,
plot.height,
),
const Radius.circular(6),
),
Paint()..color = cursor,
);
}
if (ring != null) {
canvas.drawRRect(
RRect.fromRectAndRadius(plot.inflate(4), const Radius.circular(8)),
Paint()
..color = ring!
..style = PaintingStyle.stroke
..strokeWidth = 2,
);
}
if (kind == _Kind.bar) {
final groups = stacked ? 1 : values.length;
final inner = band * .7, each = inner / groups;
for (var i = 0; i < n; i++) {
var base = 0.0;
for (var s = 0; s < values.length; s++) {
final v = values[s][i];
final start =
i * band + (band - inner) / 2 + (stacked ? 0 : s * each);
final thick = (stacked ? inner : each) - (stacked ? 0 : 2);
final from = stacked ? base : 0.0, to = from + v;
base = to;
final a = _at(from), b = _at(to);
final rect = across
? Rect.fromLTRB(
math.min(a, b),
plot.top + start,
math.max(a, b),
plot.top + start + thick,
)
: Rect.fromLTRB(
plot.left + start,
math.min(a, b),
plot.left + start + thick,
math.max(a, b),
);
// Only a bar's far end rounds; in a stack, only the last segment's.
final round = !stacked || s == values.length - 1;
const r = Radius.circular(4);
final down = v < 0;
final corners = across
? RRect.fromRectAndCorners(
rect,
topRight: round && !down ? r : Radius.zero,
bottomRight: round && !down ? r : Radius.zero,
topLeft: round && down ? r : Radius.zero,
bottomLeft: round && down ? r : Radius.zero,
)
: RRect.fromRectAndCorners(
rect,
topLeft: round && !down ? r : Radius.zero,
topRight: round && !down ? r : Radius.zero,
bottomLeft: round && down ? r : Radius.zero,
bottomRight: round && down ? r : Radius.zero,
);
final color = barColors[s]?[i] ?? colors[s];
canvas.drawRRect(
corners,
Paint()
..color = active == null || active == i
? color
: color.withValues(alpha: color.a * .35),
);
if (valueLabels &&
grow == 1 &&
(!stacked || s == values.length - 1)) {
final shown = stacked ? to : v;
_write(
canvas,
format(shown),
across
? Offset(rect.right + 6, rect.center.dy)
: Offset(
rect.center.dx,
down ? rect.bottom + 4 : rect.top - 4,
),
valueText,
across
? Alignment.centerLeft
: (down ? Alignment.topCenter : Alignment.bottomCenter),
);
}
}
}
return;
}
// Lines and areas: points at the middle of each band.
final base = List<double>.filled(n, 0);
for (var s = 0; s < values.length; s++) {
final lows = List<double>.of(base);
final points = [
for (var i = 0; i < n; i++)
Offset(
plot.left + (i + .5) * band,
_at((stacked ? base[i] : 0) + values[s][i]),
),
];
if (stacked) {
for (var i = 0; i < n; i++) {
base[i] += values[s][i];
}
}
final path = _through(points);
if (kind == _Kind.area) {
final fill = Path.from(path);
if (stacked && s > 0) {
final under = [
for (var i = n - 1; i >= 0; i--)
Offset(plot.left + (i + .5) * band, _at(lows[i])),
];
// Down to the series below and back along it, as one outline.
fill.lineTo(under.first.dx, under.first.dy);
fill.extendWithPath(_through(under), Offset.zero);
} else {
final zero = _at(0);
fill
..lineTo(points.last.dx, zero)
..lineTo(points.first.dx, zero);
}
fill.close();
canvas.drawPath(
fill,
Paint()
..shader = LinearGradient(
begin: Alignment.topCenter,
end: Alignment.bottomCenter,
colors: gradient
? [
colors[s].withValues(alpha: .4),
colors[s].withValues(alpha: .05),
]
: [
colors[s].withValues(alpha: .3),
colors[s].withValues(alpha: .3),
],
).createShader(plot),
);
}
canvas.drawPath(
path,
Paint()
..color = colors[s]
..style = PaintingStyle.stroke
..strokeWidth = 2
..strokeJoin = StrokeJoin.round,
);
for (var i = 0; i < n; i++) {
if (dots || at == i) {
canvas.drawCircle(
points[i],
at == i ? 4 : 3,
Paint()..color = colors[s],
);
}
if (valueLabels && grow == 1) {
_write(
canvas,
format(values[s][i]),
points[i] - const Offset(0, 8),
valueText,
Alignment.bottomCenter,
);
}
}
}
if (at != null) {
final x = plot.left + (at! + .5) * band;
canvas.drawLine(
Offset(x, plot.top),
Offset(x, plot.bottom),
Paint()..color = gridColor,
);
}
}
/// A path through [p]: straight, stepped, or a smooth curve that never overshoots.
Path _through(List<Offset> p) {
final path = Path()..moveTo(p.first.dx, p.first.dy);
if (curve == ChartCurve.step) {
for (var i = 1; i < p.length; i++) {
final mid = (p[i - 1].dx + p[i].dx) / 2;
path
..lineTo(mid, p[i - 1].dy)
..lineTo(mid, p[i].dy)
..lineTo(p[i].dx, p[i].dy);
}
return path;
}
if (curve == ChartCurve.linear || p.length < 3) {
for (final q in p.skip(1)) {
path.lineTo(q.dx, q.dy);
}
return path;
}
// Monotone cubic: tangents from neighbouring slopes, flattened at peaks and troughs.
final m = <double>[];
for (var i = 0; i < p.length; i++) {
double slope(int a, int b) => (p[b].dy - p[a].dy) / (p[b].dx - p[a].dx);
if (i == 0) {
m.add(slope(0, 1));
} else if (i == p.length - 1) {
m.add(slope(i - 1, i));
} else {
final a = slope(i - 1, i), b = slope(i, i + 1);
m.add(a * b <= 0 ? 0 : (a + b) / 2);
}
}
for (var i = 0; i < p.length - 1; i++) {
final dx = (p[i + 1].dx - p[i].dx) / 3;
path.cubicTo(
p[i].dx + dx,
p[i].dy + m[i] * dx,
p[i + 1].dx - dx,
p[i + 1].dy - m[i + 1] * dx,
p[i + 1].dx,
p[i + 1].dy,
);
}
return path;
}
@override
bool shouldRepaint(_CartesianPainter old) => true;
}
/// How a pie writes on its slices.
enum PieLabels {
none,
/// Each slice's value, inside it.
amounts,
/// Each slice's name, outside it.
titles,
}
/// Slices of a whole, as a pie or, with a hole, a donut with [center] in the middle.
/// [inner] adds a second ring inside, for a whole split two ways.
///
/// ```dart
/// PieChart(slices: [ChartSlice('M-Pesa', 275), ChartSlice('Card', 200), ChartSlice('Bank', 90)], center: Text('565'))
/// ```
class PieChart extends StatefulWidget {
const PieChart({
super.key,
required this.slices,
this.inner,
this.size = 250,
this.donut = true,
this.center,
this.active,
this.labels = PieLabels.none,
this.separators = true,
this.legend = ChartLegend.bottom,
this.tooltip = const ChartTooltip(),
this.format = _plain,
this.semanticLabel,
});
/// The slices, clockwise from the top.
final List<ChartSlice> slices;
/// A second ring inside: the same whole split another way.
final List<ChartSlice>? inner;
/// Its width and height.
final double size;
/// A hole in the middle, for the center widget.
final bool donut;
/// In the hole: the figure the chart is about.
final Widget? center;
/// One slice drawn out from the rest: the one being talked about.
final int? active;
/// Writing on the slices: none, each value inside, or each name outside.
final PieLabels labels;
/// A thin line of the page between slices.
final bool separators;
/// Where the legend sits, or none.
final ChartLegend legend;
/// How the tooltip looks, or that there is none.
final ChartTooltip tooltip;
/// How a value is written in the tooltip and read out.
final String Function(double value) format;
/// What a screen reader calls it when its visible text does not say, as for an icon
/// alone.
final String? semanticLabel;
@override
State<PieChart> createState() => _PieChartState();
}
class _PieChartState extends State<PieChart>
with SingleTickerProviderStateMixin {
late final _grow = AnimationController(
vsync: this,
duration: const Duration(milliseconds: 700),
);
int? _at;
@override
void didChangeDependencies() {
super.didChangeDependencies();
final still = MediaQuery.maybeDisableAnimationsOf(context) ?? false;
if (still) {
_grow.value = 1;
} else if (_grow.isDismissed) {
_grow.forward();
}
}
@override
void dispose() {
_grow.dispose();
super.dispose();
}
@override
Widget build(BuildContext context) {
final t = AshlarTheme.of(context);
final c = t.colors;
List<Color> colorsOf(List<ChartSlice> slices) => [
for (final (i, s) in slices.indexed)
s.color ?? c.charts[i % c.charts.length],
];
final colors = colorsOf(widget.slices);
final total = widget.slices.fold<double>(0, (a, s) => a + s.value);
// Names outside the pie need room round it.
final margin = widget.labels == PieLabels.titles ? 36.0 : 0.0;
final pie = widget.size - margin * 2;
int? sliceAt(Offset p) {
final centre = Offset(widget.size / 2, widget.size / 2), d = p - centre;
final r = pie / 2;
if (d.distance > r || (widget.donut && d.distance < r * .6)) return null;
// Angles run clockwise from the top.
var a = math.atan2(d.dy, d.dx) + math.pi / 2;
if (a < 0) a += 2 * math.pi;
var run = 0.0;
for (final (i, s) in widget.slices.indexed) {
run += s.value / total * 2 * math.pi;
if (a <= run) return i;
}
return null;
}
// Where each slice's middle points, clockwise from the top.
final middles = <double>[];
var run = -math.pi / 2;
for (final s in widget.slices) {
final a = total == 0 ? 0.0 : s.value / total * 2 * math.pi;
middles.add(run + a / 2);
run += a;
}
final legend = widget.legend == ChartLegend.none
? null
: _Legend(
items: [
for (final (i, s) in widget.slices.indexed)
(colors[i], s.label, s.icon, true),
],
);
return Semantics(
container: true,
label: widget.semanticLabel ?? 'Chart',
value: [
for (final s in widget.slices) '${s.label} ${widget.format(s.value)}',
].join(', '),
child: Column(
mainAxisSize: MainAxisSize.min,
children: [
if (legend != null && widget.legend == ChartLegend.top) ...[
legend,
const SizedBox(height: 12),
],
MouseRegion(
onHover: (e) => setState(() => _at = sliceAt(e.localPosition)),
onExit: (_) => setState(() => _at = null),
child: GestureDetector(
onTapDown: (d) => setState(() => _at = sliceAt(d.localPosition)),
child: SizedBox.square(
dimension: widget.size,
child: AnimatedBuilder(
animation: _grow,
builder: (context, _) => Stack(
clipBehavior: Clip.none,
alignment: Alignment.center,
children: [
Positioned.fill(
child: Padding(
padding: EdgeInsets.all(margin),
child: CustomPaint(
painter: _PiePainter(
rings: [
(
[for (final s in widget.slices) s.value],
colors,
),
if (widget.inner case final inner?)
(
[for (final s in inner) s.value],
colorsOf(inner),
),
],
donut: widget.donut,
at: _at ?? widget.active,
gap: widget.separators ? c.background : null,
sweep: Curves.easeOutCubic.transform(_grow.value),
),
),
),
),
if (_grow.value == 1 && widget.labels != PieLabels.none)
for (final (i, s) in widget.slices.indexed)
_PieLabel(
at:
Offset(widget.size / 2, widget.size / 2) +
Offset(
math.cos(middles[i]),
math.sin(middles[i]),
) *
(widget.labels == PieLabels.titles
? pie / 2 + 18
: pie / 2 * (widget.donut ? .8 : .65)),
text: widget.labels == PieLabels.titles
? s.label
: widget.format(s.value),
style: widget.labels == PieLabels.titles
? t.text.xs.copyWith(color: c.foreground)
: t.text.xs.copyWith(
color: c.background,
fontWeight: FontWeight.w600,
),
),
if (widget.center != null && widget.donut)
DefaultTextStyle.merge(
style: t.text.xl.copyWith(
fontWeight: FontWeight.w700,
color: c.foreground,
),
textAlign: TextAlign.center,
child: widget.center!,
),
if (_at != null && widget.tooltip.enabled)
Positioned(
top: 0,
left: widget.size * .5,
child: _TooltipCard(
style: widget.tooltip,
title: widget.slices[_at!].label,
rows: [
(
colors[_at!],
'${(widget.slices[_at!].value / total * 100).round()}%',
widget.format(widget.slices[_at!].value),
widget.slices[_at!].icon,
),
],
),
),
],
),
),
),
),
),
if (legend != null && widget.legend == ChartLegend.bottom) ...[
const SizedBox(height: 12),
legend,
],
],
),
);
}
}
/// Text centred on a point, without catching the pointer.
class _PieLabel extends StatelessWidget {
const _PieLabel({required this.at, required this.text, required this.style});
final Offset at;
final String text;
final TextStyle style;
@override
Widget build(BuildContext context) {
final line = math.max(20.0, MediaQuery.textScalerOf(context).scale(16) + 4);
return Positioned(
left: at.dx - 60,
top: at.dy - line / 2,
width: 120,
height: line,
child: IgnorePointer(
child: ExcludeSemantics(
child: Center(
child: Text(
text,
maxLines: 1,
style: style,
textAlign: TextAlign.center,
),
),
),
),
);
}
}
class _PiePainter extends CustomPainter {
_PiePainter({
required this.rings,
required this.donut,
required this.at,
required this.gap,
required this.sweep,
});
/// Each ring's values and colours, outside in.
final List<(List<double>, List<Color>)> rings;
final bool donut;
final int? at;
final Color? gap;
final double sweep;
@override
void paint(Canvas canvas, Size size) {
final r = size.shortestSide / 2;
final centre = size.center(Offset.zero);
// With rings inside, each takes an even share of the width.
final hole = donut ? r * .6 : (rings.length > 1 ? r * .3 : 0.0);
final thick = (r - 4 - hole) / rings.length;
for (final (k, (values, colors)) in rings.indexed) {
final total = values.fold<double>(0, (a, v) => a + v);
if (total <= 0) continue;
final outer = r - 4 - k * thick;
var start = -math.pi / 2;
for (final (i, v) in values.indexed) {
final a = v / total * 2 * math.pi * sweep;
// The slice under the pointer, or the one being talked about, stands out.
final grow = k == 0 && i == at ? 6.0 : 0.0;
final paint = Paint()
..color = colors[i]
..style = PaintingStyle.stroke
..strokeWidth = thick + grow;
canvas.drawArc(
Rect.fromCircle(center: centre, radius: outer - thick / 2 + grow / 2),
start,
a,
false,
paint,
);
if (gap != null) {
// A thin line of the page between slices.
final dir = Offset(math.cos(start), math.sin(start));
canvas.drawLine(
centre + dir * (outer - thick),
centre + dir * (outer + grow),
Paint()
..color = gap!
..strokeWidth = 2,
);
}
start += a;
}
}
}
@override
bool shouldRepaint(_PiePainter old) => true;
}
/// The lines a radar chart is drawn over.
enum RadarGrid {
/// Polygons through the axes.
polygon,
/// Circles round the centre.
circle,
/// Nothing behind the shapes.
none,
}
/// Several values for each series round a circle, joined into a shape: how a series
/// spreads across the labels, and how series compare.
///
/// ```dart
/// RadarChart(
/// labels: ['Speed', 'Range', 'Price', 'Comfort', 'Safety'],
/// series: [ChartSeries('This year', [80, 60, 70, 90, 75])],
/// )
/// ```
class RadarChart extends StatefulWidget {
const RadarChart({
super.key,
required this.labels,
required this.series,
this.size = 280,
this.grid = RadarGrid.polygon,
this.spokes = true,
this.gridFill = false,
this.fill = true,
this.dots = false,
this.max,
this.legend = ChartLegend.bottom,
this.tooltip = const ChartTooltip(),
this.format = _plain,
this.semanticLabel,
});
/// One per axis, round the circle clockwise from the top.
final List<String> labels;
/// The values, a shape per series.
final List<ChartSeries> series;
/// Its width and height, labels included.
final double size;
/// Polygons, circles, or nothing behind the shapes.
final RadarGrid grid;
/// Lines from the centre out to each label.
final bool spokes;
/// The grid's bands filled, every other one.
final bool gridFill;
/// The shapes filled; false draws their outlines alone.
final bool fill;
/// A dot on each value.
final bool dots;
/// The value at the edge; a round number above the largest when not given.
final double? max;
/// Where the legend sits, or none. Tapping a name hides its series.
final ChartLegend legend;
/// How the tooltip looks, or that there is none.
final ChartTooltip tooltip;
/// How a value is written in the tooltip and read out.
final String Function(double value) format;
/// What a screen reader calls it when its visible text does not say, as for an icon
/// alone.
final String? semanticLabel;
@override
State<RadarChart> createState() => _RadarChartState();
}
class _RadarChartState extends State<RadarChart>
with SingleTickerProviderStateMixin {
late final _grow = AnimationController(
vsync: this,
duration: const Duration(milliseconds: 700),
);
int? _at;
final _hidden = <int>{};
@override
void didChangeDependencies() {
super.didChangeDependencies();
final still = MediaQuery.maybeDisableAnimationsOf(context) ?? false;
if (still) {
_grow.value = 1;
} else if (_grow.isDismissed) {
_grow.forward();
}
}
@override
void dispose() {
_grow.dispose();
super.dispose();
}
@override
Widget build(BuildContext context) {
final t = AshlarTheme.of(context);
final c = t.colors;
final n = widget.labels.length;
final colors = [
for (final (i, s) in widget.series.indexed)
s.color ?? c.charts[i % c.charts.length],
];
final shown = [
for (var i = 0; i < widget.series.length; i++)
if (!_hidden.contains(i)) i,
];
final top =
widget.max ??
_niceTop(
[for (final s in shown) ...widget.series[s].values]
.fold<double>(0, math.max),
);
// Room round the shape for the labels.
const margin = 40.0;
final r = widget.size / 2 - margin;
final centre = Offset(widget.size / 2, widget.size / 2);
double angle(int i) => -math.pi / 2 + i * 2 * math.pi / n;
int? axisAt(Offset p) {
final d = p - centre;
if (d.distance > r + margin || n == 0) return null;
var a = math.atan2(d.dy, d.dx) + math.pi / 2;
if (a < 0) a += 2 * math.pi;
return (a / (2 * math.pi) * n).round() % n;
}
final legend = widget.legend != ChartLegend.none && widget.series.length > 1
? _Legend(
items: [
for (final (i, s) in widget.series.indexed)
(colors[i], s.label, s.icon, !_hidden.contains(i)),
],
onToggle: (s) => setState(() {
if (_hidden.contains(s)) {
_hidden.remove(s);
} else if (shown.length > 1) {
_hidden.add(s);
}
}),
)
: null;
return Semantics(
container: true,
label: widget.semanticLabel ?? 'Chart',
value: [
for (final (i, l) in widget.labels.indexed)
'$l: ${[for (final s in shown) '${widget.series[s].label} ${widget.format(widget.series[s].values[i])}'].join(', ')}',
].join('; '),
child: Column(
mainAxisSize: MainAxisSize.min,
children: [
if (legend != null && widget.legend == ChartLegend.top) ...[
legend,
const SizedBox(height: 12),
],
MouseRegion(
onHover: (e) => setState(() => _at = axisAt(e.localPosition)),
onExit: (_) => setState(() => _at = null),
child: GestureDetector(
onTapDown: (d) => setState(() => _at = axisAt(d.localPosition)),
child: SizedBox.square(
dimension: widget.size,
child: Stack(
clipBehavior: Clip.none,
children: [
Positioned.fill(
child: AnimatedBuilder(
animation: _grow,
builder: (context, _) => CustomPaint(
painter: _RadarPainter(
n: n,
values: [
for (final s in shown) widget.series[s].values,
],
colors: [for (final s in shown) colors[s]],
top: top,
r: r,
centre: centre,
grid: widget.grid,
spokes: widget.spokes,
gridFill: widget.gridFill ? c.muted : null,
fill: widget.fill,
dots: widget.dots,
at: _at,
gridColor: c.border,
grow: Curves.easeOutCubic.transform(_grow.value),
),
),
),
),
for (var i = 0; i < n; i++)
_PieLabel(
at:
centre +
Offset(math.cos(angle(i)), math.sin(angle(i))) *
(r + 18),
text: widget.labels[i],
style: t.text.xs.copyWith(
color: i == _at ? c.foreground : c.mutedForeground,
fontWeight: i == _at ? FontWeight.w500 : null,
),
),
if (_at != null && widget.tooltip.enabled)
Positioned(
top: 0,
left: widget.size * .55,
child: _TooltipCard(
style: widget.tooltip,
title:
widget.tooltip.title?.call(widget.labels[_at!]) ??
widget.labels[_at!],
rows: [
for (final s in shown)
(
colors[s],
widget.series[s].label,
widget.format(widget.series[s].values[_at!]),
widget.series[s].icon,
),
],
),
),
],
),
),
),
),
if (legend != null && widget.legend == ChartLegend.bottom) ...[
const SizedBox(height: 12),
legend,
],
],
),
);
}
}
class _RadarPainter extends CustomPainter {
_RadarPainter({
required this.n,
required this.values,
required this.colors,
required this.top,
required this.r,
required this.centre,
required this.grid,
required this.spokes,
required this.gridFill,
required this.fill,
required this.dots,
required this.at,
required this.gridColor,
required this.grow,
});
final int n;
final List<List<double>> values;
final List<Color> colors;
final double top, r, grow;
final Offset centre;
final RadarGrid grid;
final bool spokes, fill, dots;
final Color? gridFill;
final int? at;
final Color gridColor;
Offset _point(int i, double distance) {
final a = -math.pi / 2 + i * 2 * math.pi / n;
return centre + Offset(math.cos(a), math.sin(a)) * distance;
}
Path _ring(double distance) {
if (grid == RadarGrid.circle) {
return Path()..addOval(Rect.fromCircle(center: centre, radius: distance));
}
final p = Path()..moveTo(_point(0, distance).dx, _point(0, distance).dy);
for (var i = 1; i < n; i++) {
p.lineTo(_point(i, distance).dx, _point(i, distance).dy);
}
return p..close();
}
@override
void paint(Canvas canvas, Size size) {
if (n < 3) return;
final line = Paint()
..color = gridColor
..style = PaintingStyle.stroke;
if (grid != RadarGrid.none) {
// Bands from the edge in, every other one filled when asked.
for (var k = 4; k >= 1; k--) {
final ring = _ring(r * k / 4);
if (gridFill != null && k.isOdd) {
canvas.drawPath(
ring,
Paint()..color = gridFill!.withValues(alpha: .6),
);
}
canvas.drawPath(ring, line);
}
}
if (spokes) {
for (var i = 0; i < n; i++) {
canvas.drawLine(
centre,
_point(i, r),
i == at
? (Paint()
..color = gridColor
..strokeWidth = 2)
: line,
);
}
}
for (final (s, v) in values.indexed) {
final shape = Path();
for (var i = 0; i < n; i++) {
final p = _point(i, r * (v[i] / top).clamp(0, 1) * grow);
i == 0 ? shape.moveTo(p.dx, p.dy) : shape.lineTo(p.dx, p.dy);
}
shape.close();
if (fill) {
canvas.drawPath(
shape,
Paint()..color = colors[s].withValues(alpha: .55),
);
}
canvas.drawPath(
shape,
Paint()
..color = colors[s]
..style = PaintingStyle.stroke
..strokeWidth = 2
..strokeJoin = StrokeJoin.round,
);
for (var i = 0; i < n; i++) {
if (dots || i == at) {
canvas.drawCircle(
_point(i, r * (v[i] / top).clamp(0, 1) * grow),
i == at ? 4 : 3,
Paint()..color = colors[s],
);
}
}
}
}
@override
bool shouldRepaint(_RadarPainter old) => true;
}
/// Values as arcs round a centre: one ring each, or one ring split between them
/// ([stacked]); round the whole circle, or the top half.
///
/// ```dart
/// RadialChart(slices: [ChartSlice('Visitors', 1260)], max: 2000, center: Text('1,260'))
/// ```
class RadialChart extends StatefulWidget {
const RadialChart({
super.key,
required this.slices,
this.max,
this.size = 250,
this.stacked = false,
this.half = false,
this.track = true,
this.center,
this.legend = ChartLegend.none,
this.tooltip = const ChartTooltip(),
this.format = _plain,
this.semanticLabel,
});
/// The values, a ring each from the outside in, or parts of one ring.
final List<ChartSlice> slices;
/// The value a full ring stands for; the largest value, or the total when stacked,
/// when not given.
final double? max;
/// Its width; a half ring is about half as tall.
final double size;
/// One ring, split between the slices, in place of a ring each.
final bool stacked;
/// The top half of the circle, a gauge, in place of all of it.
final bool half;
/// A faint full ring behind each arc, to show what a full one would be.
final bool track;
/// In the middle: the figure the chart is about.
final Widget? center;
/// Where the legend sits, or none.
final ChartLegend legend;
/// How the tooltip looks, or that there is none.
final ChartTooltip tooltip;
/// How a value is written in the tooltip and read out.
final String Function(double value) format;
/// What a screen reader calls it when its visible text does not say, as for an icon
/// alone.
final String? semanticLabel;
@override
State<RadialChart> createState() => _RadialChartState();
}
class _RadialChartState extends State<RadialChart>
with SingleTickerProviderStateMixin {
late final _grow = AnimationController(
vsync: this,
duration: const Duration(milliseconds: 900),
);
int? _at;
@override
void didChangeDependencies() {
super.didChangeDependencies();
final still = MediaQuery.maybeDisableAnimationsOf(context) ?? false;
if (still) {
_grow.value = 1;
} else if (_grow.isDismissed) {
_grow.forward();
}
}
@override
void dispose() {
_grow.dispose();
super.dispose();
}
@override
Widget build(BuildContext context) {
final t = AshlarTheme.of(context);
final c = t.colors;
final colors = [
for (final (i, s) in widget.slices.indexed)
s.color ?? c.charts[i % c.charts.length],
];
final values = [for (final s in widget.slices) s.value];
final max =
widget.max ??
(widget.stacked
? values.fold<double>(0, (a, v) => a + v)
: values.fold<double>(0, math.max));
final height = widget.half ? widget.size / 2 + 24 : widget.size;
final legend = widget.legend == ChartLegend.none
? null
: _Legend(
items: [
for (final (i, s) in widget.slices.indexed)
(colors[i], s.label, s.icon, true),
],
);
// Which arc is under the pointer: the ring it is on, or the part of the one ring.
int? arcAt(Offset p) {
final centre = Offset(widget.size / 2, widget.size / 2);
final d = p - centre;
final r = widget.size / 2 - 4;
if (d.distance > r) return null;
if (widget.stacked) {
if (d.distance < r * .7) return null;
var a = math.atan2(d.dy, d.dx) - (widget.half ? math.pi : -math.pi / 2);
while (a < 0) {
a += 2 * math.pi;
}
final whole = widget.half ? math.pi : 2 * math.pi;
var run = 0.0;
for (final (i, v) in values.indexed) {
run += v / max * whole;
if (a <= run) return i;
}
return null;
}
final thick = r * .6 / values.length;
final ring = ((r - d.distance) / thick).floor();
return ring >= 0 && ring < values.length ? ring : null;
}
return Semantics(
container: true,
label: widget.semanticLabel ?? 'Chart',
value: [
for (final s in widget.slices)
'${s.label} ${widget.format(s.value)} of ${widget.format(max)}',
].join(', '),
child: Column(
mainAxisSize: MainAxisSize.min,
children: [
if (legend != null && widget.legend == ChartLegend.top) ...[
legend,
const SizedBox(height: 12),
],
MouseRegion(
onHover: (e) => setState(() => _at = arcAt(e.localPosition)),
onExit: (_) => setState(() => _at = null),
child: GestureDetector(
onTapDown: (d) => setState(() => _at = arcAt(d.localPosition)),
child: SizedBox(
width: widget.size,
height: height,
child: Stack(
clipBehavior: Clip.none,
children: [
Positioned(
left: 0,
top: 0,
width: widget.size,
height: widget.size,
child: AnimatedBuilder(
animation: _grow,
builder: (context, _) => CustomPaint(
painter: _RadialPainter(
values: values,
colors: colors,
max: max,
stacked: widget.stacked,
half: widget.half,
track: widget.track ? c.muted : null,
at: _at,
grow: Curves.easeOutCubic.transform(_grow.value),
),
),
),
),
if (widget.center != null)
Positioned(
left: 0,
width: widget.size,
top: widget.half ? widget.size / 2 - 48 : 0,
height: widget.half ? 56 : widget.size,
child: Center(
child: DefaultTextStyle.merge(
style: t.text.xl.copyWith(
fontWeight: FontWeight.w700,
color: c.foreground,
),
textAlign: TextAlign.center,
child: widget.center!,
),
),
),
if (_at != null && widget.tooltip.enabled)
Positioned(
top: 0,
left: widget.size * .55,
child: _TooltipCard(
style: widget.tooltip,
title: widget.slices[_at!].label,
rows: [
(
colors[_at!],
'${(values[_at!] / max * 100).round()}%',
widget.format(values[_at!]),
widget.slices[_at!].icon,
),
],
),
),
],
),
),
),
),
if (legend != null && widget.legend == ChartLegend.bottom) ...[
const SizedBox(height: 12),
legend,
],
],
),
);
}
}
class _RadialPainter extends CustomPainter {
_RadialPainter({
required this.values,
required this.colors,
required this.max,
required this.stacked,
required this.half,
required this.track,
required this.at,
required this.grow,
});
final List<double> values;
final List<Color> colors;
final double max, grow;
final bool stacked, half;
final Color? track;
final int? at;
@override
void paint(Canvas canvas, Size size) {
if (values.isEmpty || max <= 0) return;
final r = size.shortestSide / 2 - 4;
final centre = size.center(Offset.zero);
final start = half ? math.pi : -math.pi / 2;
final whole = half ? math.pi : 2 * math.pi;
Paint stroke(Color color, double width) => Paint()
..color = color
..style = PaintingStyle.stroke
..strokeWidth = width
..strokeCap = StrokeCap.round;
if (stacked) {
final thick = r * .3;
final rect = Rect.fromCircle(center: centre, radius: r - thick / 2);
if (track != null) {
canvas.drawArc(rect, start, whole, false, stroke(track!, thick));
}
var from = start;
for (final (i, v) in values.indexed) {
final a = v / max * whole * grow;
canvas.drawArc(
rect,
from,
a,
false,
stroke(colors[i], thick + (i == at ? 6 : 0))
..strokeCap = StrokeCap.butt,
);
from += a;
}
return;
}
// A ring each, the first outside, with a little room between them.
final thick = r * .6 / values.length;
for (final (i, v) in values.indexed) {
final radius = r - thick * i - thick / 2;
final rect = Rect.fromCircle(center: centre, radius: radius);
final width = thick * .75 + (i == at ? 4 : 0);
if (track != null) {
canvas.drawArc(rect, start, whole, false, stroke(track!, thick * .75));
}
canvas.drawArc(
rect,
start,
(v / max).clamp(0, 1) * whole * grow,
false,
stroke(colors[i], width),
);
}
}
@override
bool shouldRepaint(_RadialPainter old) => true;
}
/// The tooltip over a chart, kept inside its width.
class _Tooltip extends StatelessWidget {
const _Tooltip({
required this.at,
required this.width,
required this.style,
required this.title,
required this.rows,
this.total,
});
final Offset at;
final double width;
final ChartTooltip style;
final String title;
final List<(Color, String, String, IconData?)> rows;
final String? total;
@override
Widget build(BuildContext context) {
// Right of the pointer, or left of it near the right edge.
final right = at.dx > width * .6;
return Positioned(
top: at.dy,
left: right ? null : at.dx + 12,
right: right ? width - at.dx + 12 : null,
child: IgnorePointer(
child: _TooltipCard(
style: style,
title: title,
rows: rows,
total: total,
),
),
);
}
}
class _TooltipCard extends StatelessWidget {
const _TooltipCard({
required this.style,
required this.title,
required this.rows,
this.total,
});
final ChartTooltip style;
final String title;
final List<(Color, String, String, IconData?)> rows;
final String? total;
@override
Widget build(BuildContext context) {
final t = AshlarTheme.of(context);
final c = t.colors;
Widget mark(Color color, IconData? icon) => switch (style.indicator) {
_ when icon != null => _SeriesIcon(icon, color: color),
ChartIndicator.dot => Container(
width: 10,
height: 10,
decoration: BoxDecoration(
color: color,
borderRadius: BorderRadius.circular(2),
),
),
ChartIndicator.line => Container(width: 4, height: 16, color: color),
ChartIndicator.dashed => SizedBox(
width: 4,
height: 16,
child: CustomPaint(painter: _Dash(color)),
),
ChartIndicator.none => const SizedBox.shrink(),
};
final value = t.text.xs.copyWith(
color: c.foreground,
fontWeight: FontWeight.w500,
fontFeatures: const [FontFeature.tabularFigures()],
);
return ExcludeSemantics(
child: Container(
constraints: const BoxConstraints(minWidth: 128),
padding: const EdgeInsets.symmetric(horizontal: 10, vertical: 6),
decoration: BoxDecoration(
color: c.background,
borderRadius: BorderRadius.circular(t.radiusMd),
border: Border.all(
color: c.border.withValues(alpha: c.border.a * .5),
),
boxShadow: t.shadowLg,
),
child: Column(
mainAxisSize: MainAxisSize.min,
crossAxisAlignment: CrossAxisAlignment.start,
children: [
if (style.showTitle) ...[
Text(
title,
style: t.text.xs.copyWith(
fontWeight: FontWeight.w500,
color: c.foreground,
),
),
const SizedBox(height: 4),
],
for (final (color, label, v, icon) in rows)
Padding(
padding: const EdgeInsets.only(top: 2),
child: Row(
mainAxisSize: MainAxisSize.min,
children: [
mark(color, icon),
if (style.indicator != ChartIndicator.none || icon != null)
const SizedBox(width: 8),
Text(
label,
style: t.text.xs.copyWith(color: c.mutedForeground),
),
const SizedBox(width: 16),
Text(v, style: value),
],
),
),
if (total != null) ...[
const SizedBox(height: 4),
Container(height: 1, width: 120, color: c.border),
const SizedBox(height: 4),
Row(
mainAxisSize: MainAxisSize.min,
children: [
Text(
'Total',
style: t.text.xs.copyWith(
color: c.foreground,
fontWeight: FontWeight.w500,
),
),
const SizedBox(width: 16),
Text(total!, style: value),
],
),
],
],
),
),
);
}
}
/// A series' icon, drawn from its font.
class _SeriesIcon extends StatelessWidget {
const _SeriesIcon(this.icon, {required this.color});
final IconData icon;
static const size = 12.0;
final Color color;
@override
Widget build(BuildContext context) => Text(
String.fromCharCode(icon.codePoint),
style: TextStyle(
fontFamily: icon.fontFamily,
package: icon.fontPackage,
fontSize: size,
height: 1,
color: color,
),
);
}
class _Dash extends CustomPainter {
const _Dash(this.color);
final Color color;
@override
void paint(Canvas canvas, Size size) {
final paint = Paint()..color = color;
for (var y = 0.0; y < size.height; y += 4) {
canvas.drawRect(Rect.fromLTWH(0, y, size.width, 2), paint);
}
}
@override
bool shouldRepaint(_Dash old) => old.color != color;
}
/// The series' names and colours; with [onToggle], each is a button that hides and shows
/// its series.
class _Legend extends StatelessWidget {
const _Legend({required this.items, this.onToggle});
final List<(Color, String, IconData?, bool)> items;
final ValueChanged<int>? onToggle;
@override
Widget build(BuildContext context) {
final t = AshlarTheme.of(context);
final c = t.colors;
Widget item(int i) {
final (color, label, icon, on) = items[i];
final row = Opacity(
opacity: on ? 1 : .4,
child: Row(
mainAxisSize: MainAxisSize.min,
children: [
if (icon != null)
_SeriesIcon(icon, color: color)
else
Container(
width: 8,
height: 8,
decoration: BoxDecoration(
color: color,
borderRadius: BorderRadius.circular(2),
),
),
const SizedBox(width: 6),
Text(
label,
style: t.text.xs.copyWith(
color: c.foreground,
decoration: on ? null : TextDecoration.lineThrough,
),
),
],
),
);
if (onToggle == null) return ExcludeSemantics(child: row);
// A button: pressed, tapped, or Enter or Space from the keyboard.
return Semantics(
button: true,
toggled: on,
label: label,
excludeSemantics: true,
onTap: () => onToggle!(i),
child: _LegendButton(onPressed: () => onToggle!(i), child: row),
);
}
return Wrap(
alignment: WrapAlignment.center,
spacing: 16,
runSpacing: 4,
children: [for (var i = 0; i < items.length; i++) item(i)],
);
}
}
class _LegendButton extends StatefulWidget {
const _LegendButton({required this.onPressed, required this.child});
final VoidCallback onPressed;
final Widget child;
@override
State<_LegendButton> createState() => _LegendButtonState();
}
class _LegendButtonState extends State<_LegendButton> {
var _focused = false;
@override
Widget build(BuildContext context) {
final t = AshlarTheme.of(context);
return FocusableActionDetector(
mouseCursor: SystemMouseCursors.click,
onShowFocusHighlight: (v) => setState(() => _focused = v),
actions: {
ActivateIntent: CallbackAction<ActivateIntent>(
onInvoke: (_) => widget.onPressed(),
),
},
child: GestureDetector(
behavior: HitTestBehavior.opaque,
onTap: widget.onPressed,
child: Container(
padding: const EdgeInsets.symmetric(horizontal: 4, vertical: 2),
decoration: BoxDecoration(
borderRadius: BorderRadius.circular(t.radiusSm),
border: Border.all(
color: _focused
? t.colors.ring
: t.colors.ring.withValues(alpha: 0),
),
),
child: widget.child,
),
),
);
}
}