

Charts
Bars, lines, areas, pies, radars and radial bars, drawn by Ashlar UI itself with no charting package. Each works from the keyboard and reads out to a screen reader. Every variant below is a file to copy.
ashlar add chart
Area
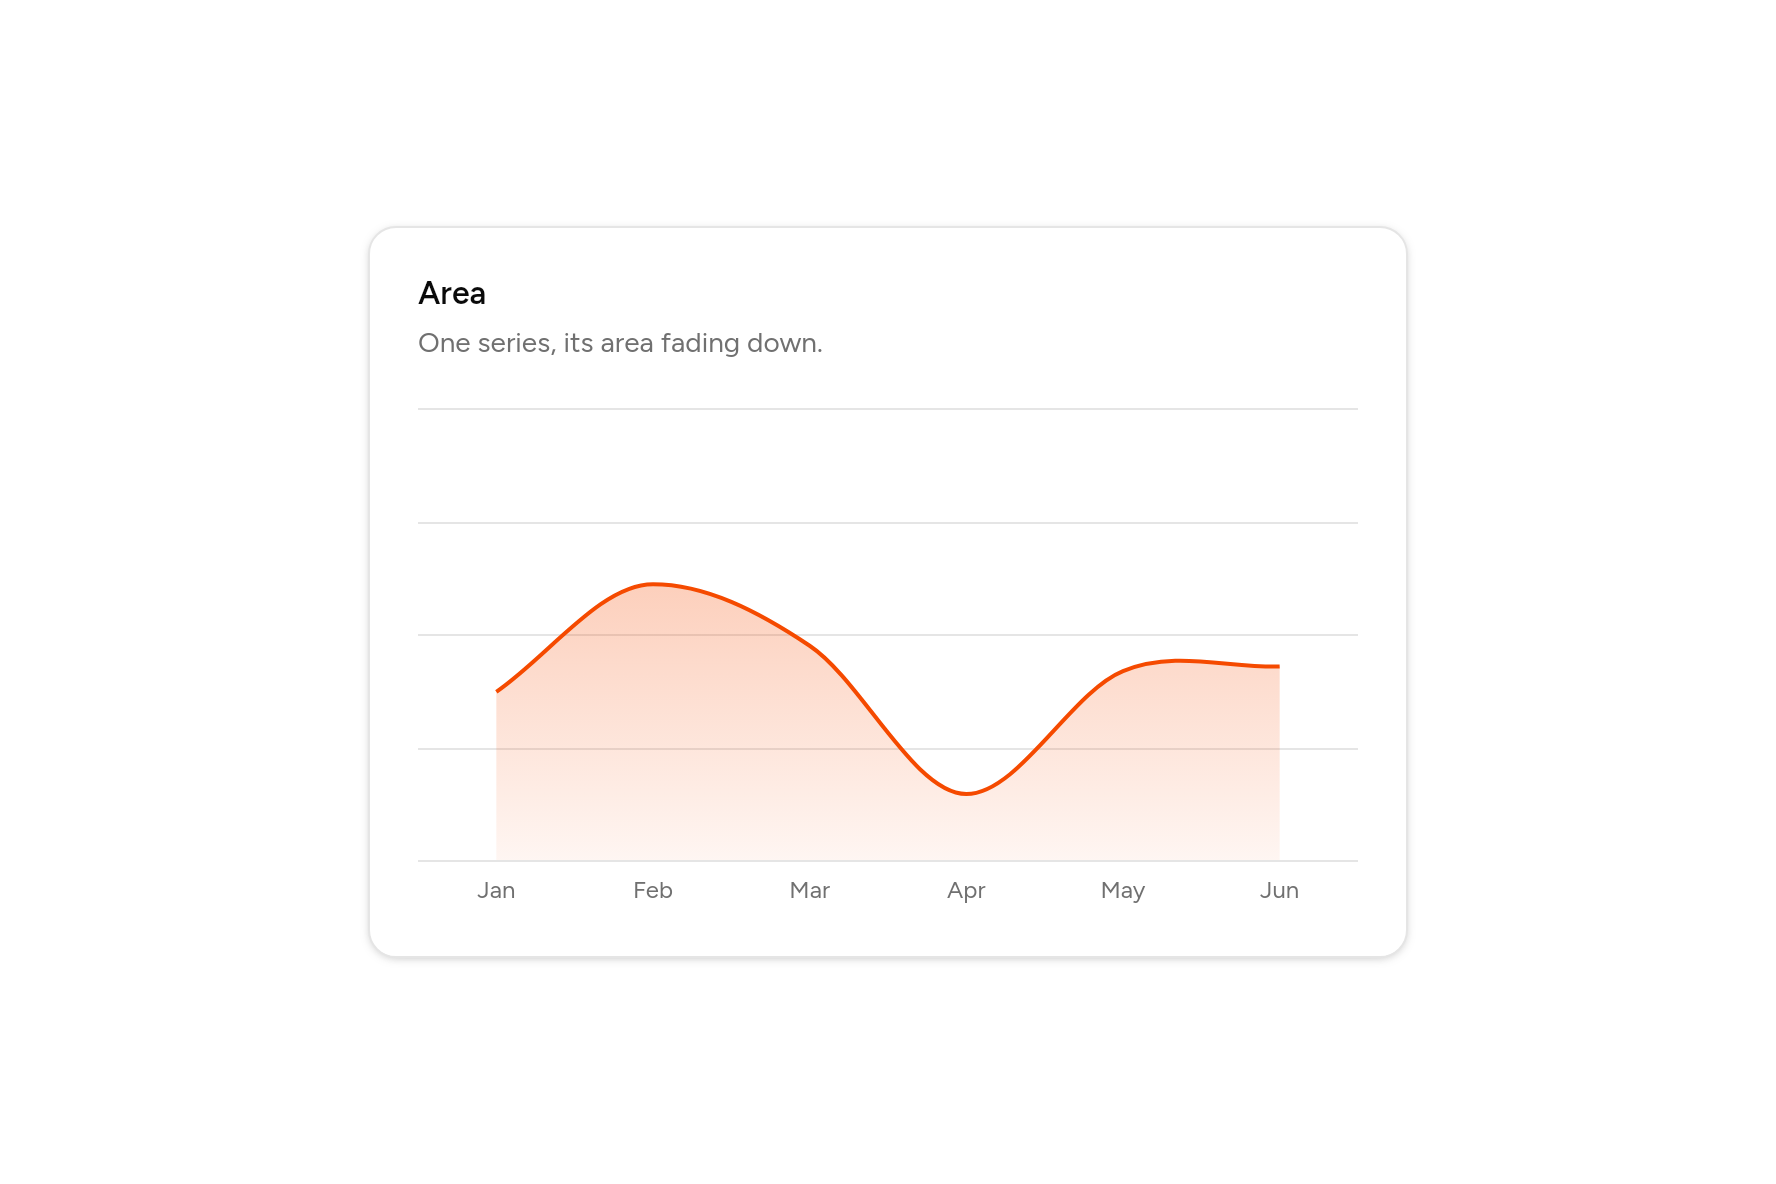
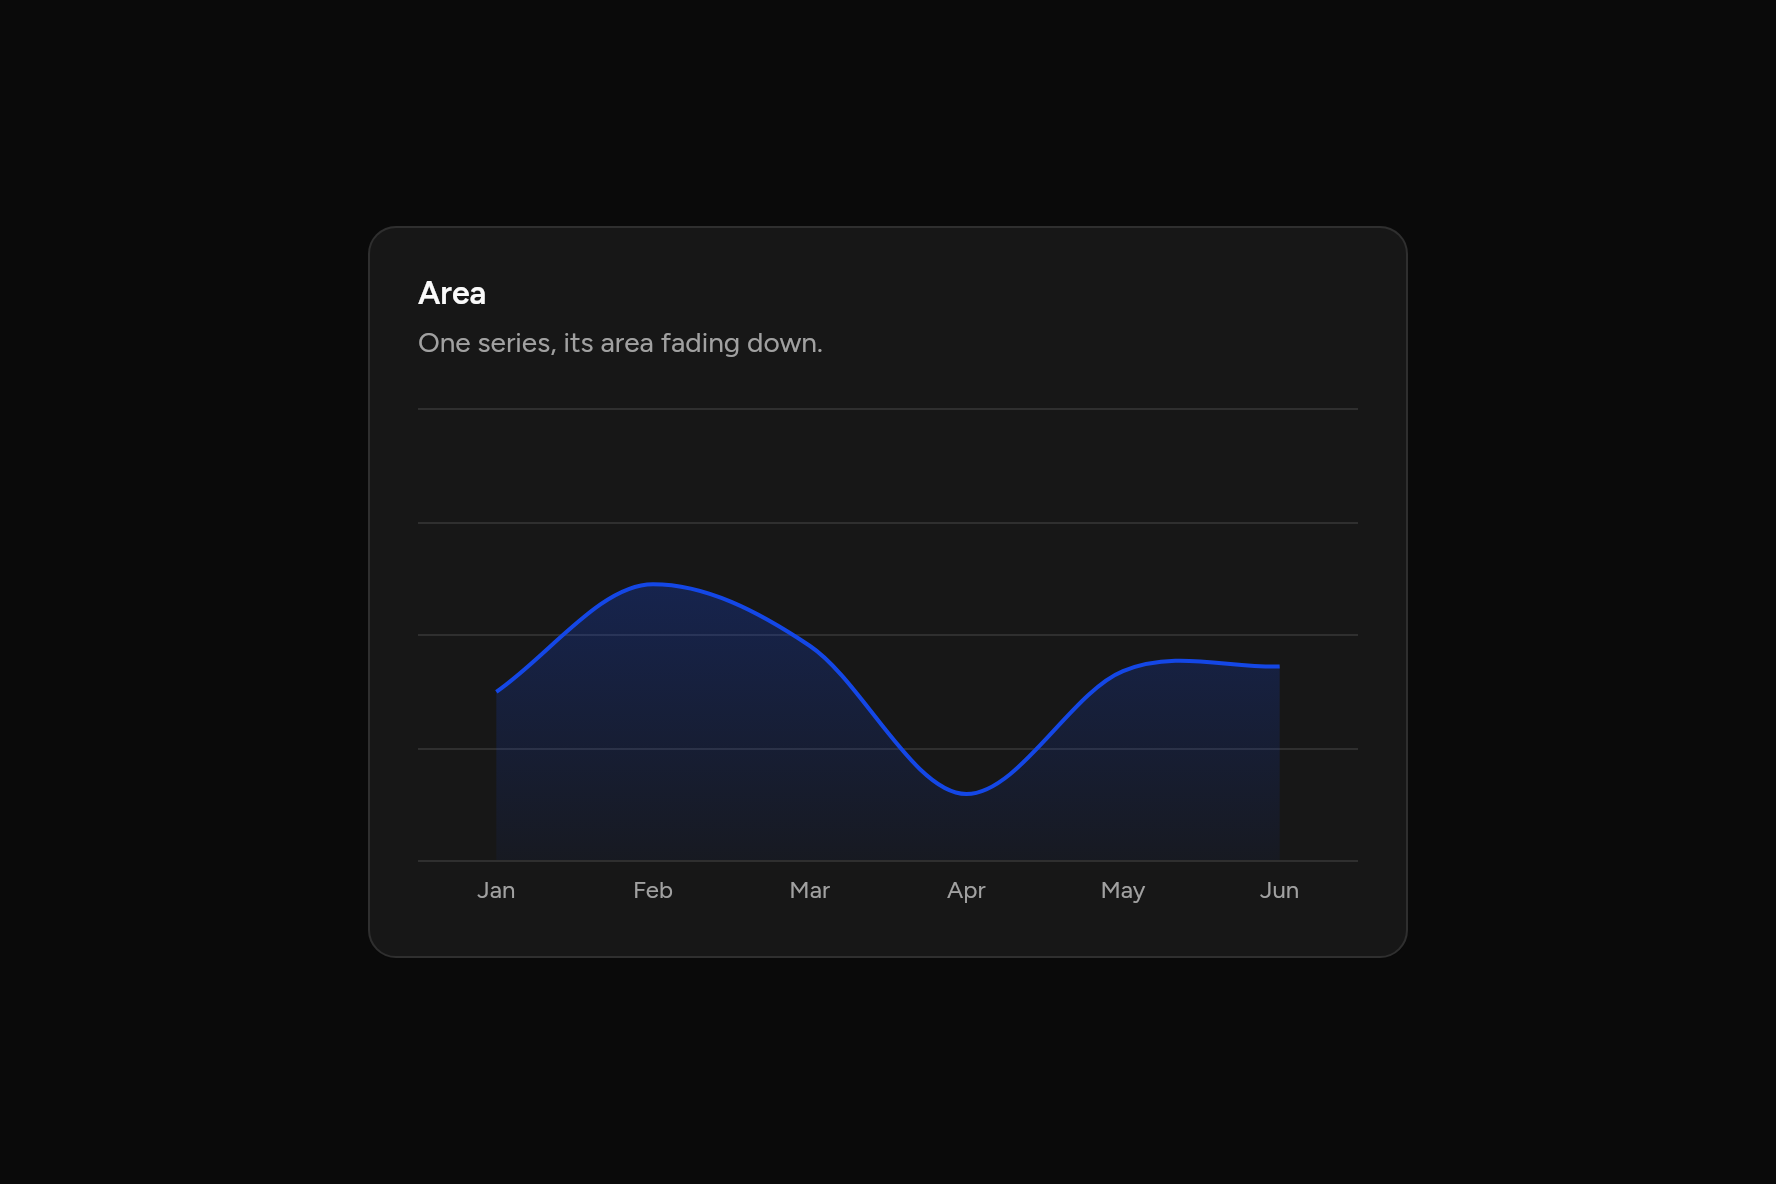
Area
One series, its area fading down.
Code
// Area: One series, its area fading down. Sample data.
import 'package:flutter/widgets.dart';

import 'ui/card.dart';
import 'ui/chart.dart';

class AreaDefaultChart extends StatelessWidget {
  const AreaDefaultChart({super.key});

  @override
  Widget build(BuildContext context) => SizedBox(
    width: 520,
    child: Card(
      children: [
        const CardHeader(
          title: Text("Area"),
          description: Text("One series, its area fading down."),
        ),
        CardContent(
          child: AreaChart(
            labels: ['Jan', 'Feb', 'Mar', 'Apr', 'May', 'Jun'],
            series: const [
              ChartSeries('Desktop', [186, 305, 237, 73, 209, 214]),
            ],
          ),
        ),
      ],
    ),
  );
}
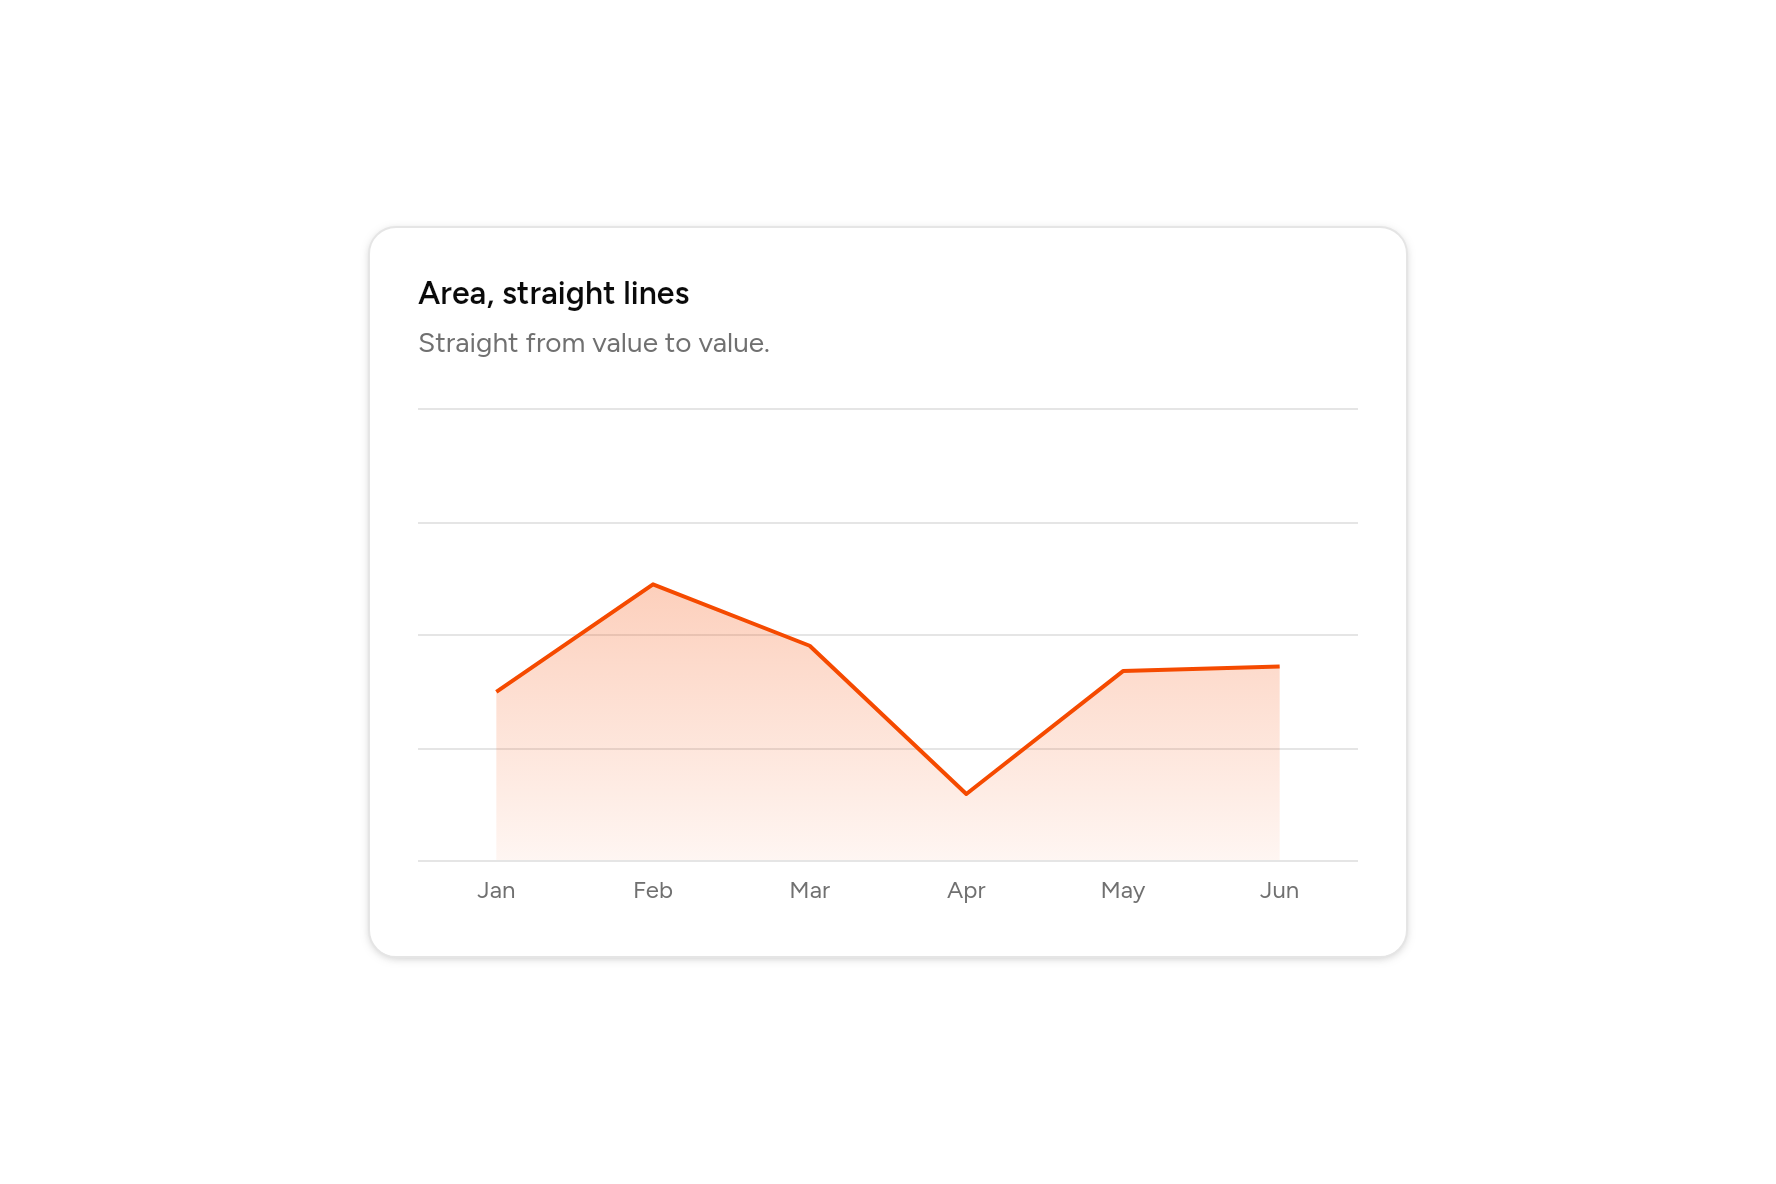
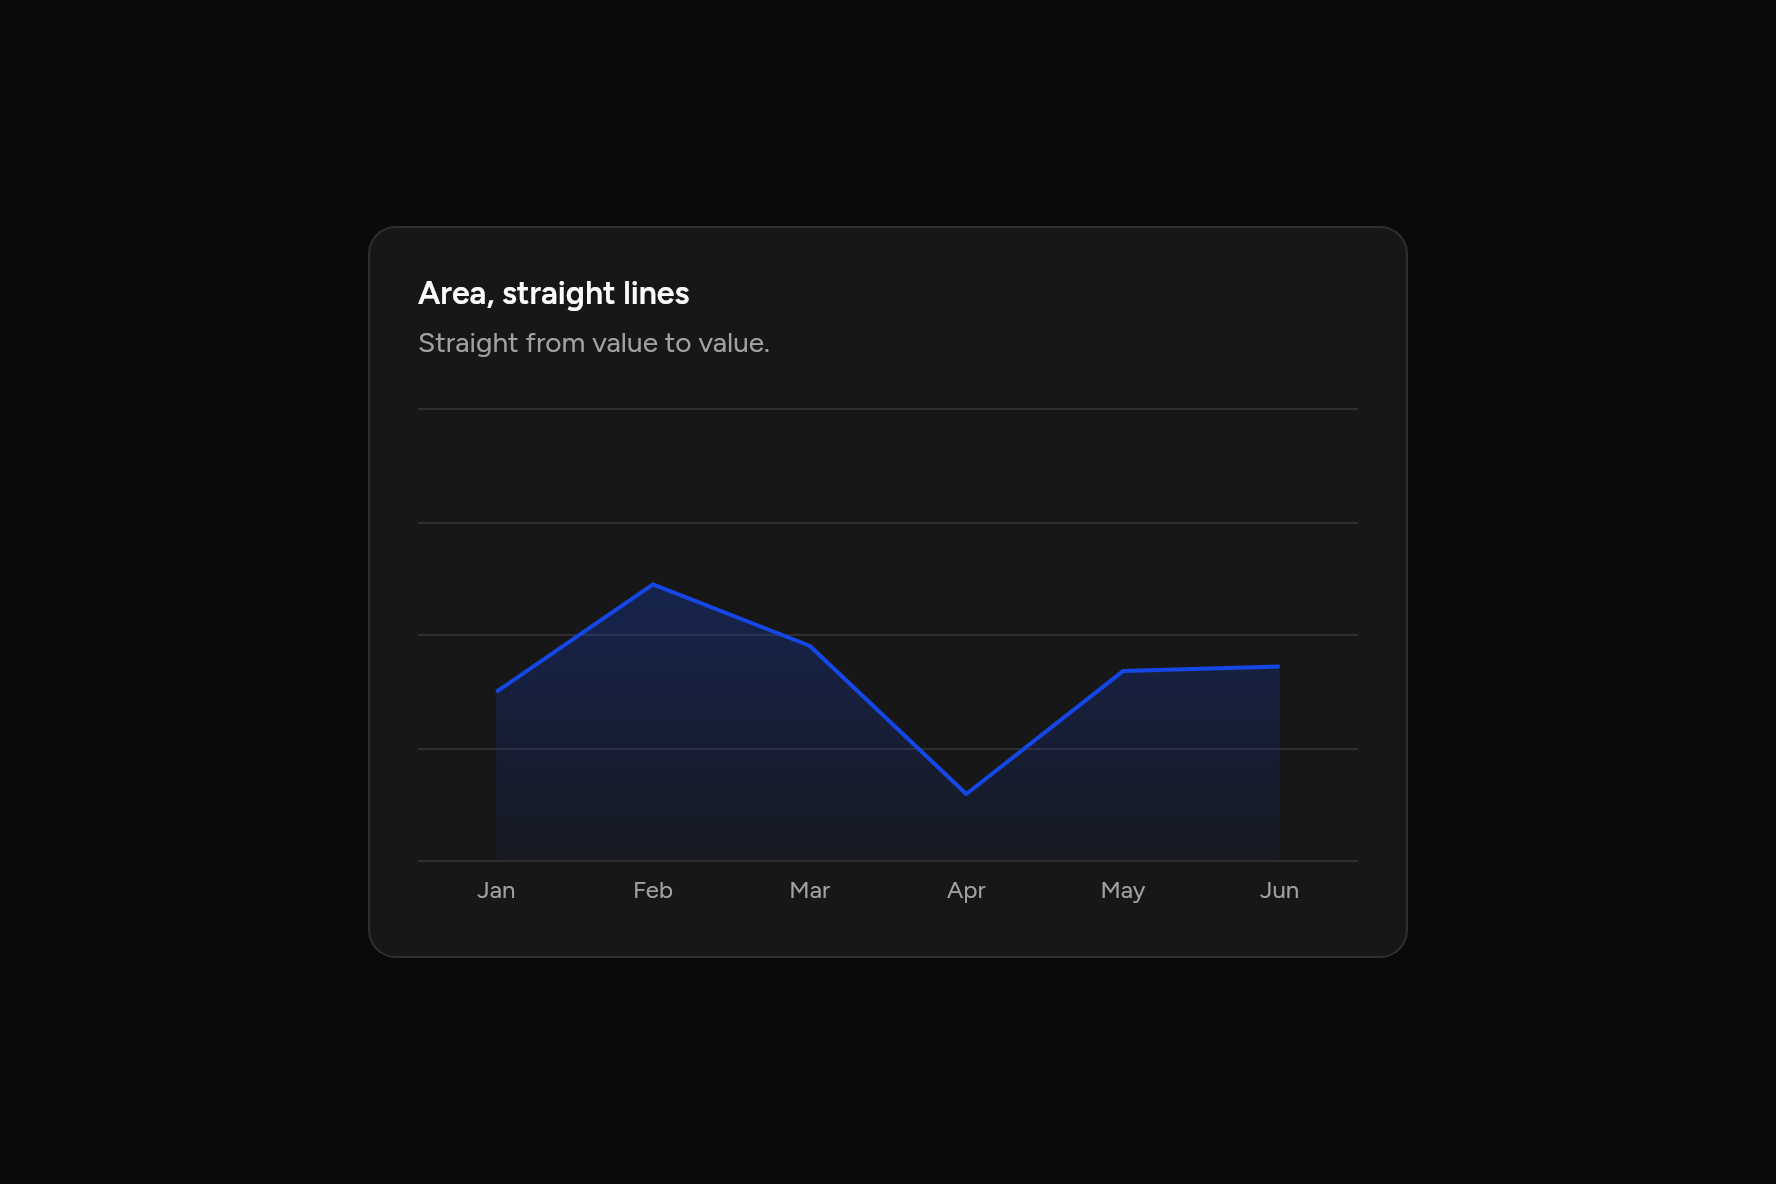
Area, straight lines
Straight from value to value.
Code
// Area, straight lines: Straight from value to value. Sample data.
import 'package:flutter/widgets.dart';

import 'ui/card.dart';
import 'ui/chart.dart';

class AreaLinearChart extends StatelessWidget {
  const AreaLinearChart({super.key});

  @override
  Widget build(BuildContext context) => SizedBox(
    width: 520,
    child: Card(
      children: [
        const CardHeader(
          title: Text("Area, straight lines"),
          description: Text("Straight from value to value."),
        ),
        CardContent(
          child: AreaChart(
            labels: ['Jan', 'Feb', 'Mar', 'Apr', 'May', 'Jun'],
            series: const [
              ChartSeries('Desktop', [186, 305, 237, 73, 209, 214]),
            ],
            curve: ChartCurve.linear,
          ),
        ),
      ],
    ),
  );
}
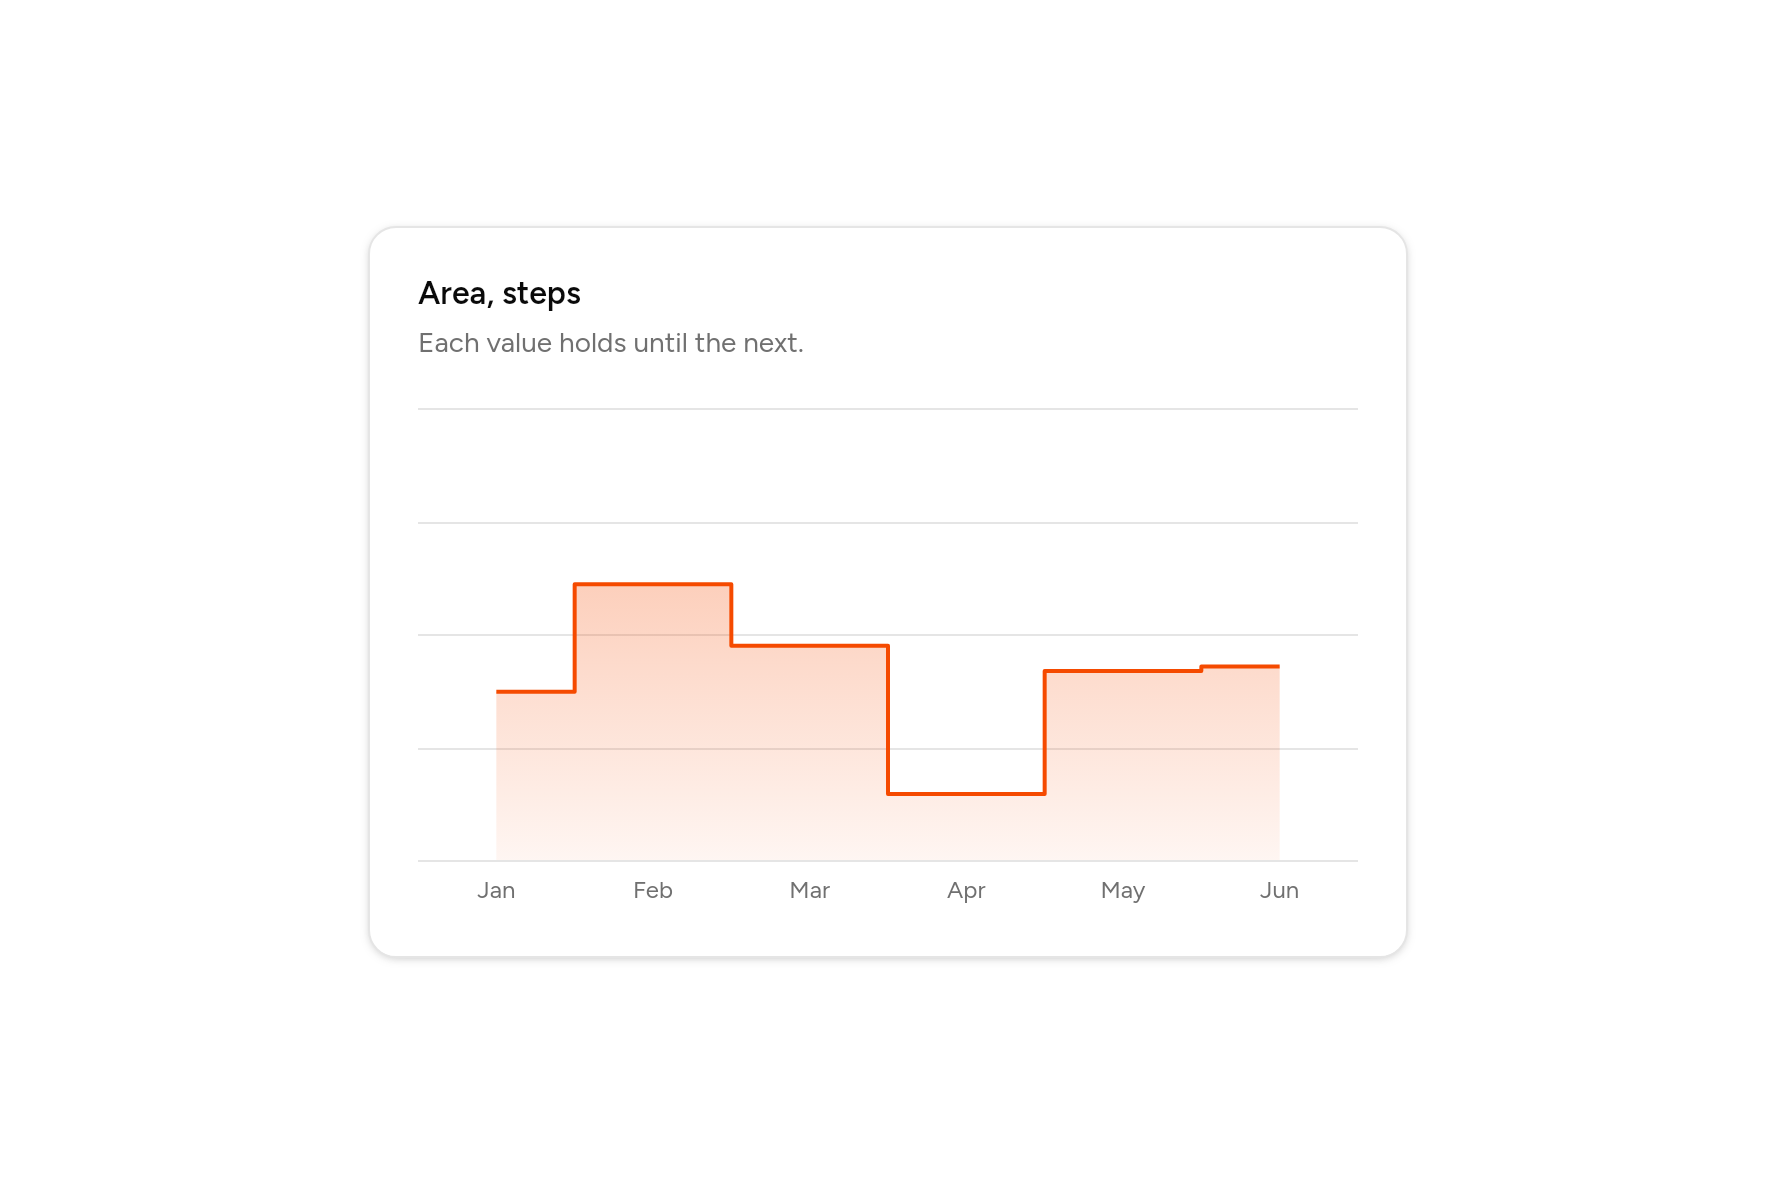
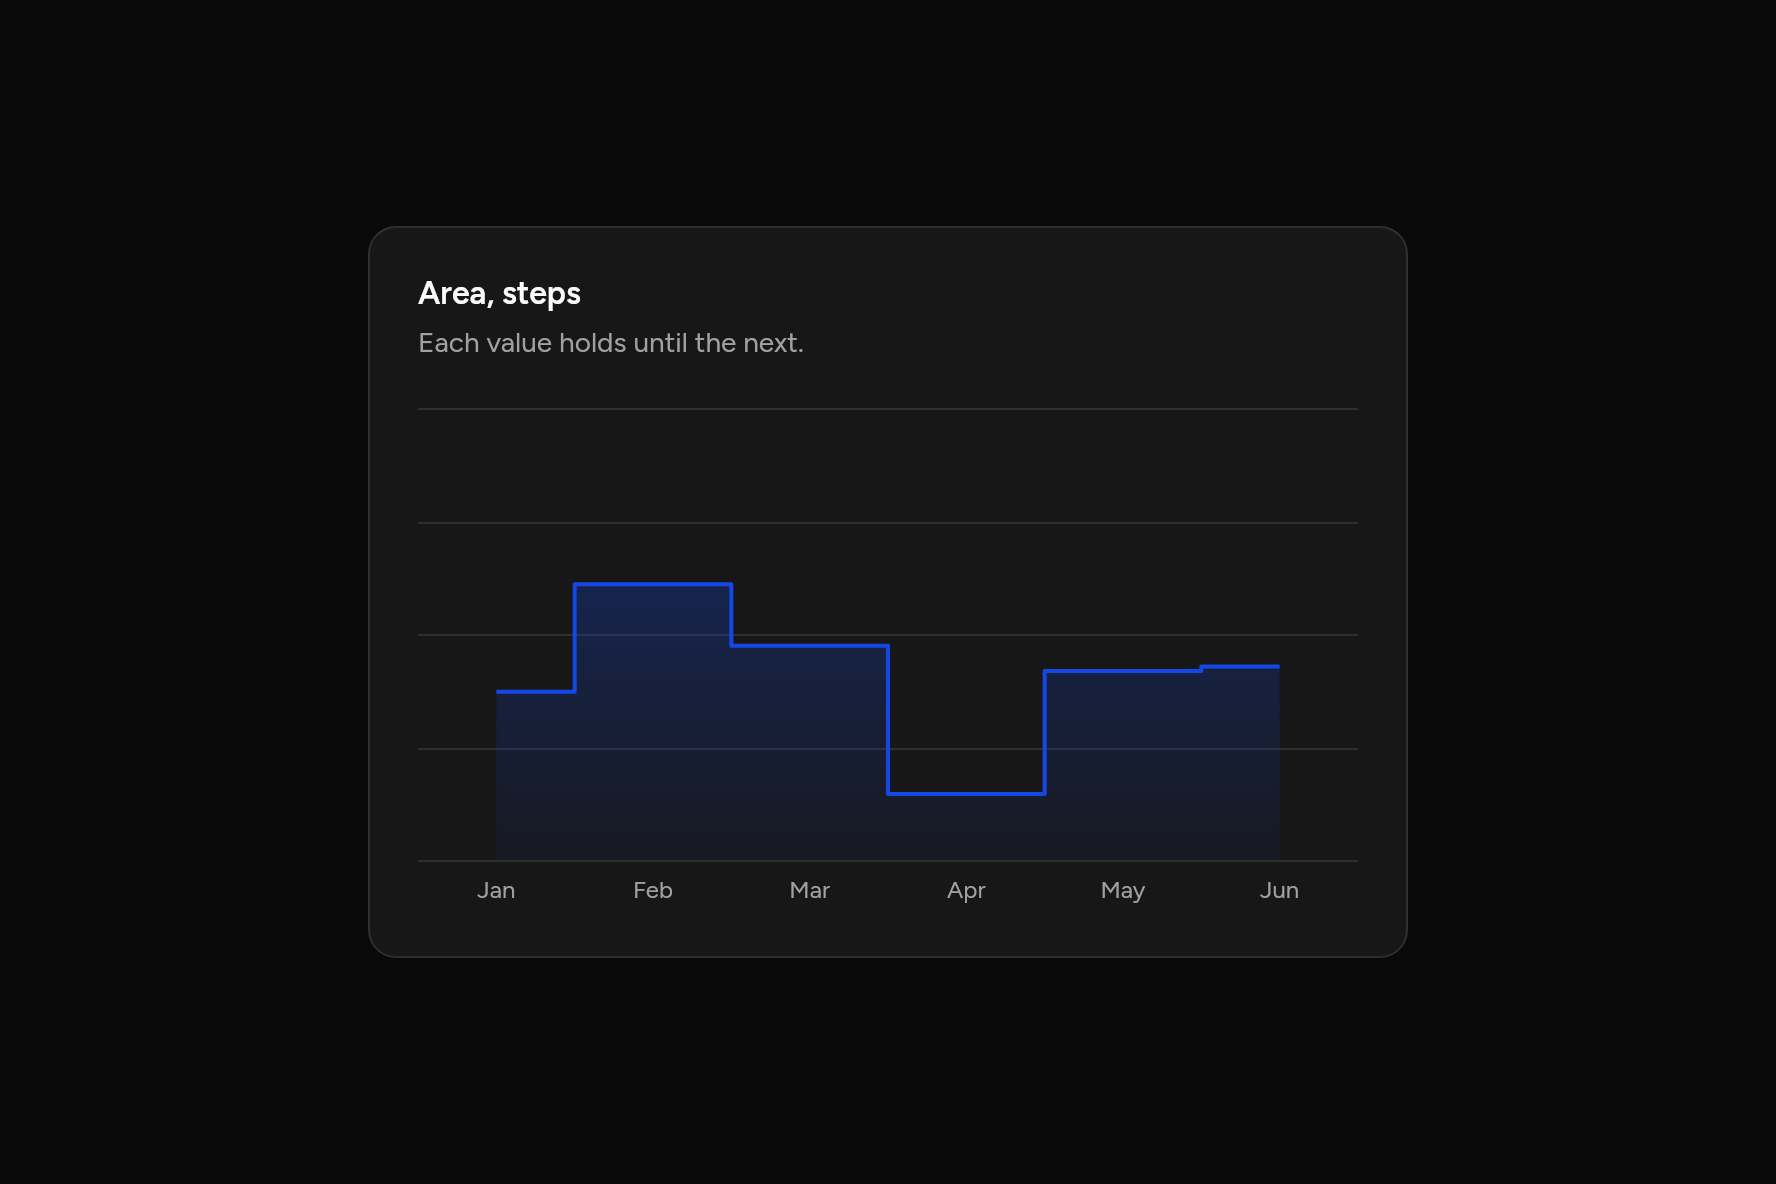
Area, steps
Each value holds until the next.
Code
// Area, steps: Each value holds until the next. Sample data.
import 'package:flutter/widgets.dart';

import 'ui/card.dart';
import 'ui/chart.dart';

class AreaStepChart extends StatelessWidget {
  const AreaStepChart({super.key});

  @override
  Widget build(BuildContext context) => SizedBox(
    width: 520,
    child: Card(
      children: [
        const CardHeader(
          title: Text("Area, steps"),
          description: Text("Each value holds until the next."),
        ),
        CardContent(
          child: AreaChart(
            labels: ['Jan', 'Feb', 'Mar', 'Apr', 'May', 'Jun'],
            series: const [
              ChartSeries('Desktop', [186, 305, 237, 73, 209, 214]),
            ],
            curve: ChartCurve.step,
          ),
        ),
      ],
    ),
  );
}
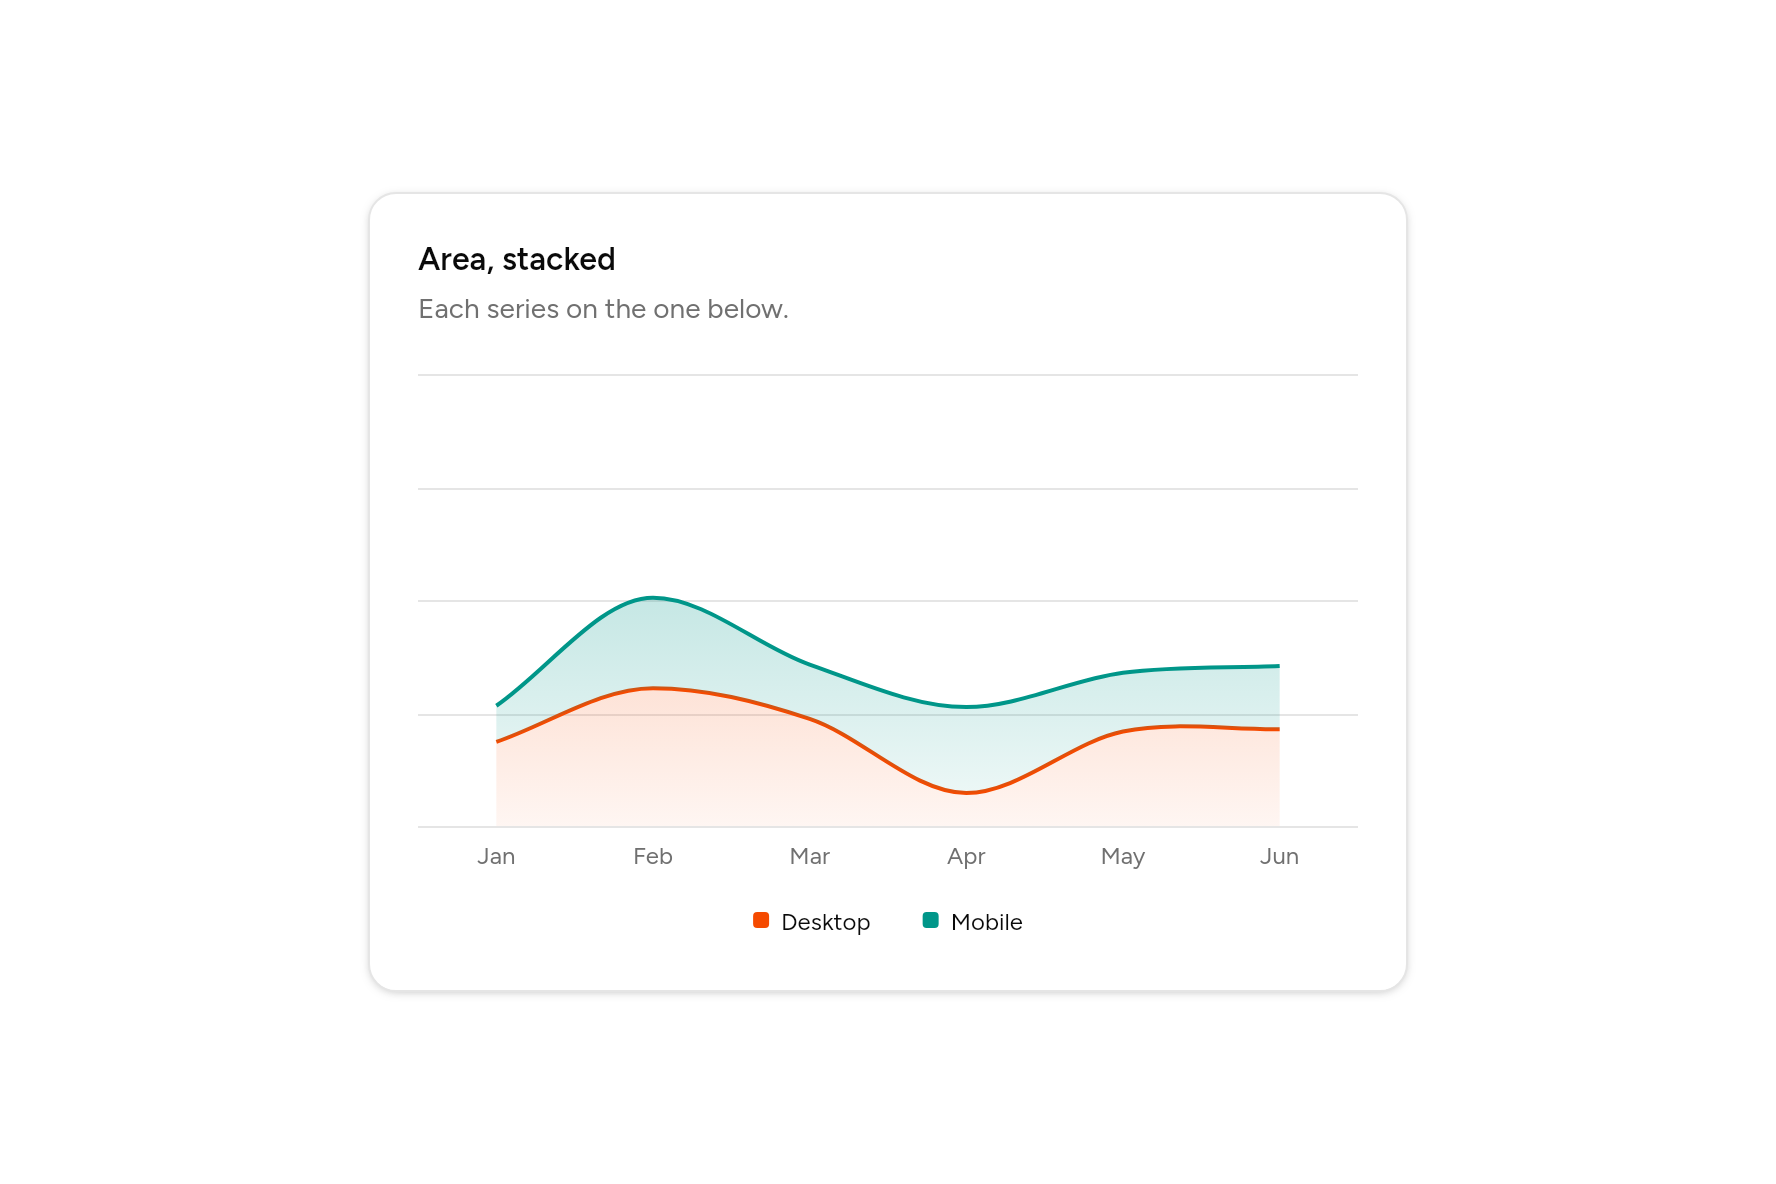
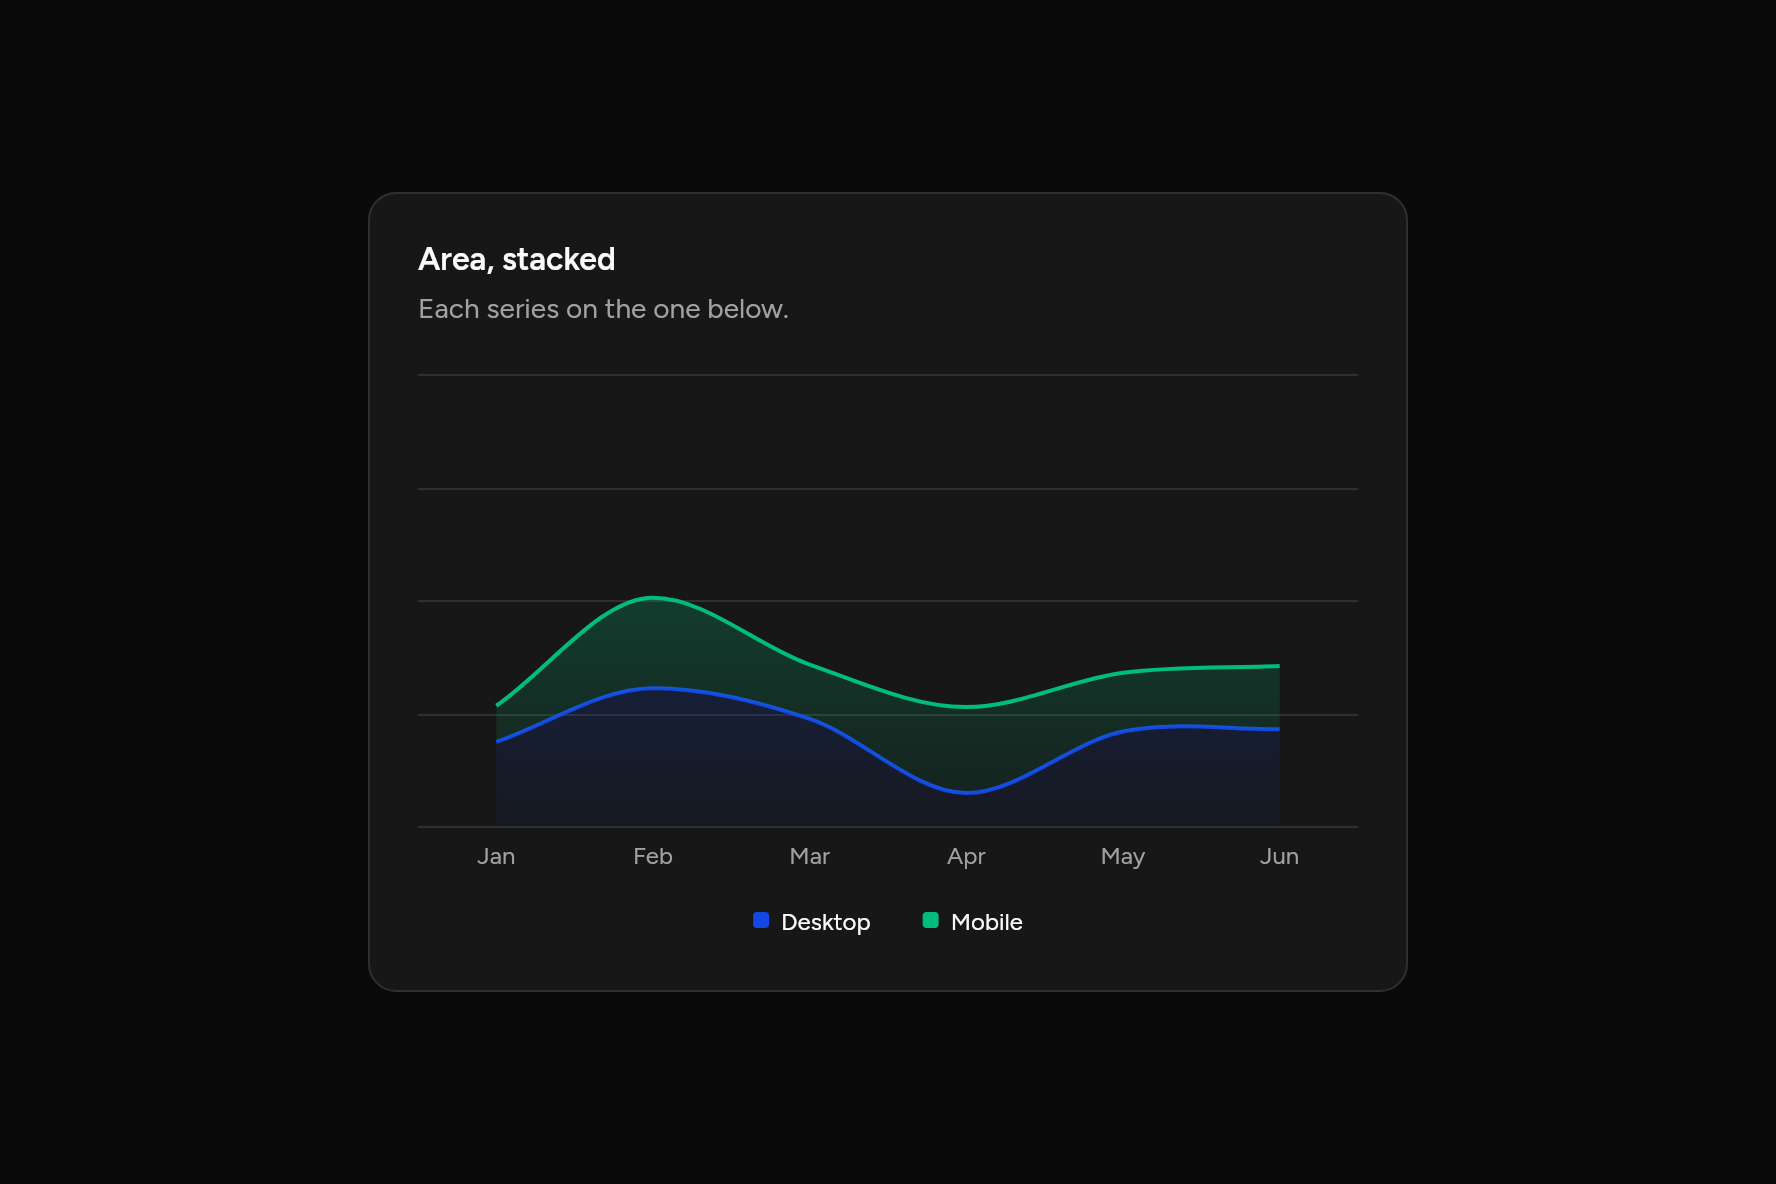
Area, stacked
Each series on the one below.
Code
// Area, stacked: Each series on the one below. Sample data.
import 'package:flutter/widgets.dart';

import 'ui/card.dart';
import 'ui/chart.dart';

class AreaStackedChart extends StatelessWidget {
  const AreaStackedChart({super.key});

  @override
  Widget build(BuildContext context) => SizedBox(
    width: 520,
    child: Card(
      children: [
        const CardHeader(
          title: Text("Area, stacked"),
          description: Text("Each series on the one below."),
        ),
        CardContent(
          child: AreaChart(
            labels: ['Jan', 'Feb', 'Mar', 'Apr', 'May', 'Jun'],
            series: const [
              ChartSeries('Desktop', [186, 305, 237, 73, 209, 214]),
              ChartSeries('Mobile', [80, 200, 120, 190, 130, 140]),
            ],
            stacked: true,
          ),
        ),
      ],
    ),
  );
}
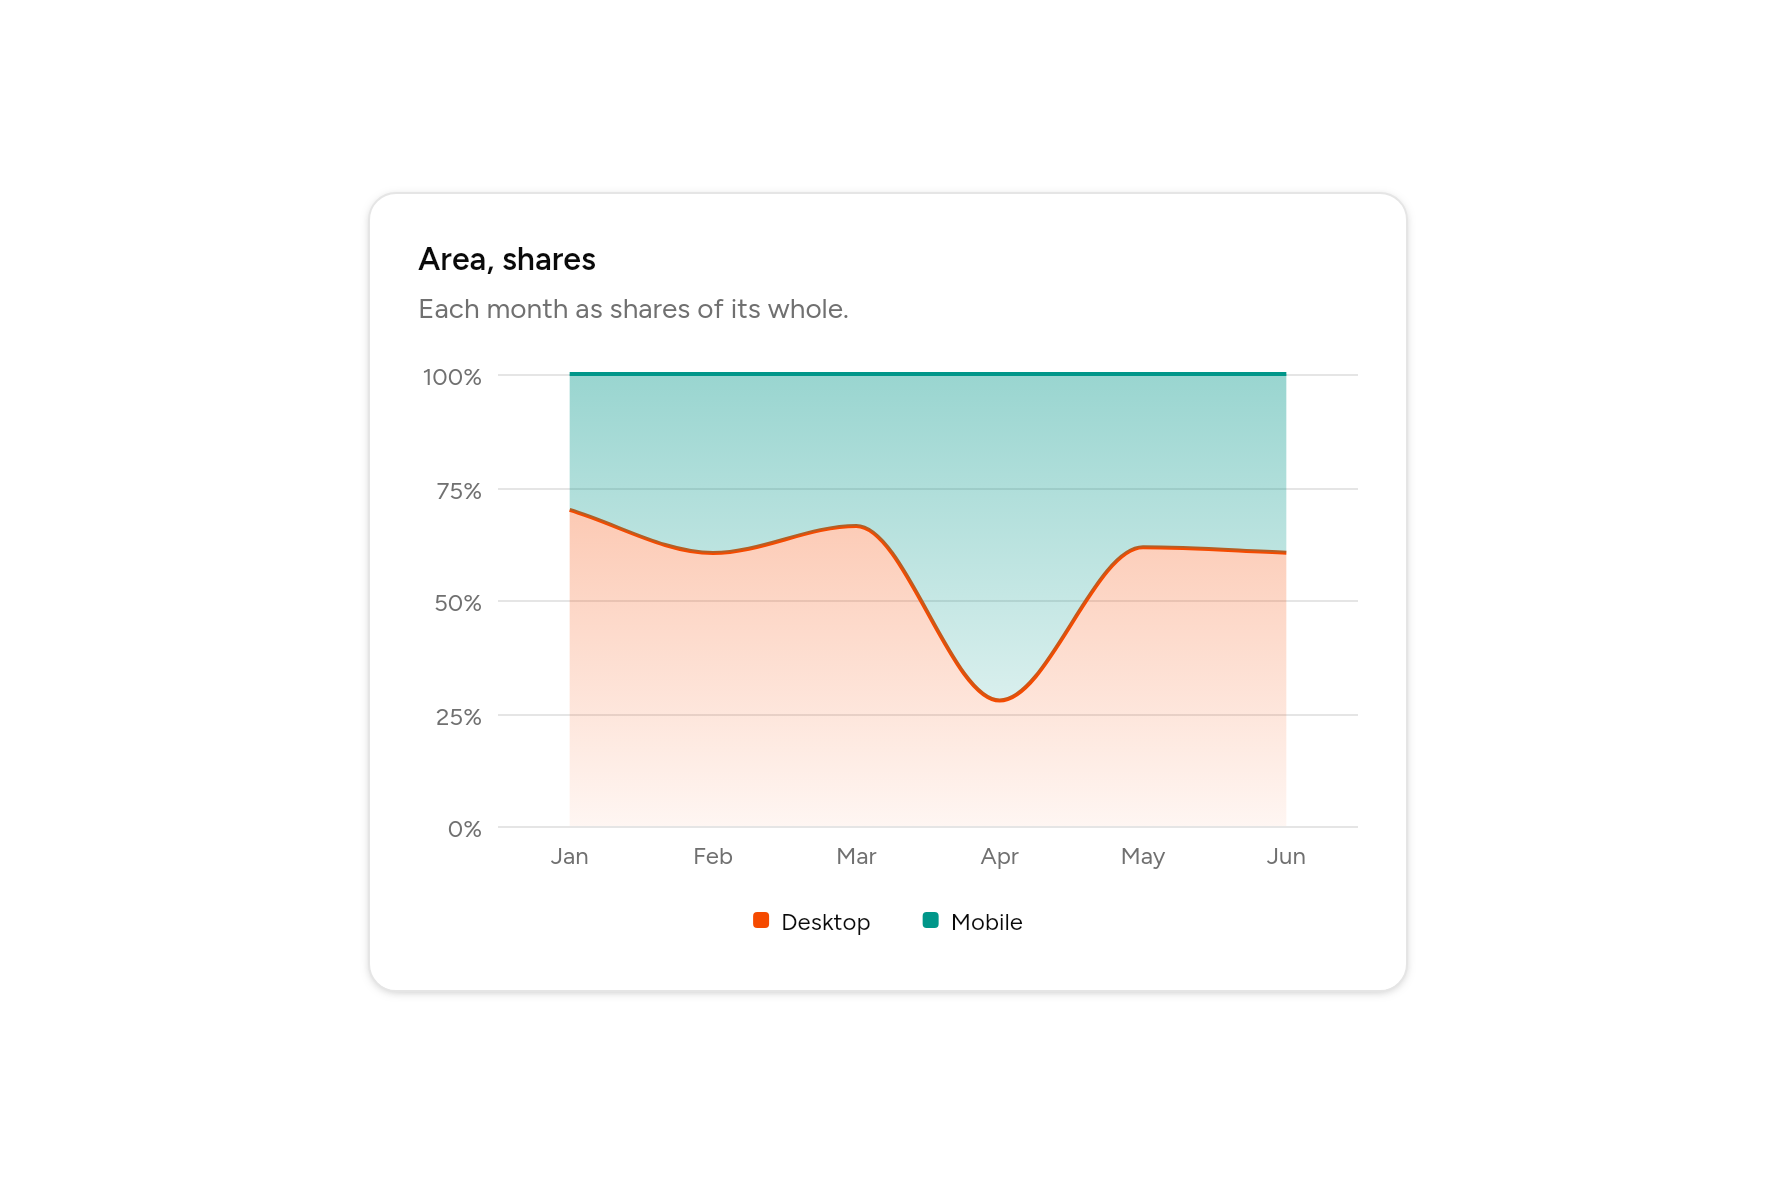
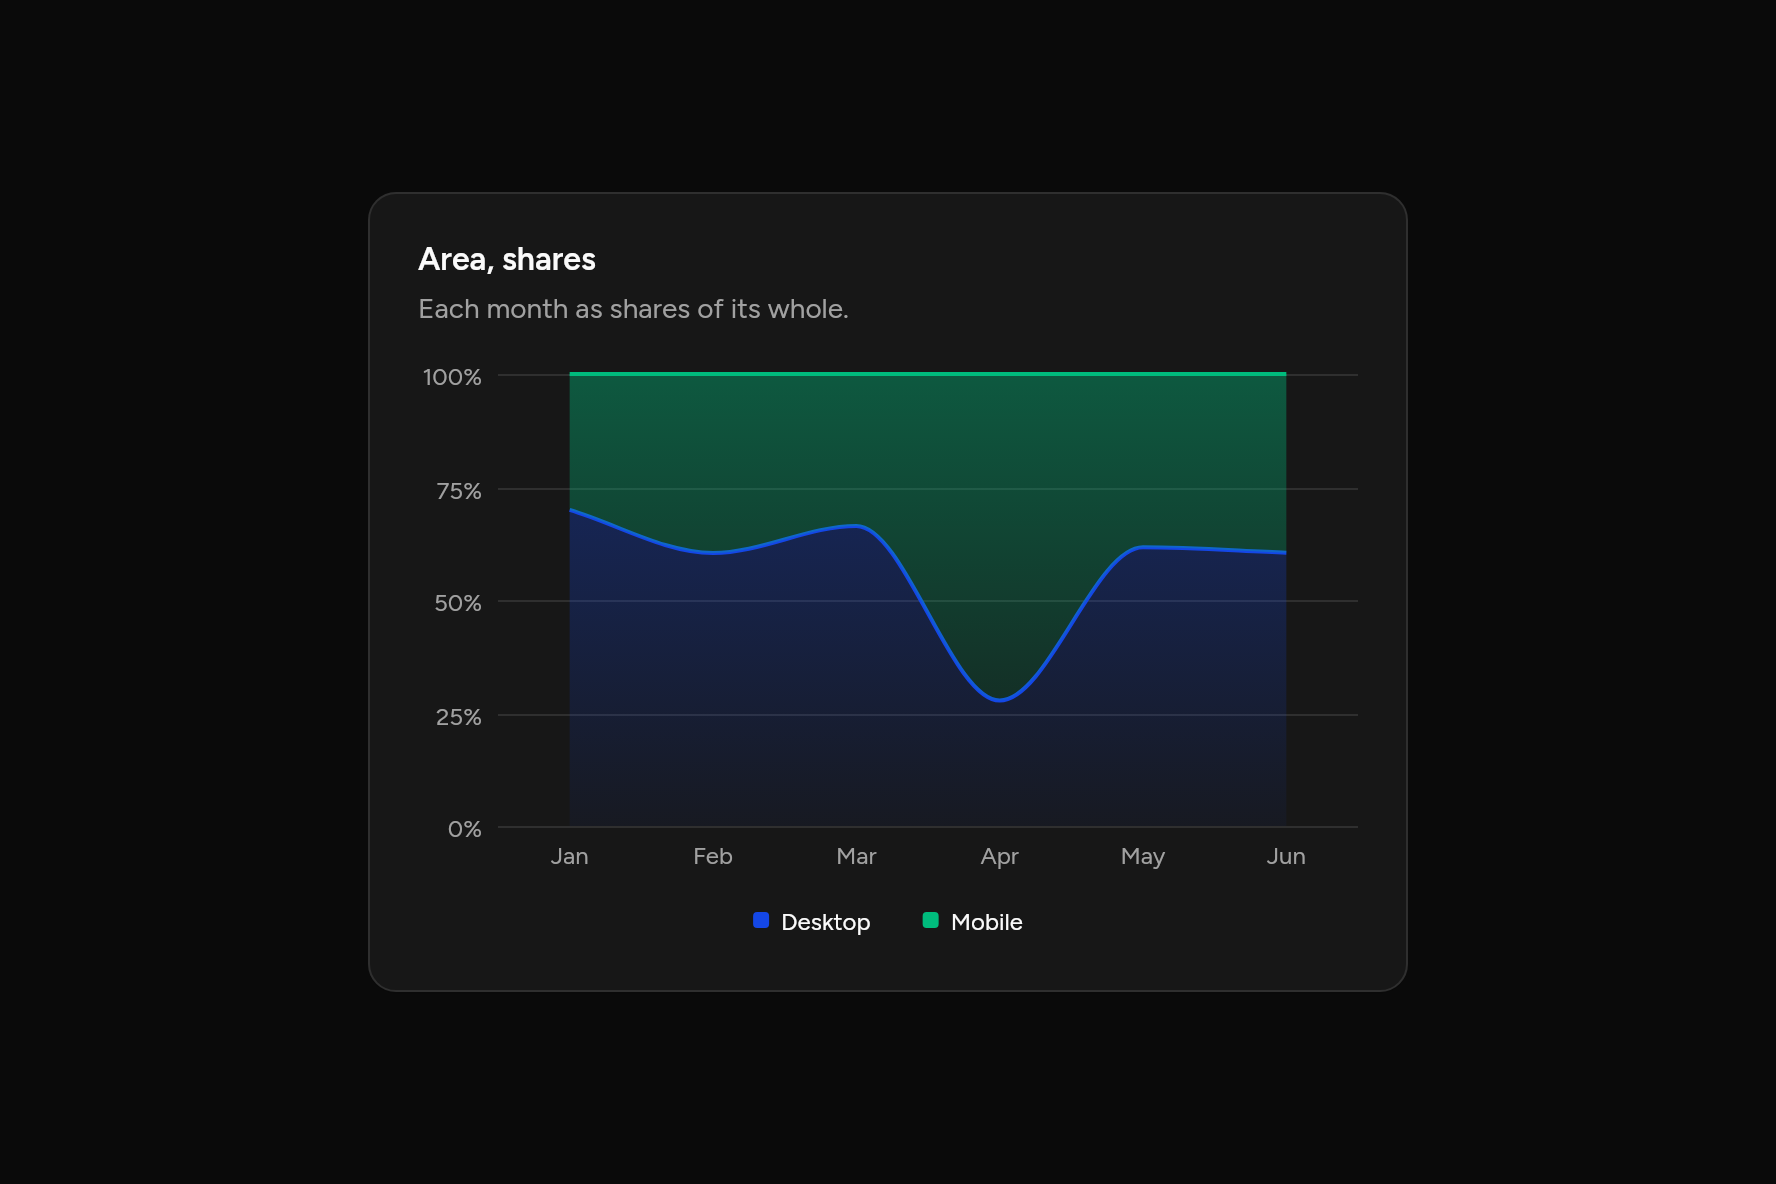
Area, shares
Each month as shares of its whole.
Code
// Area, shares: Each month as shares of its whole. Sample data.
import 'package:flutter/widgets.dart';

import 'ui/card.dart';
import 'ui/chart.dart';

class AreaExpandedChart extends StatelessWidget {
  const AreaExpandedChart({super.key});

  @override
  Widget build(BuildContext context) => SizedBox(
    width: 520,
    child: Card(
      children: [
        const CardHeader(
          title: Text("Area, shares"),
          description: Text("Each month as shares of its whole."),
        ),
        CardContent(
          child: AreaChart(
            labels: ['Jan', 'Feb', 'Mar', 'Apr', 'May', 'Jun'],
            series: const [
              ChartSeries('Desktop', [186, 305, 237, 73, 209, 214]),
              ChartSeries('Mobile', [80, 200, 120, 190, 130, 140]),
            ],
            expand: true,
            axis: true,
          ),
        ),
      ],
    ),
  );
}
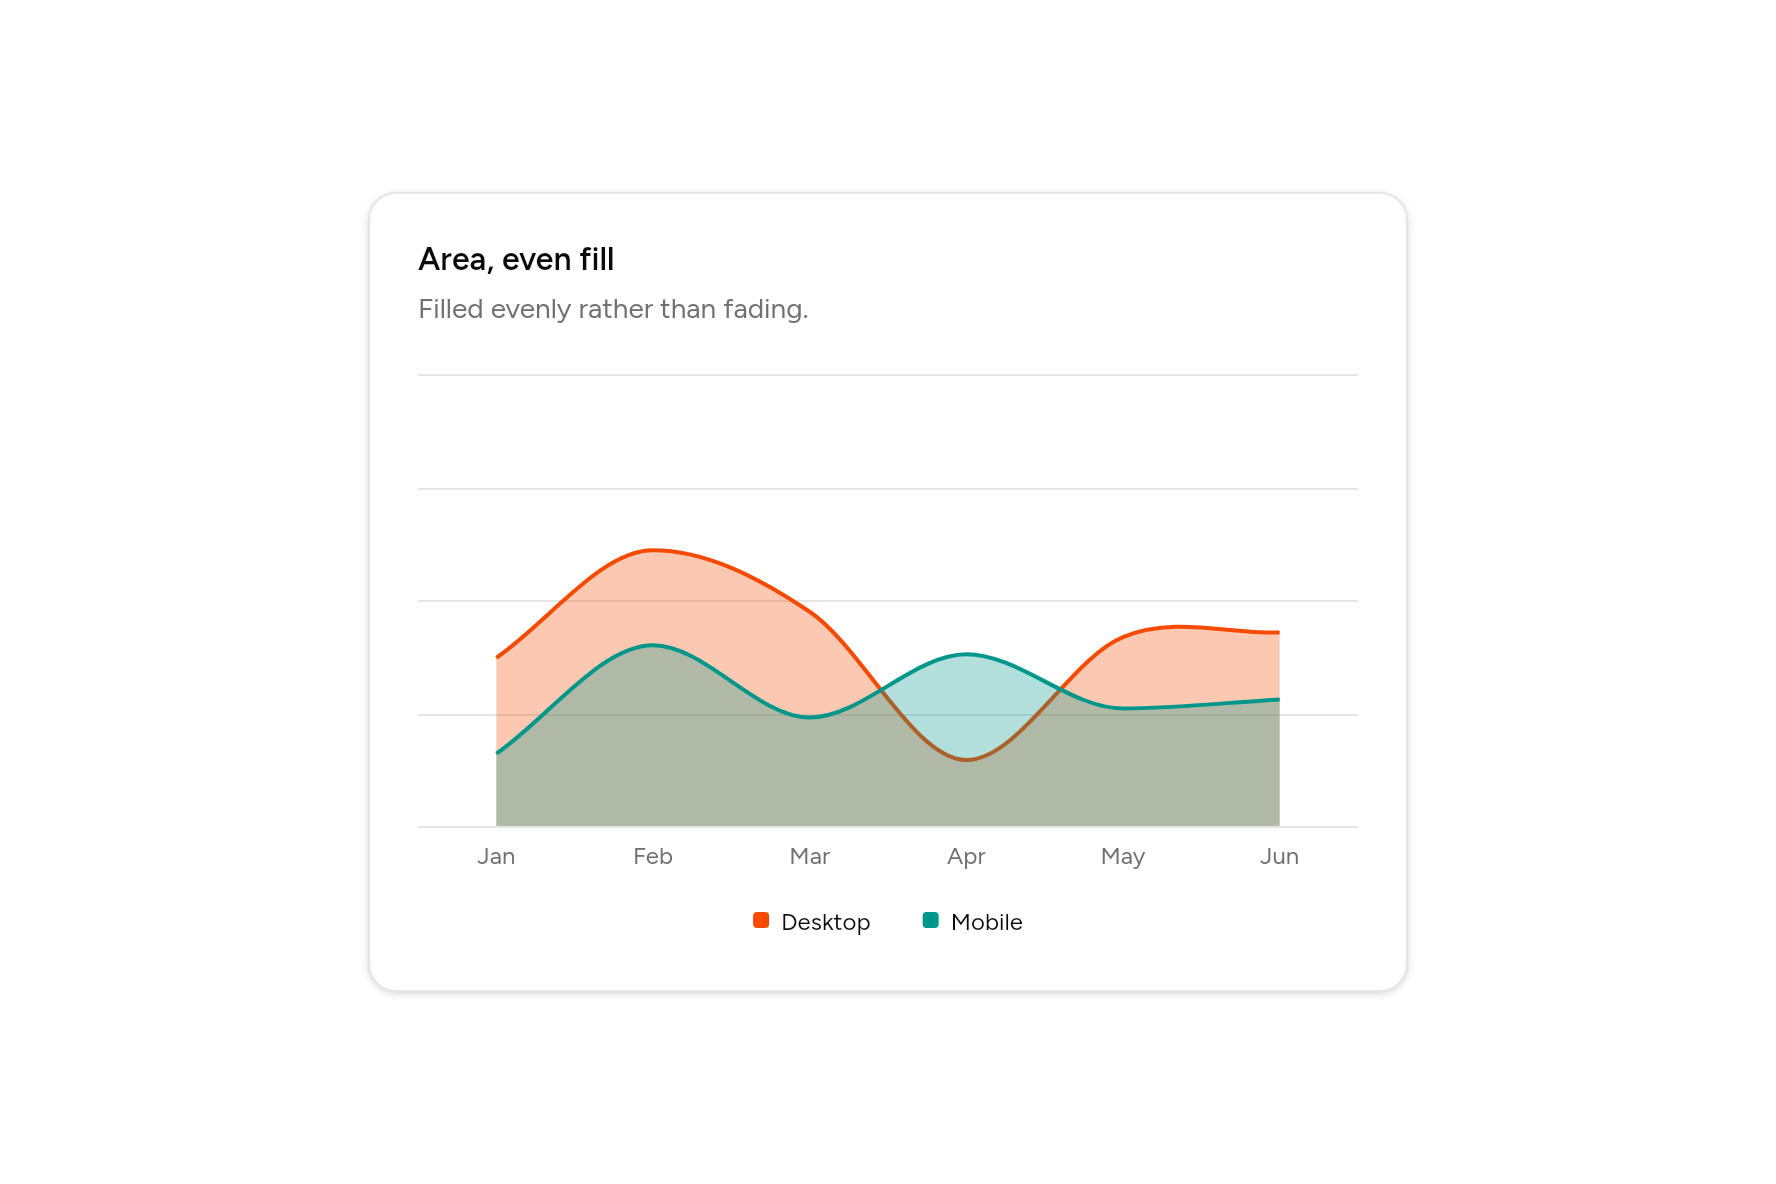
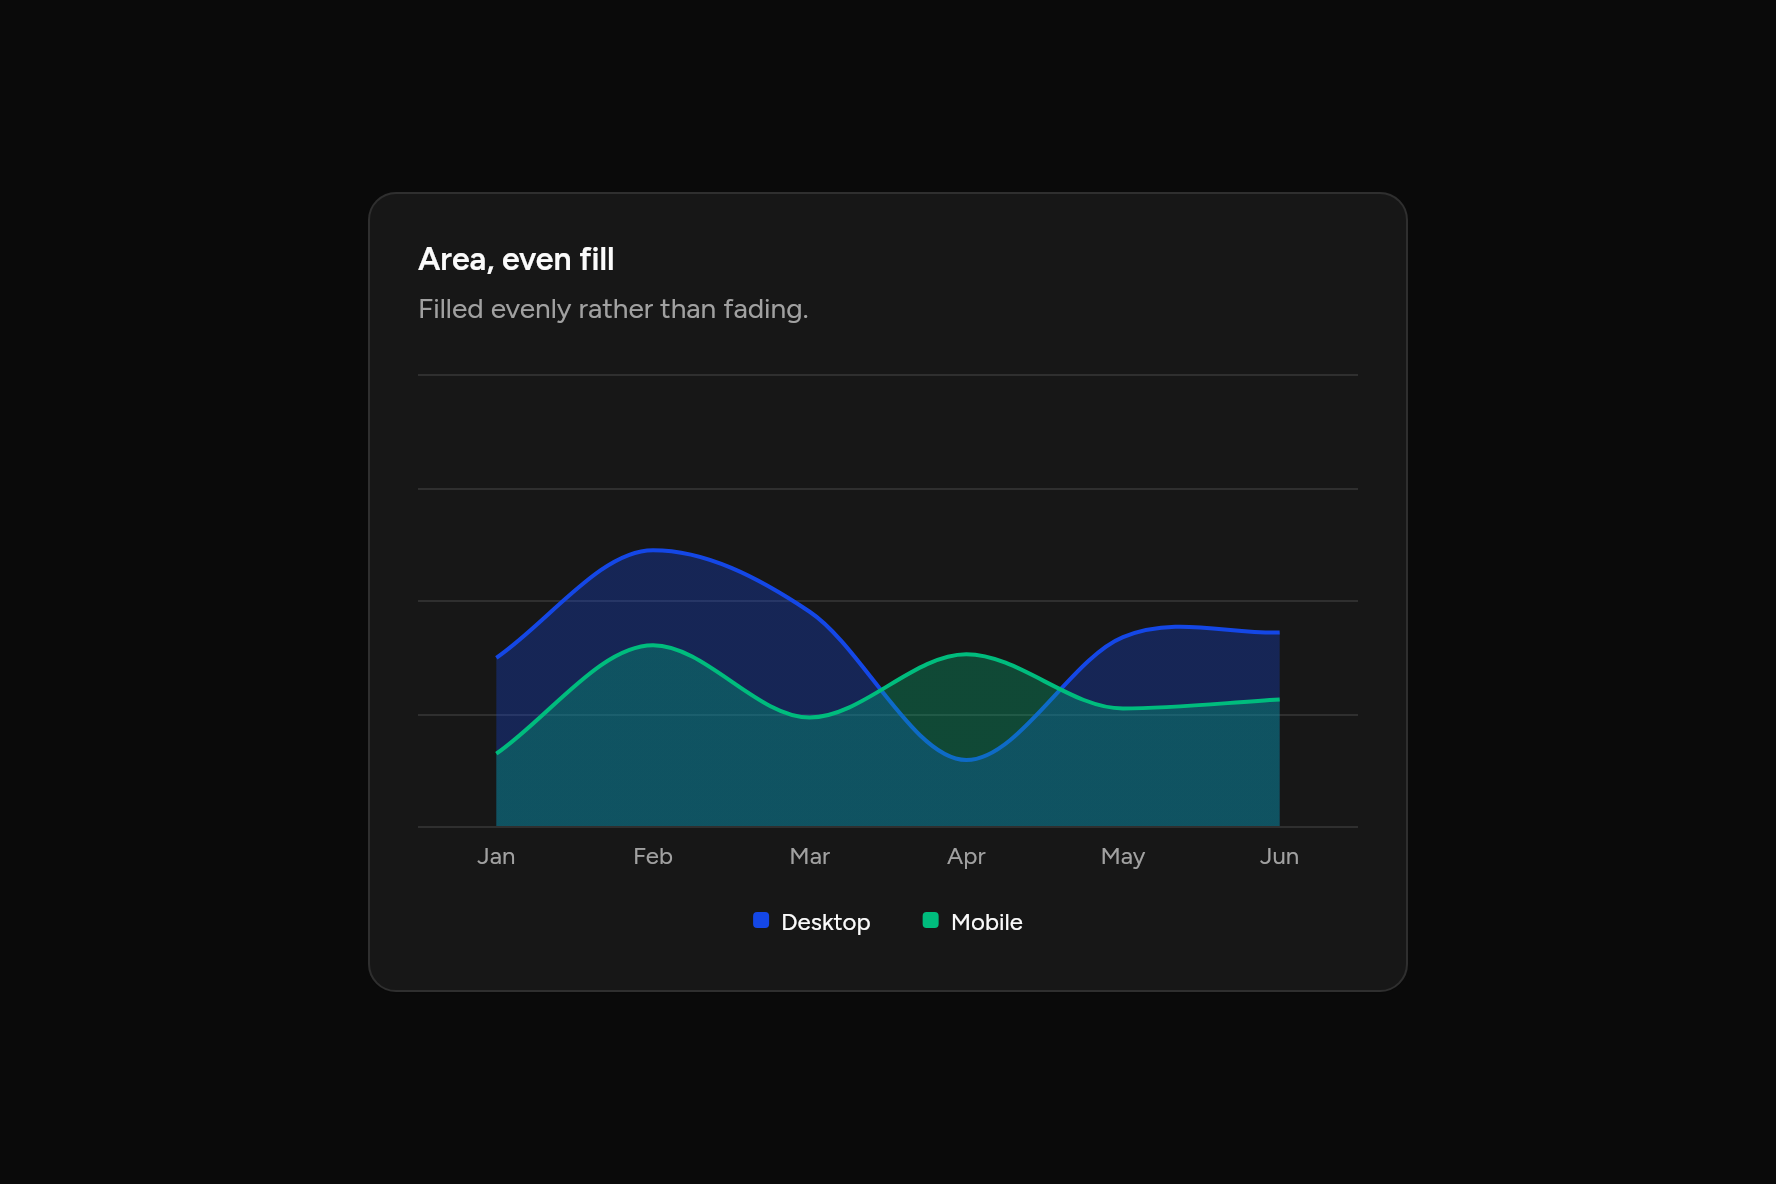
Area, even fill
Filled evenly rather than fading.
Code
// Area, even fill: Filled evenly rather than fading. Sample data.
import 'package:flutter/widgets.dart';

import 'ui/card.dart';
import 'ui/chart.dart';

class AreaFlatChart extends StatelessWidget {
  const AreaFlatChart({super.key});

  @override
  Widget build(BuildContext context) => SizedBox(
    width: 520,
    child: Card(
      children: [
        const CardHeader(
          title: Text("Area, even fill"),
          description: Text("Filled evenly rather than fading."),
        ),
        CardContent(
          child: AreaChart(
            labels: ['Jan', 'Feb', 'Mar', 'Apr', 'May', 'Jun'],
            series: const [
              ChartSeries('Desktop', [186, 305, 237, 73, 209, 214]),
              ChartSeries('Mobile', [80, 200, 120, 190, 130, 140]),
            ],
            gradient: false,
          ),
        ),
      ],
    ),
  );
}
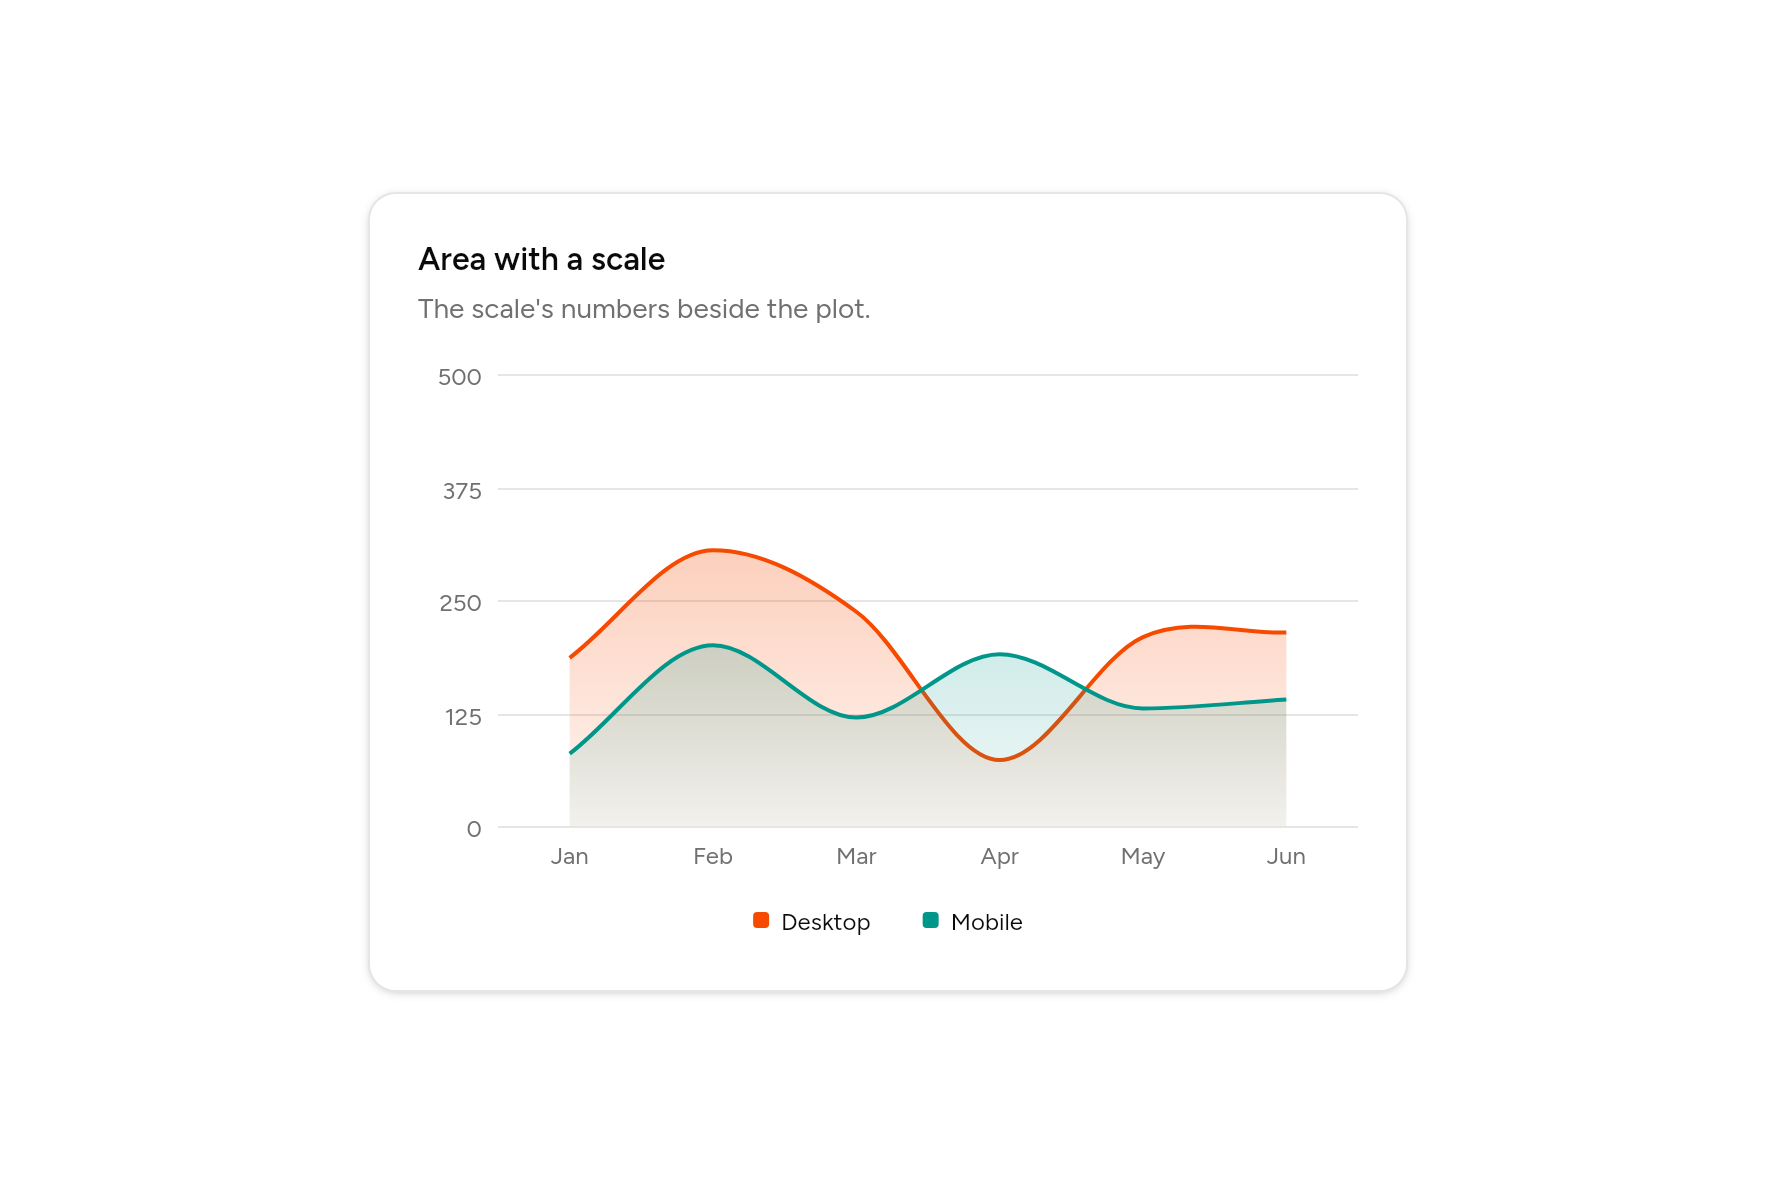
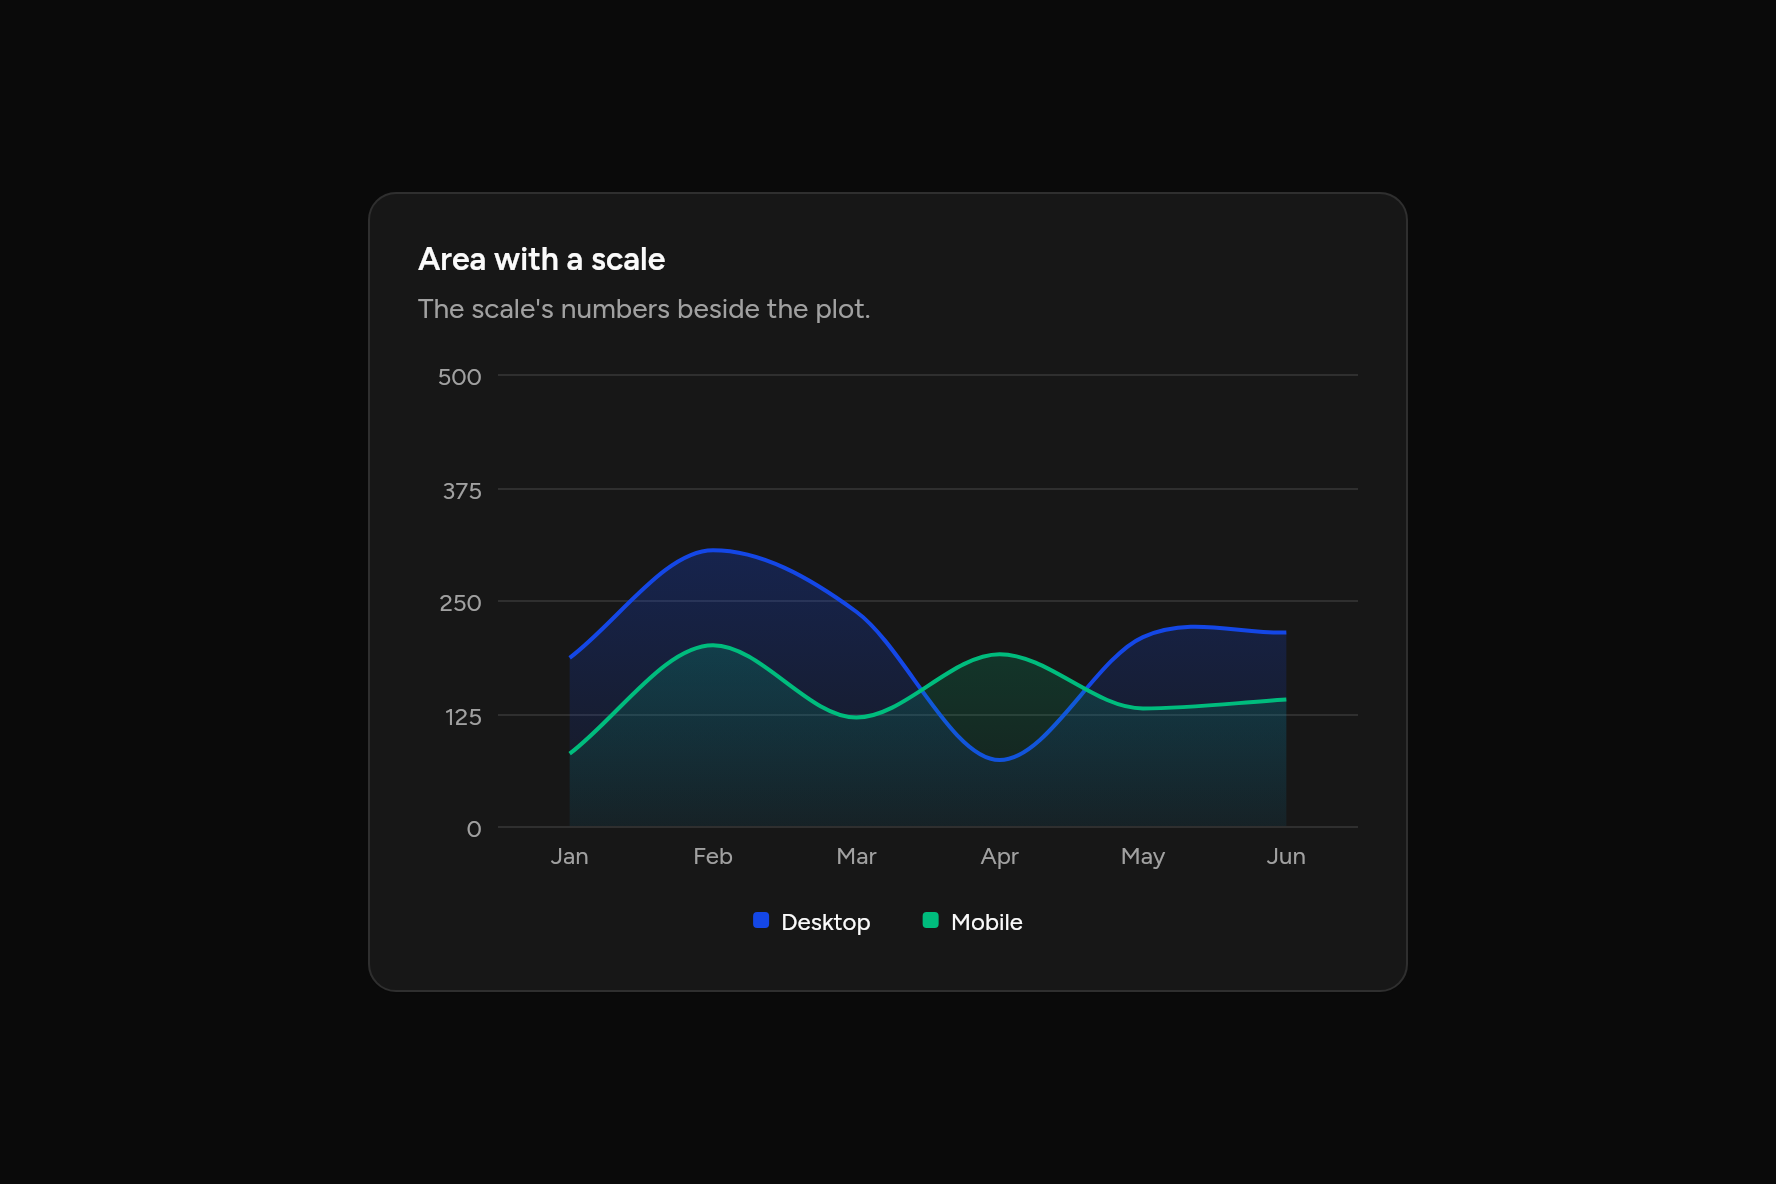
Area with a scale
The scale's numbers beside the plot.
Code
// Area with a scale: The scale's numbers beside the plot. Sample data.
import 'package:flutter/widgets.dart';

import 'ui/card.dart';
import 'ui/chart.dart';

class AreaAxisChart extends StatelessWidget {
  const AreaAxisChart({super.key});

  @override
  Widget build(BuildContext context) => SizedBox(
    width: 520,
    child: Card(
      children: [
        const CardHeader(
          title: Text("Area with a scale"),
          description: Text("The scale's numbers beside the plot."),
        ),
        CardContent(
          child: AreaChart(
            labels: ['Jan', 'Feb', 'Mar', 'Apr', 'May', 'Jun'],
            series: const [
              ChartSeries('Desktop', [186, 305, 237, 73, 209, 214]),
              ChartSeries('Mobile', [80, 200, 120, 190, 130, 140]),
            ],
            axis: true,
          ),
        ),
      ],
    ),
  );
}
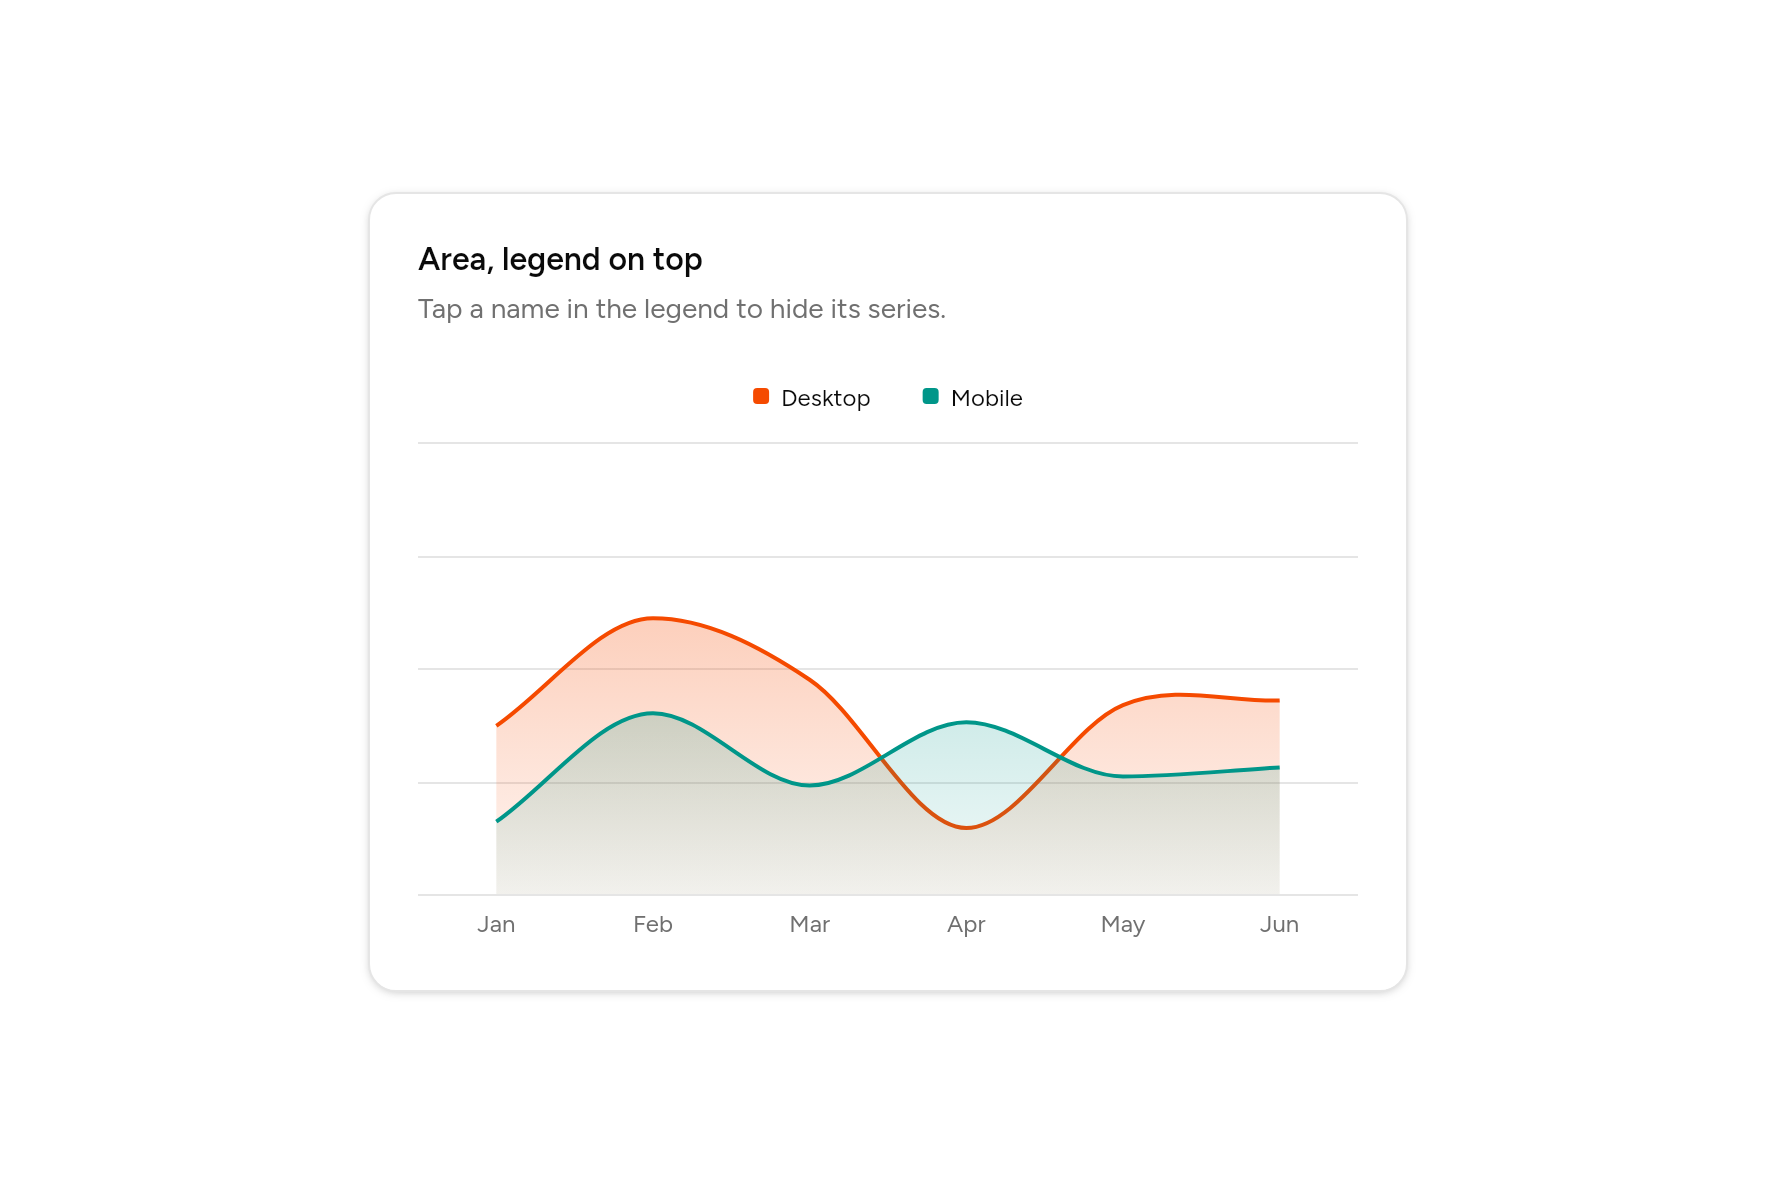
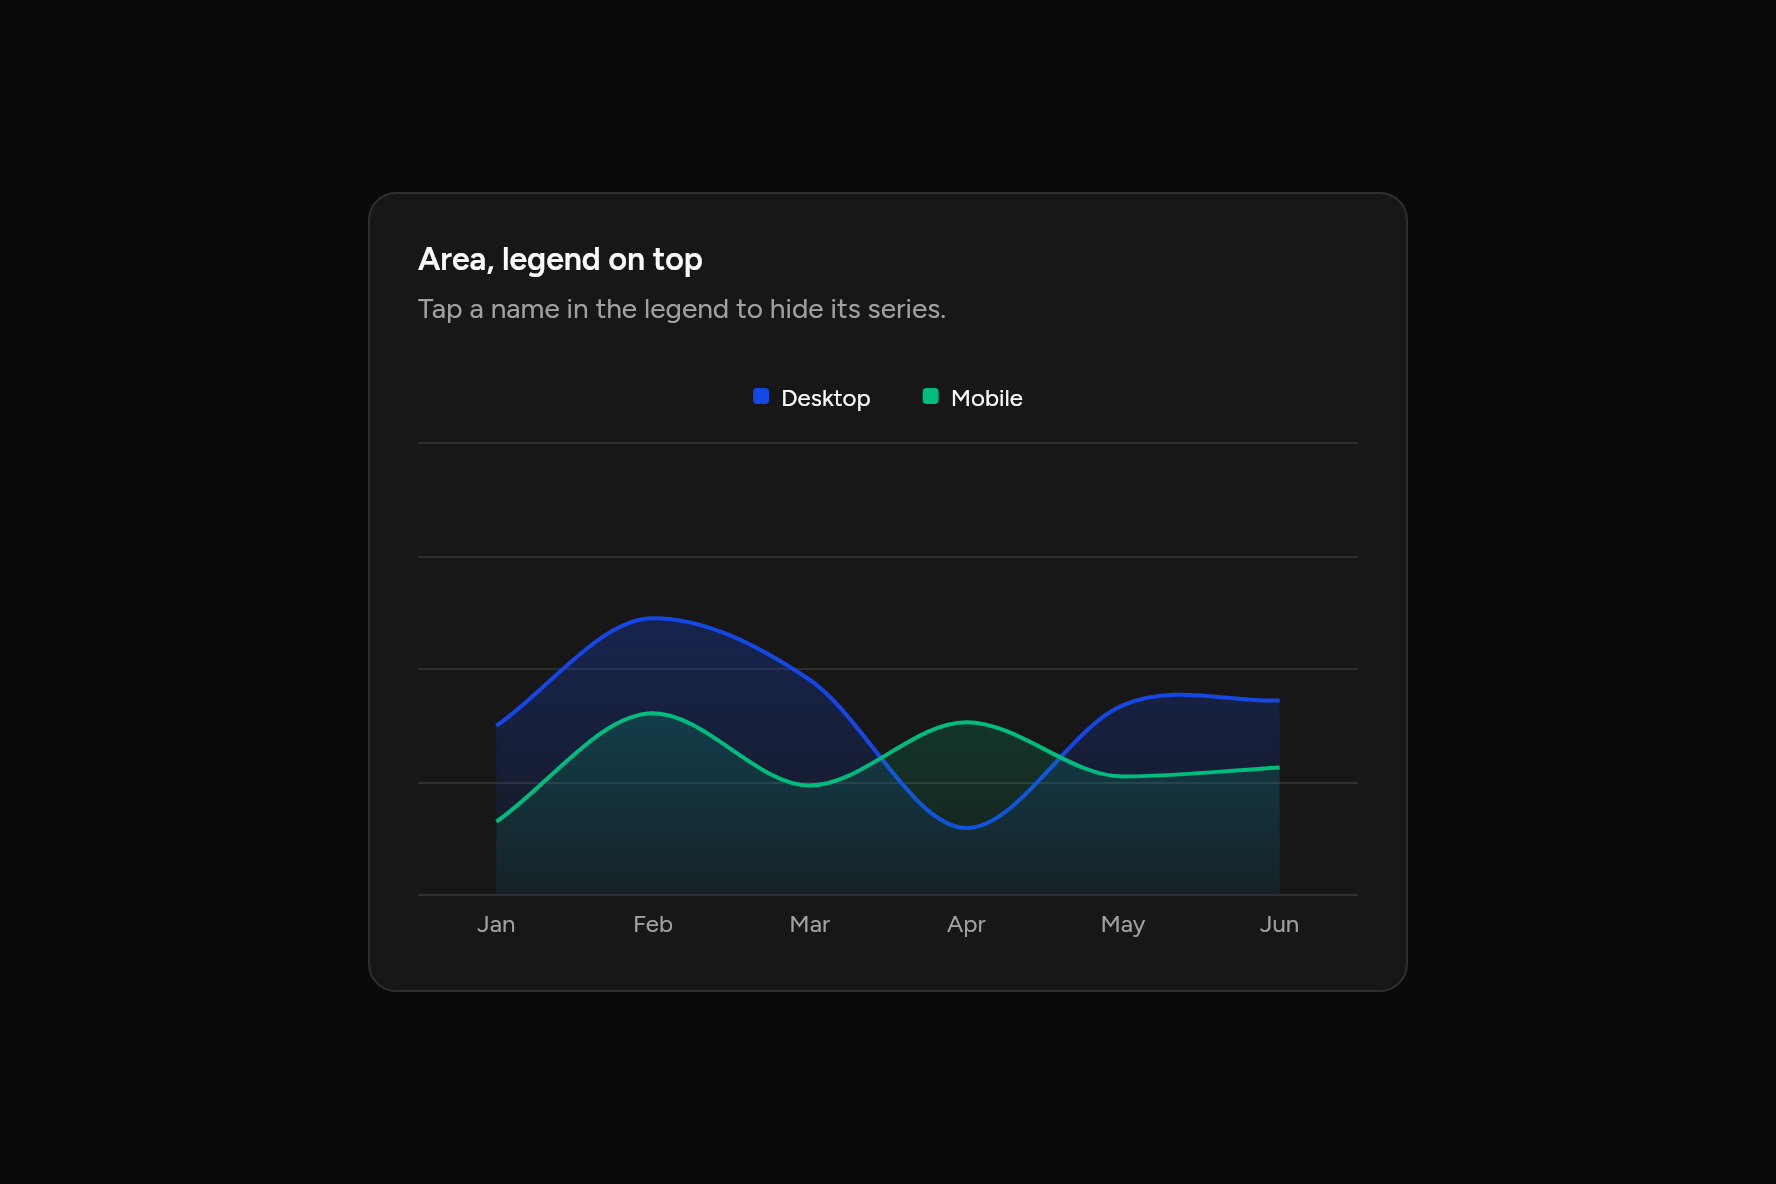
Area, legend on top
Tap a name in the legend to hide its series.
Code
// Area, legend on top: Tap a name in the legend to hide its series. Sample data.
import 'package:flutter/widgets.dart';

import 'ui/card.dart';
import 'ui/chart.dart';

class AreaLegendChart extends StatelessWidget {
  const AreaLegendChart({super.key});

  @override
  Widget build(BuildContext context) => SizedBox(
    width: 520,
    child: Card(
      children: [
        const CardHeader(
          title: Text("Area, legend on top"),
          description: Text("Tap a name in the legend to hide its series."),
        ),
        CardContent(
          child: AreaChart(
            labels: ['Jan', 'Feb', 'Mar', 'Apr', 'May', 'Jun'],
            series: const [
              ChartSeries('Desktop', [186, 305, 237, 73, 209, 214]),
              ChartSeries('Mobile', [80, 200, 120, 190, 130, 140]),
            ],
            legend: ChartLegend.top,
          ),
        ),
      ],
    ),
  );
}
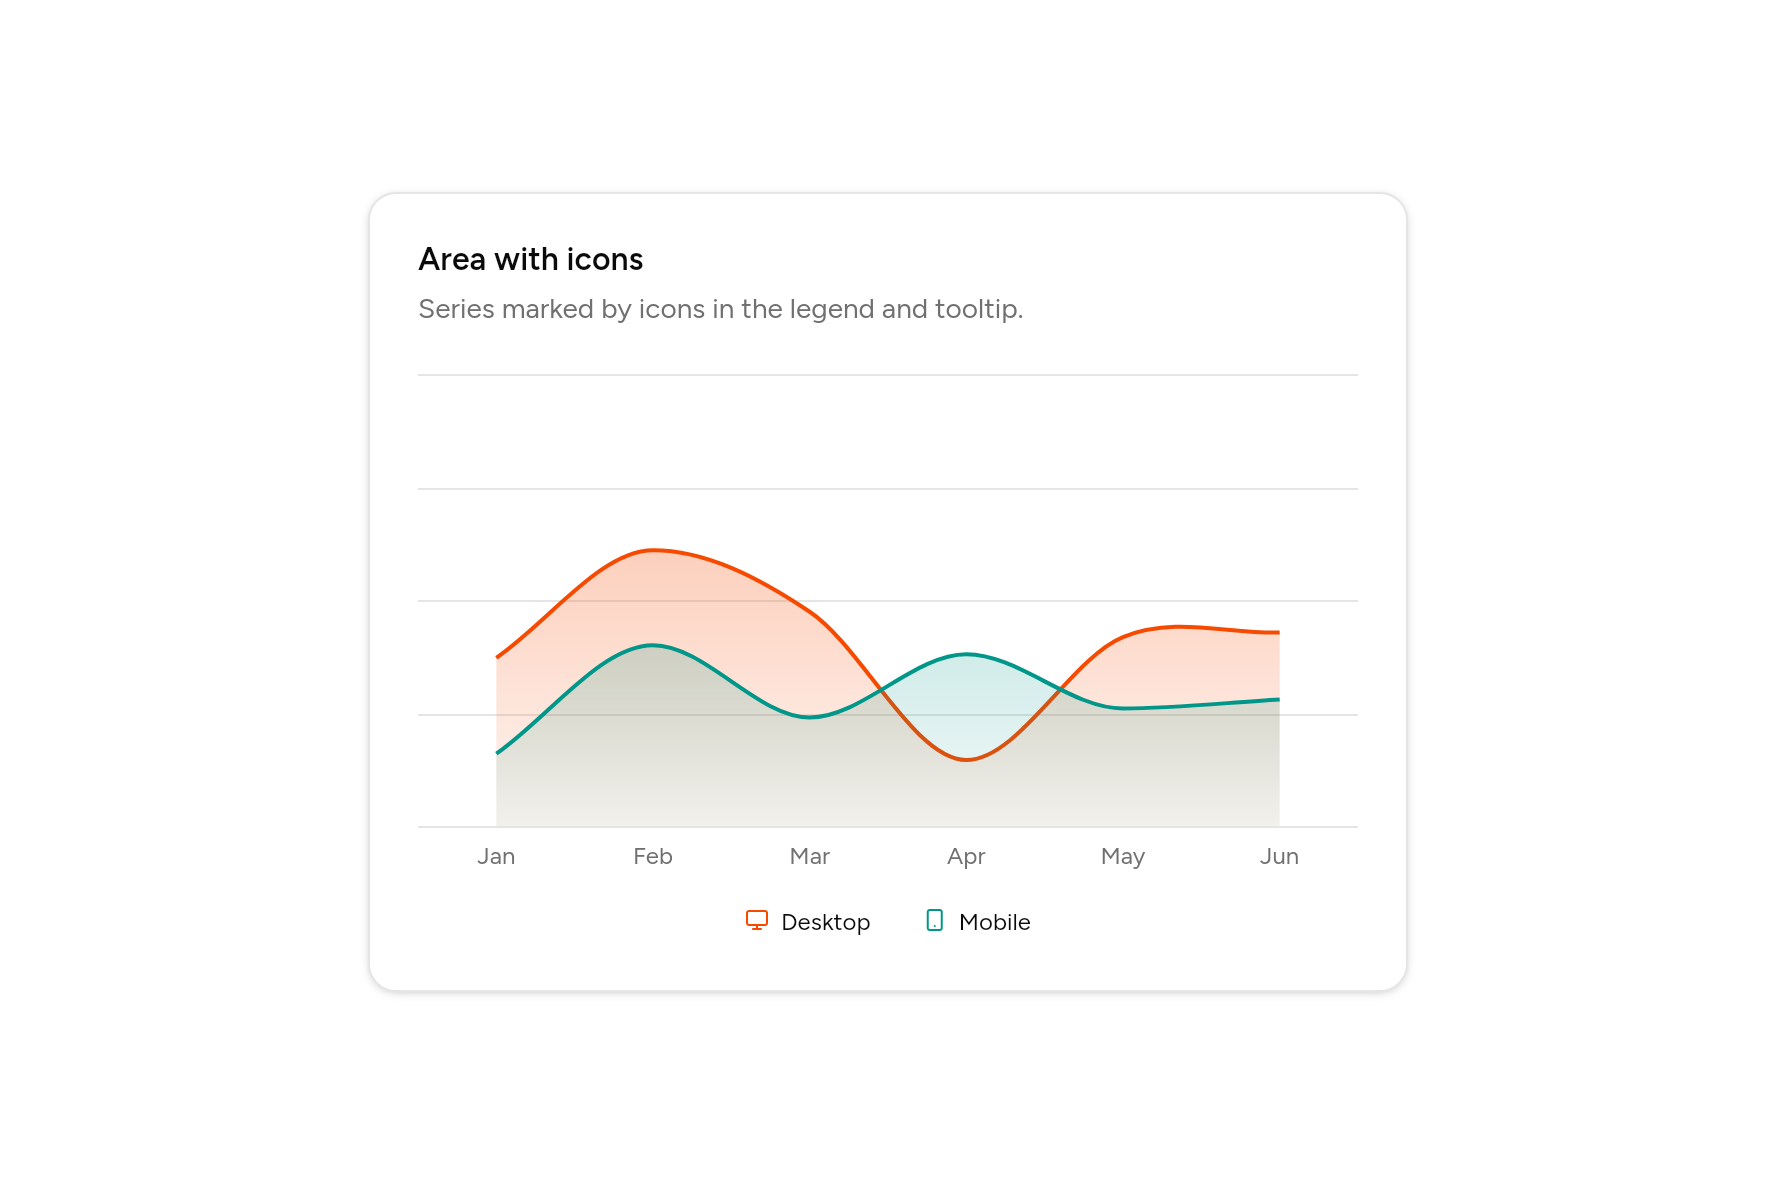
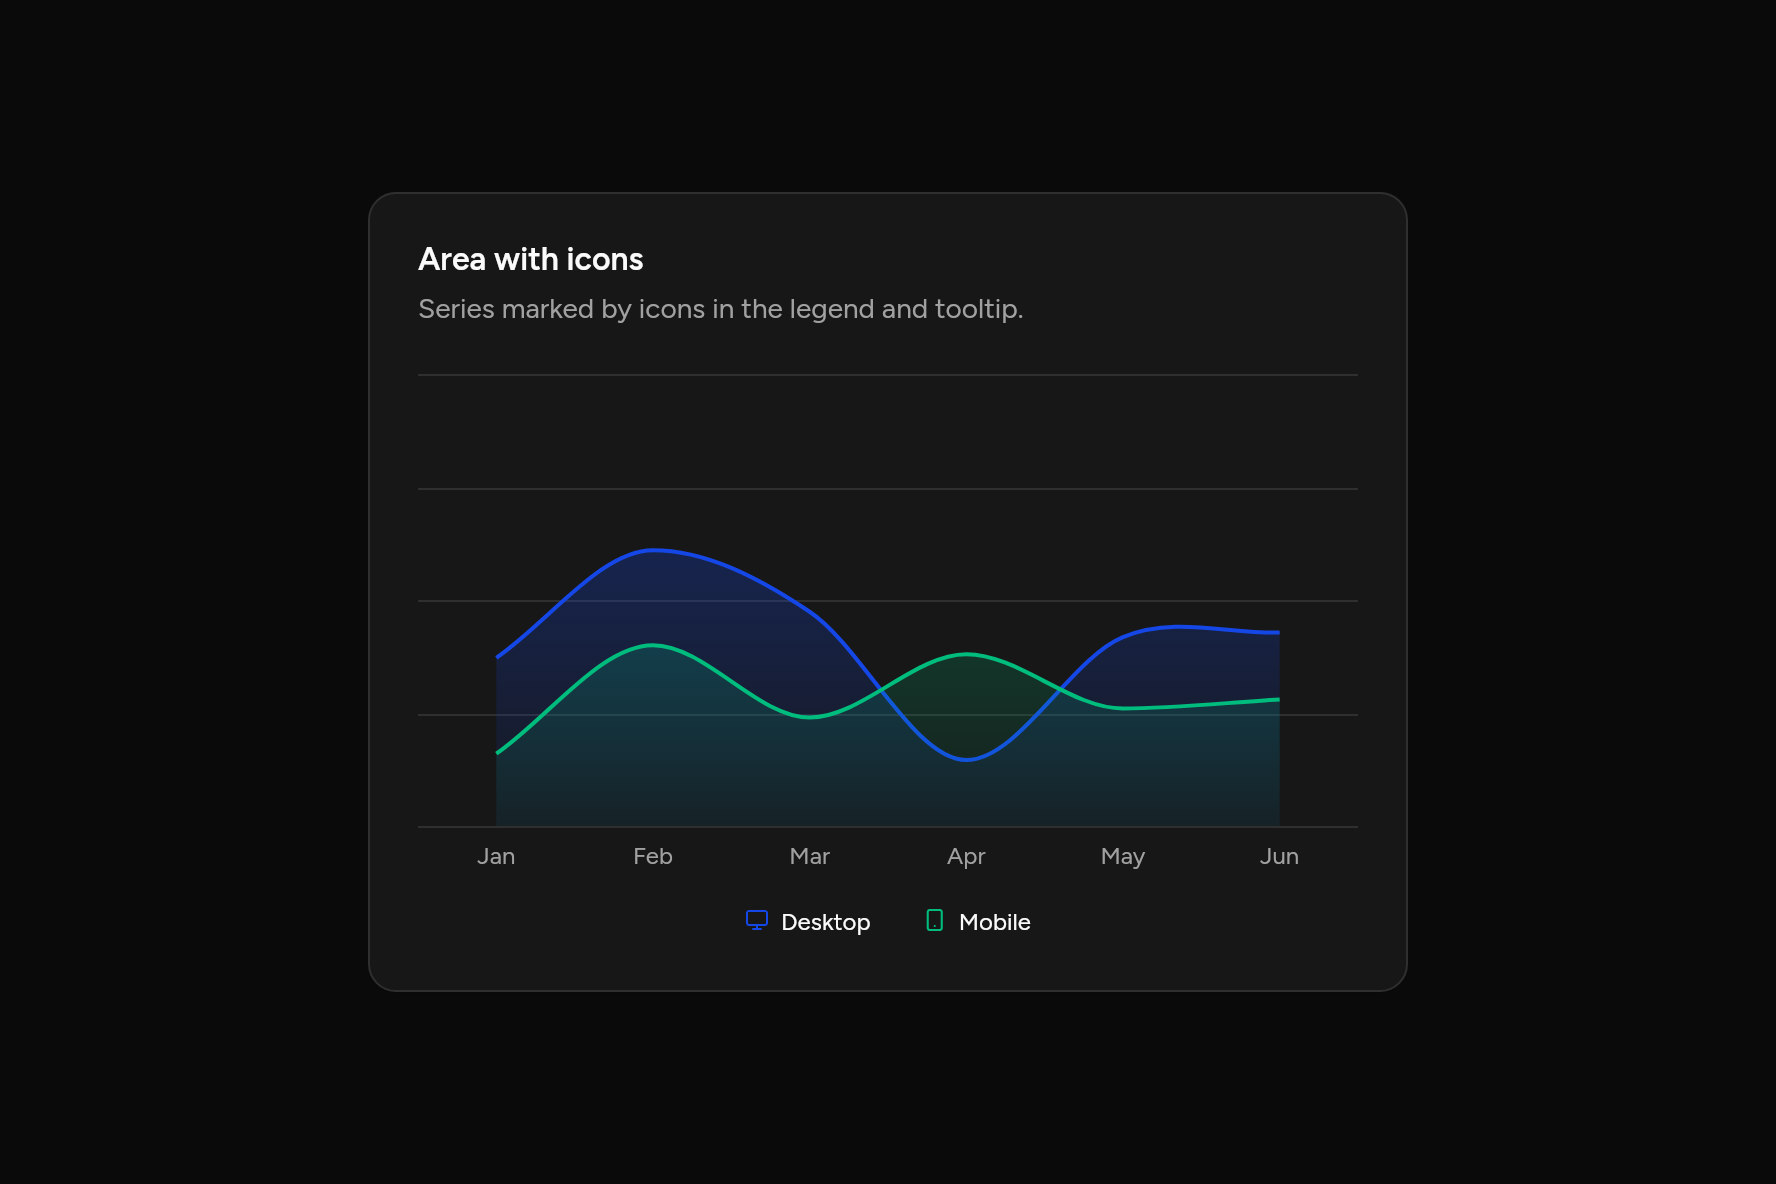
Area with icons
Series marked by icons in the legend and tooltip.
Code
// Area with icons: Series marked by icons in the legend and tooltip. Sample data.
import 'package:ashlar_icons/ashlar_icons.dart';
import 'package:flutter/widgets.dart';

import 'ui/card.dart';
import 'ui/chart.dart';

class AreaIconsChart extends StatelessWidget {
  const AreaIconsChart({super.key});

  @override
  Widget build(BuildContext context) => SizedBox(
    width: 520,
    child: Card(
      children: [
        const CardHeader(
          title: Text("Area with icons"),
          description: Text("Series marked by icons in the legend and tooltip."),
        ),
        CardContent(
          child: AreaChart(
            labels: ['Jan', 'Feb', 'Mar', 'Apr', 'May', 'Jun'],
            series: const [
              ChartSeries('Desktop', [186, 305, 237, 73, 209, 214], icon: AshlarIconsRoundedStroke.monitor),
              ChartSeries('Mobile', [80, 200, 120, 190, 130, 140], icon: AshlarIconsRoundedStroke.smartphone),
            ],
          ),
        ),
      ],
    ),
  );
}
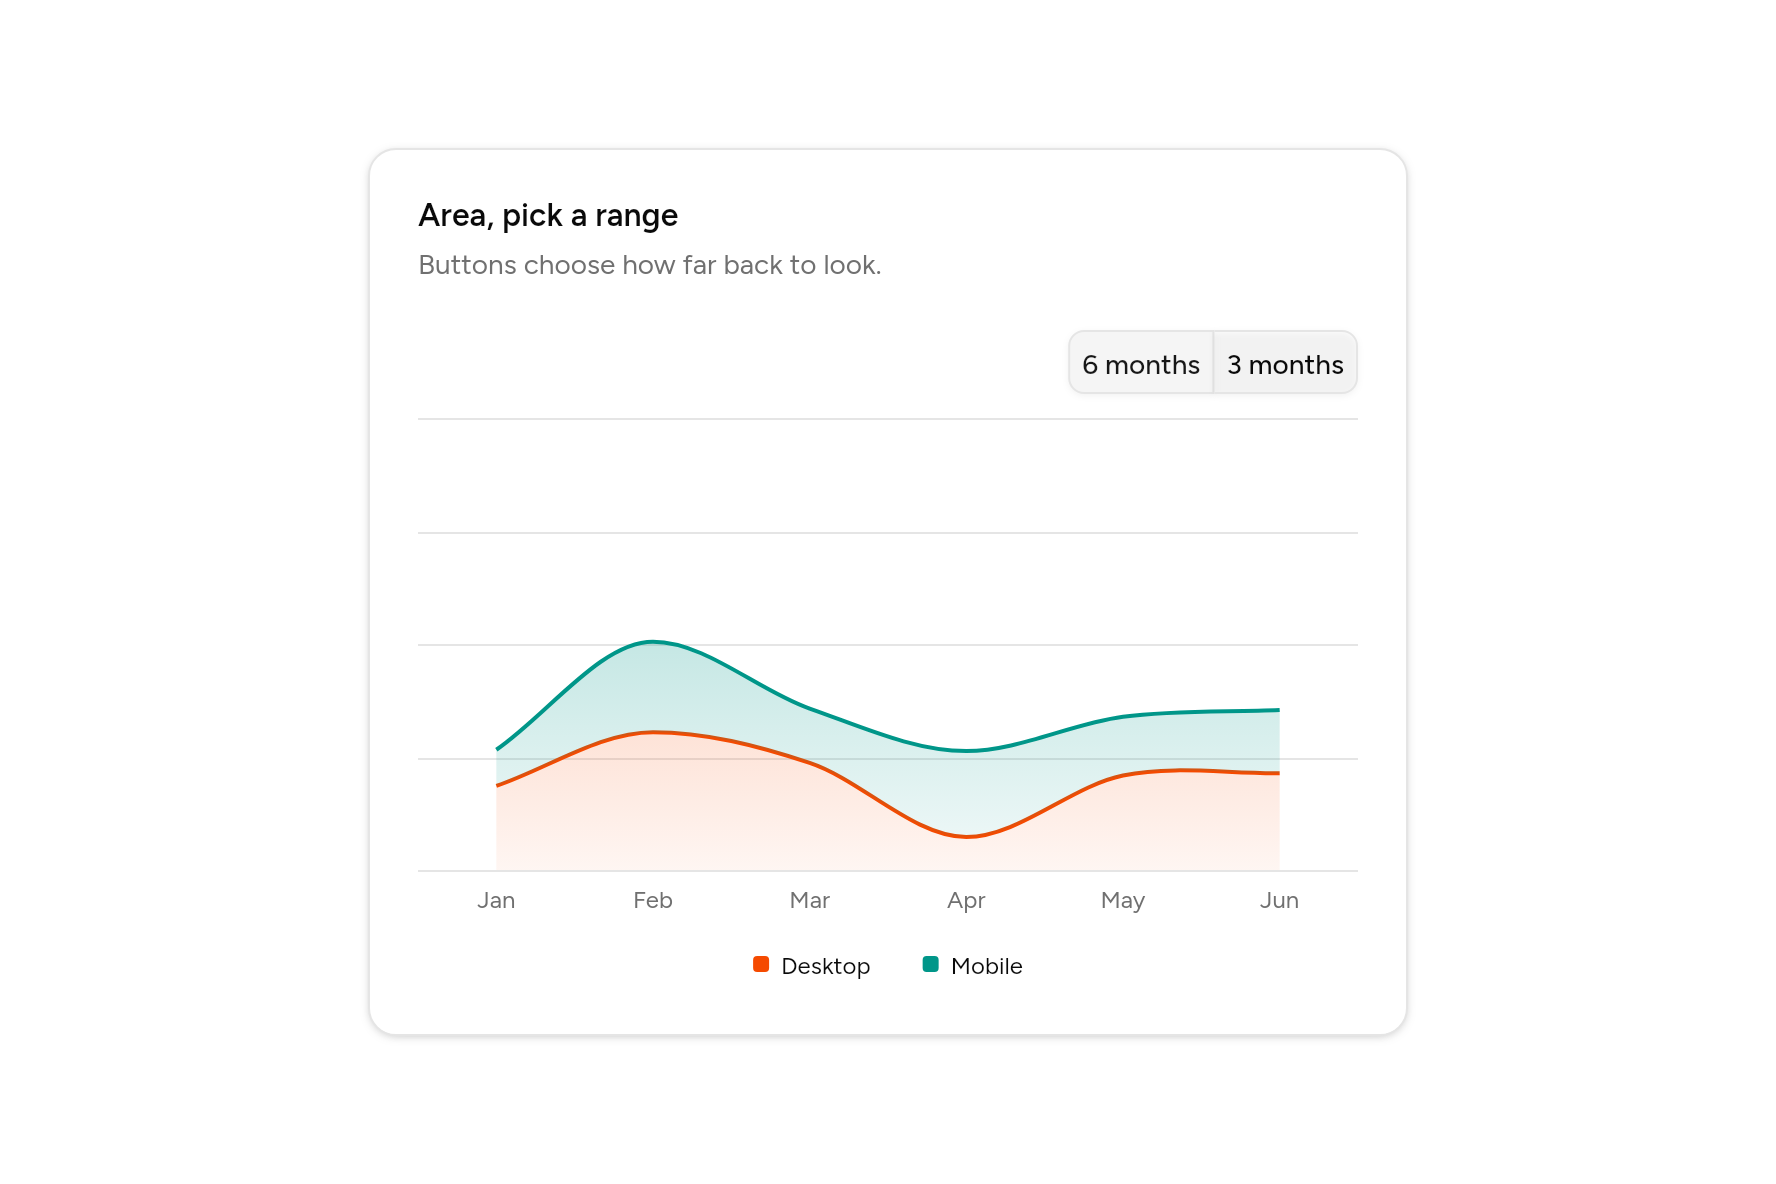
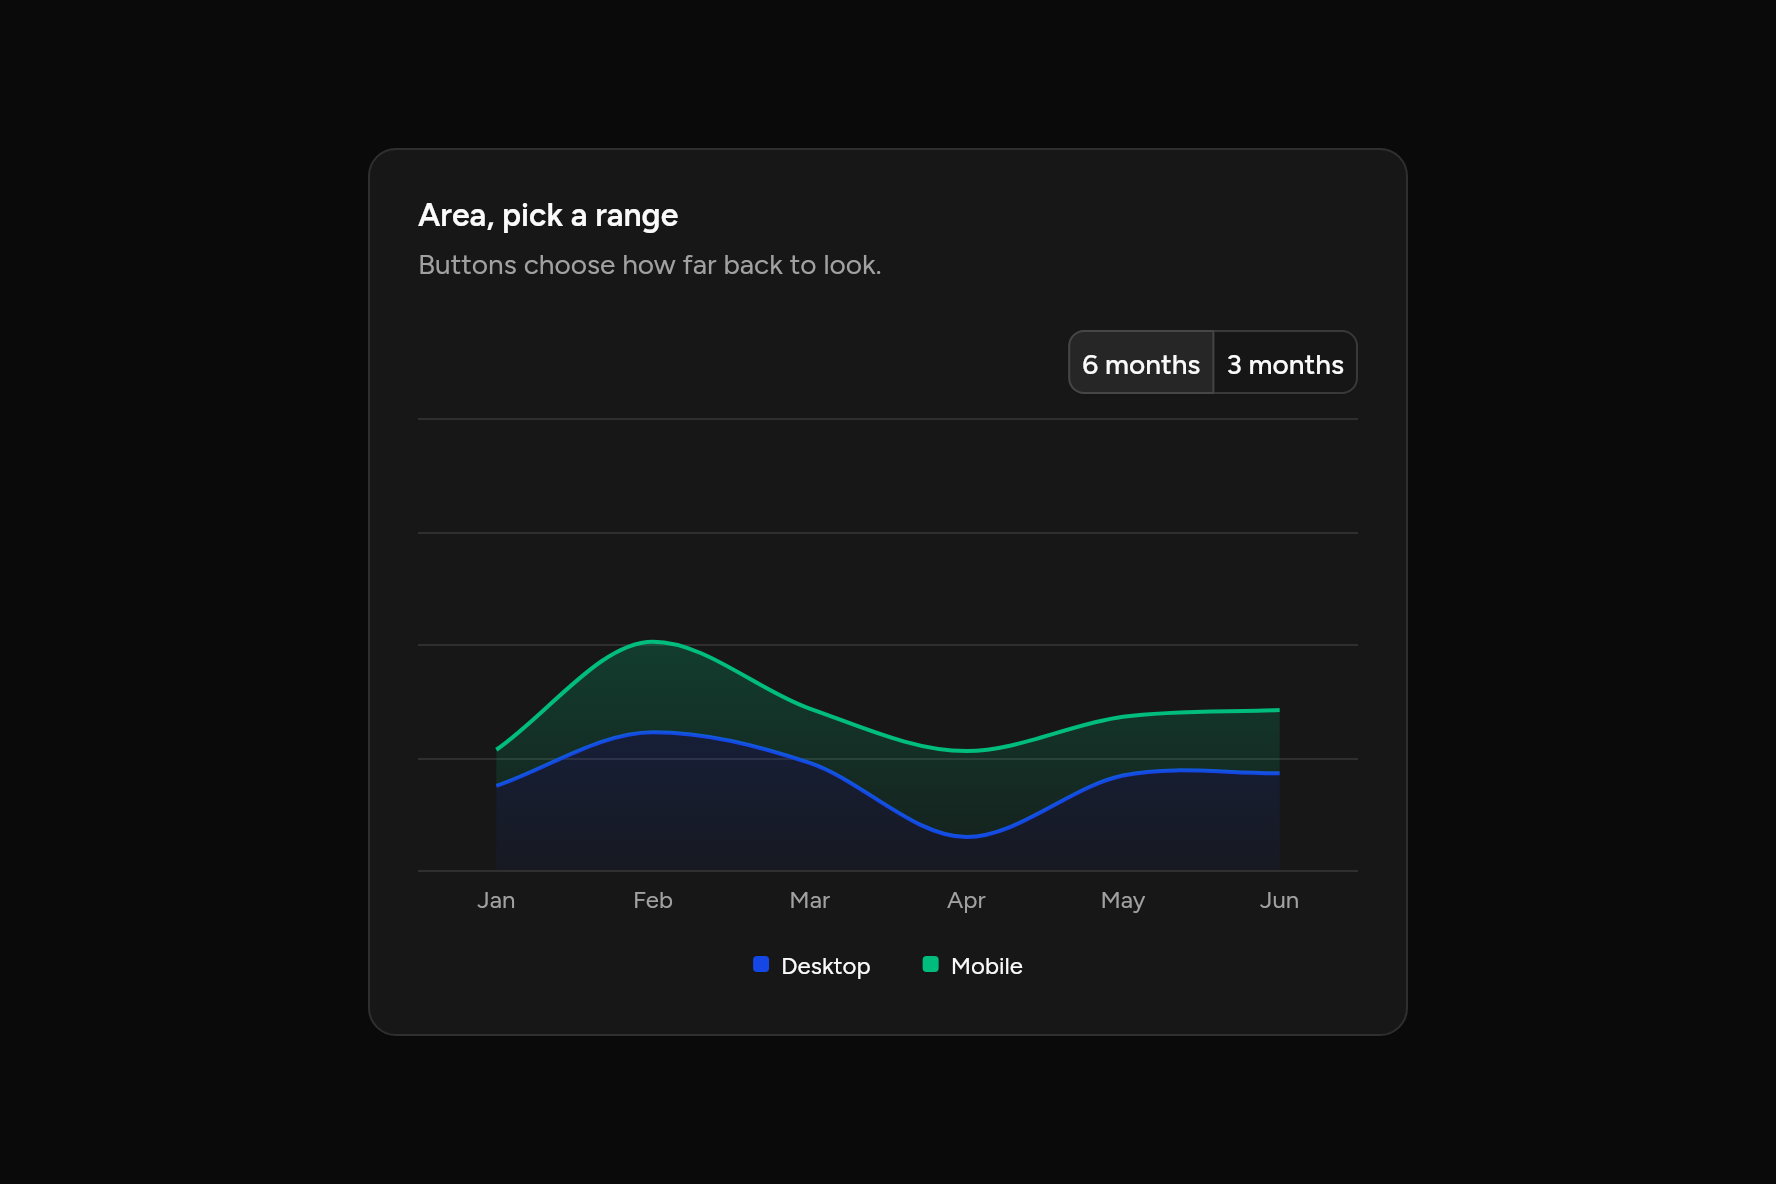
Area, pick a range
Buttons choose how far back to look.
Code
// Area, pick a range: Buttons choose how far back to look. Sample data.
import 'package:flutter/widgets.dart';

import 'ui/card.dart';
import 'ui/chart.dart';
import 'ui/toggle.dart';
import 'ui/toggle_group.dart';

class AreaInteractiveChart extends StatefulWidget {
  const AreaInteractiveChart({super.key});

  @override
  State<AreaInteractiveChart> createState() => _AreaInteractiveChartState();
}

class _AreaInteractiveChartState extends State<AreaInteractiveChart> {
  var months = 6;

  @override
  Widget build(BuildContext context) => SizedBox(
    width: 520,
    child: Card(
      children: [
        const CardHeader(
          title: Text("Area, pick a range"),
          description: Text("Buttons choose how far back to look."),
        ),
        CardContent(
          child: Column(
            mainAxisSize: MainAxisSize.min,
            crossAxisAlignment: CrossAxisAlignment.stretch,
            children: [
              Align(
                alignment: AlignmentDirectional.centerEnd,
                child: ToggleGroup<int>(
                  values: {months},
                  size: ToggleSize.sm,
                  semanticLabel: 'Range',
                  onChanged: (v) {
                    if (v.isNotEmpty) setState(() => months = v.first);
                  },
                  items: const [
                    ToggleGroupItem(6, Text('6 months')),
                    ToggleGroupItem(3, Text('3 months')),
                  ],
                ),
              ),
              const SizedBox(height: 12),
              AreaChart(
                labels: const ['Jan', 'Feb', 'Mar', 'Apr', 'May', 'Jun'].sublist(6 - months),
                series: [
                  ChartSeries('Desktop', const <double>[186, 305, 237, 73, 209, 214].sublist(6 - months)),
                  ChartSeries('Mobile', const <double>[80, 200, 120, 190, 130, 140].sublist(6 - months)),
                ],
                stacked: true,
              ),
            ],
          ),
        ),
      ],
    ),
  );
}
Bar
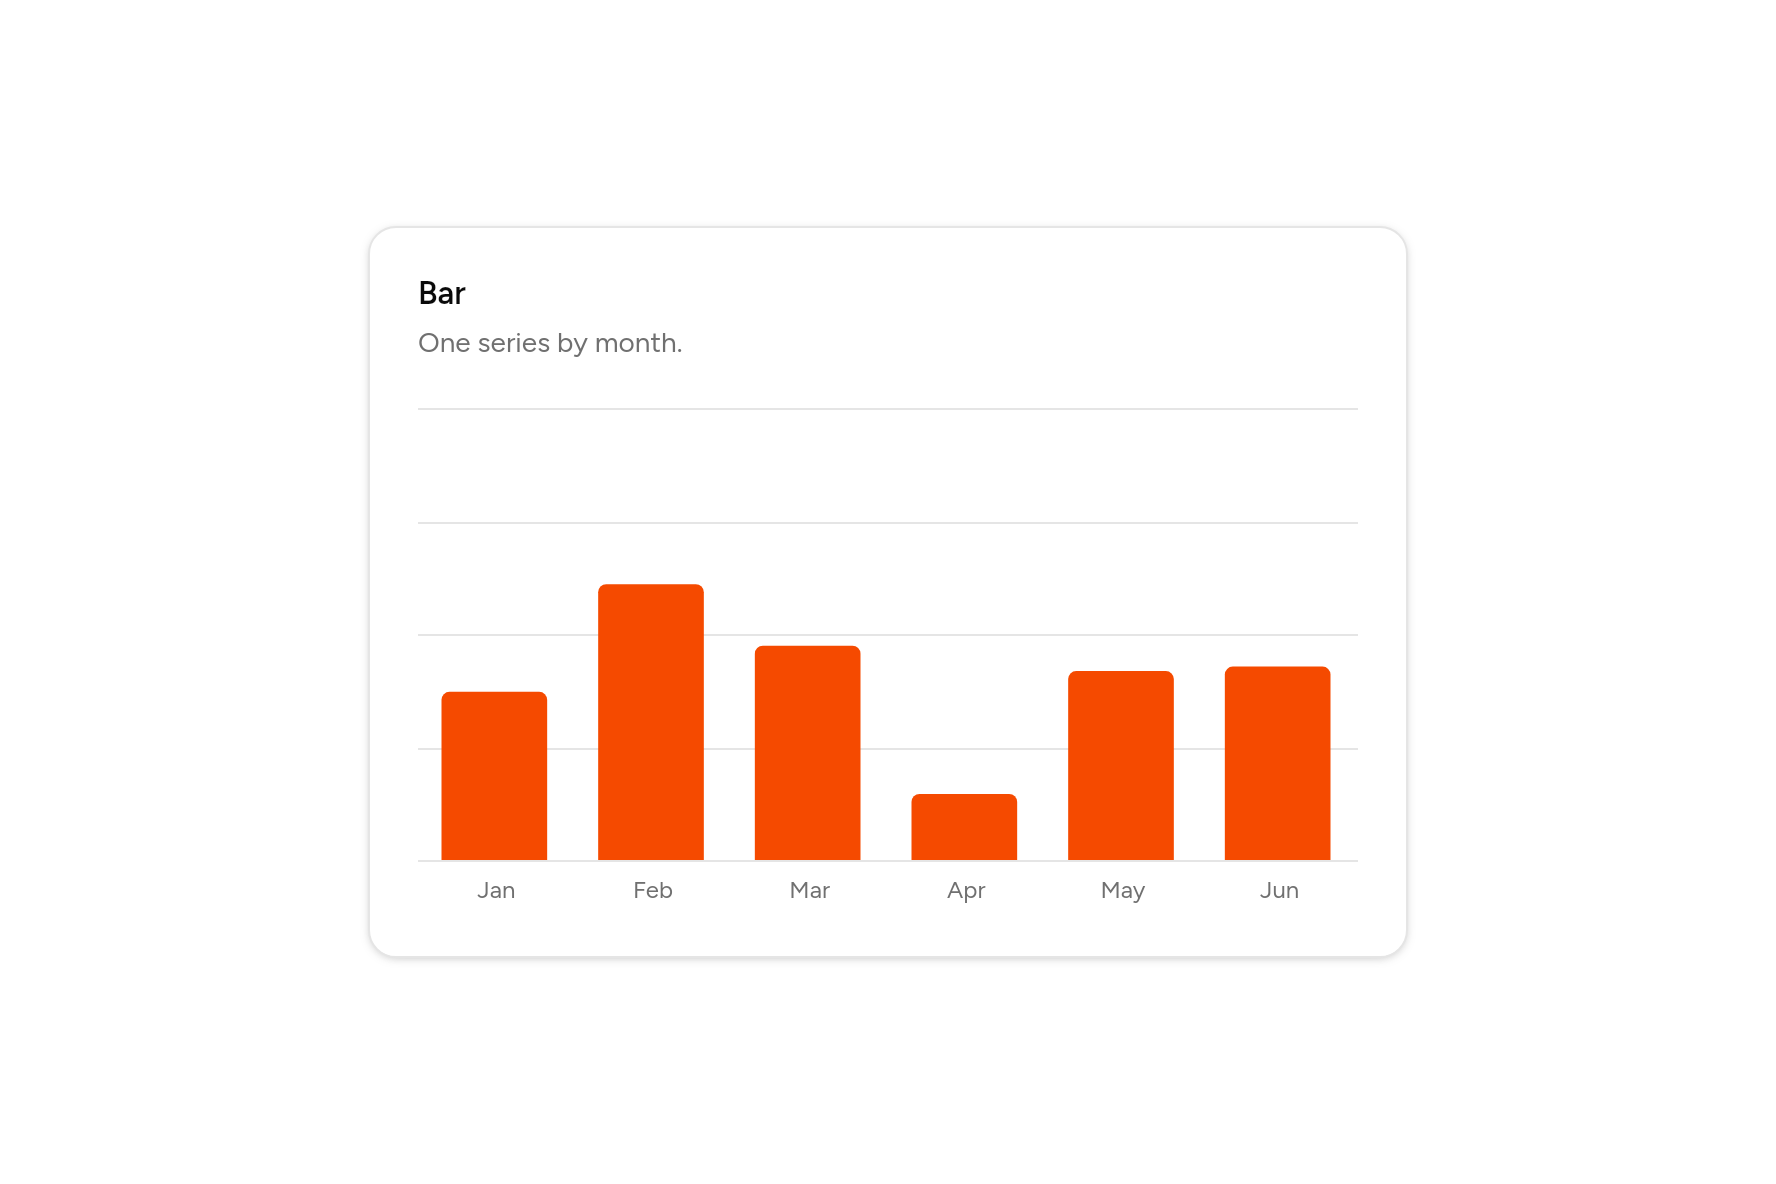
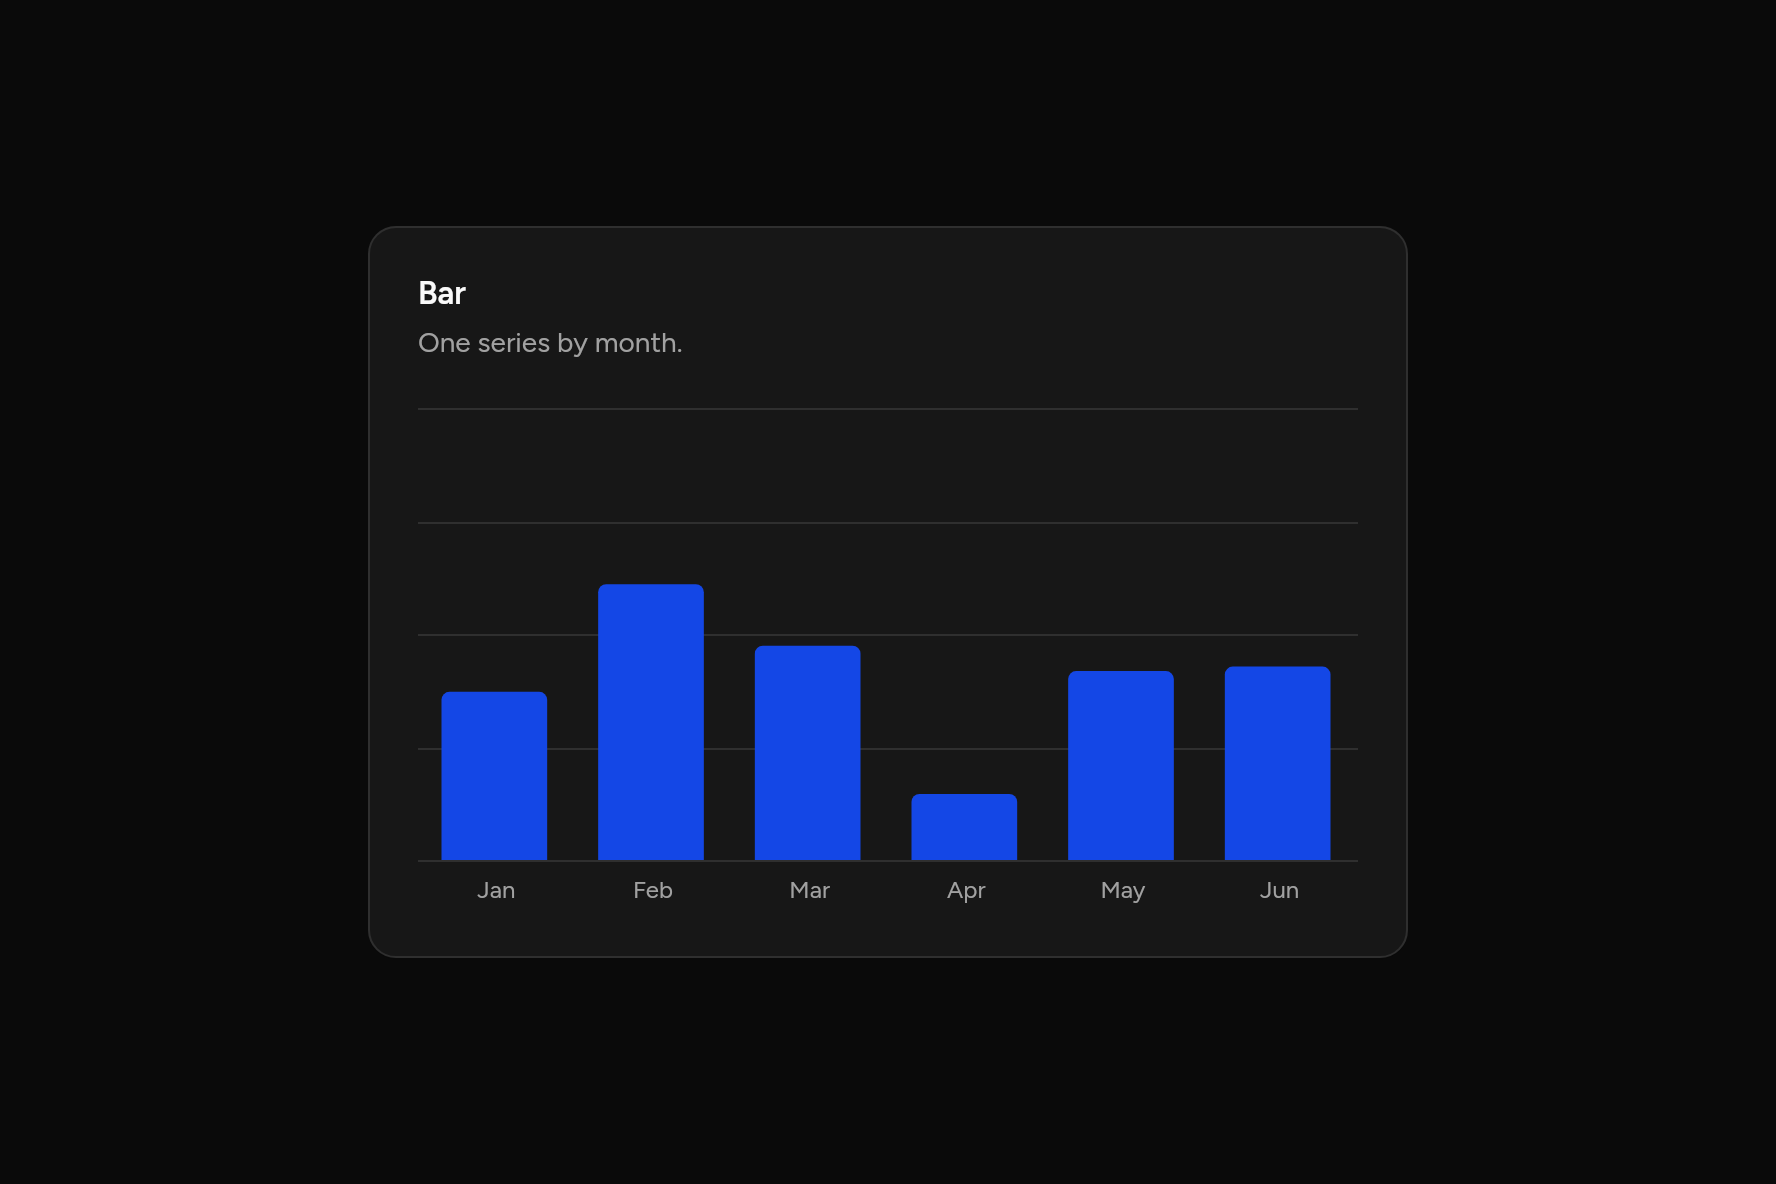
Bar
One series by month.
Code
// Bar: One series by month. Sample data.
import 'package:flutter/widgets.dart';

import 'ui/card.dart';
import 'ui/chart.dart';

class BarDefaultChart extends StatelessWidget {
  const BarDefaultChart({super.key});

  @override
  Widget build(BuildContext context) => SizedBox(
    width: 520,
    child: Card(
      children: [
        const CardHeader(
          title: Text("Bar"),
          description: Text("One series by month."),
        ),
        CardContent(
          child: BarChart(
            labels: ['Jan', 'Feb', 'Mar', 'Apr', 'May', 'Jun'],
            series: const [
              ChartSeries('Desktop', [186, 305, 237, 73, 209, 214]),
            ],
          ),
        ),
      ],
    ),
  );
}
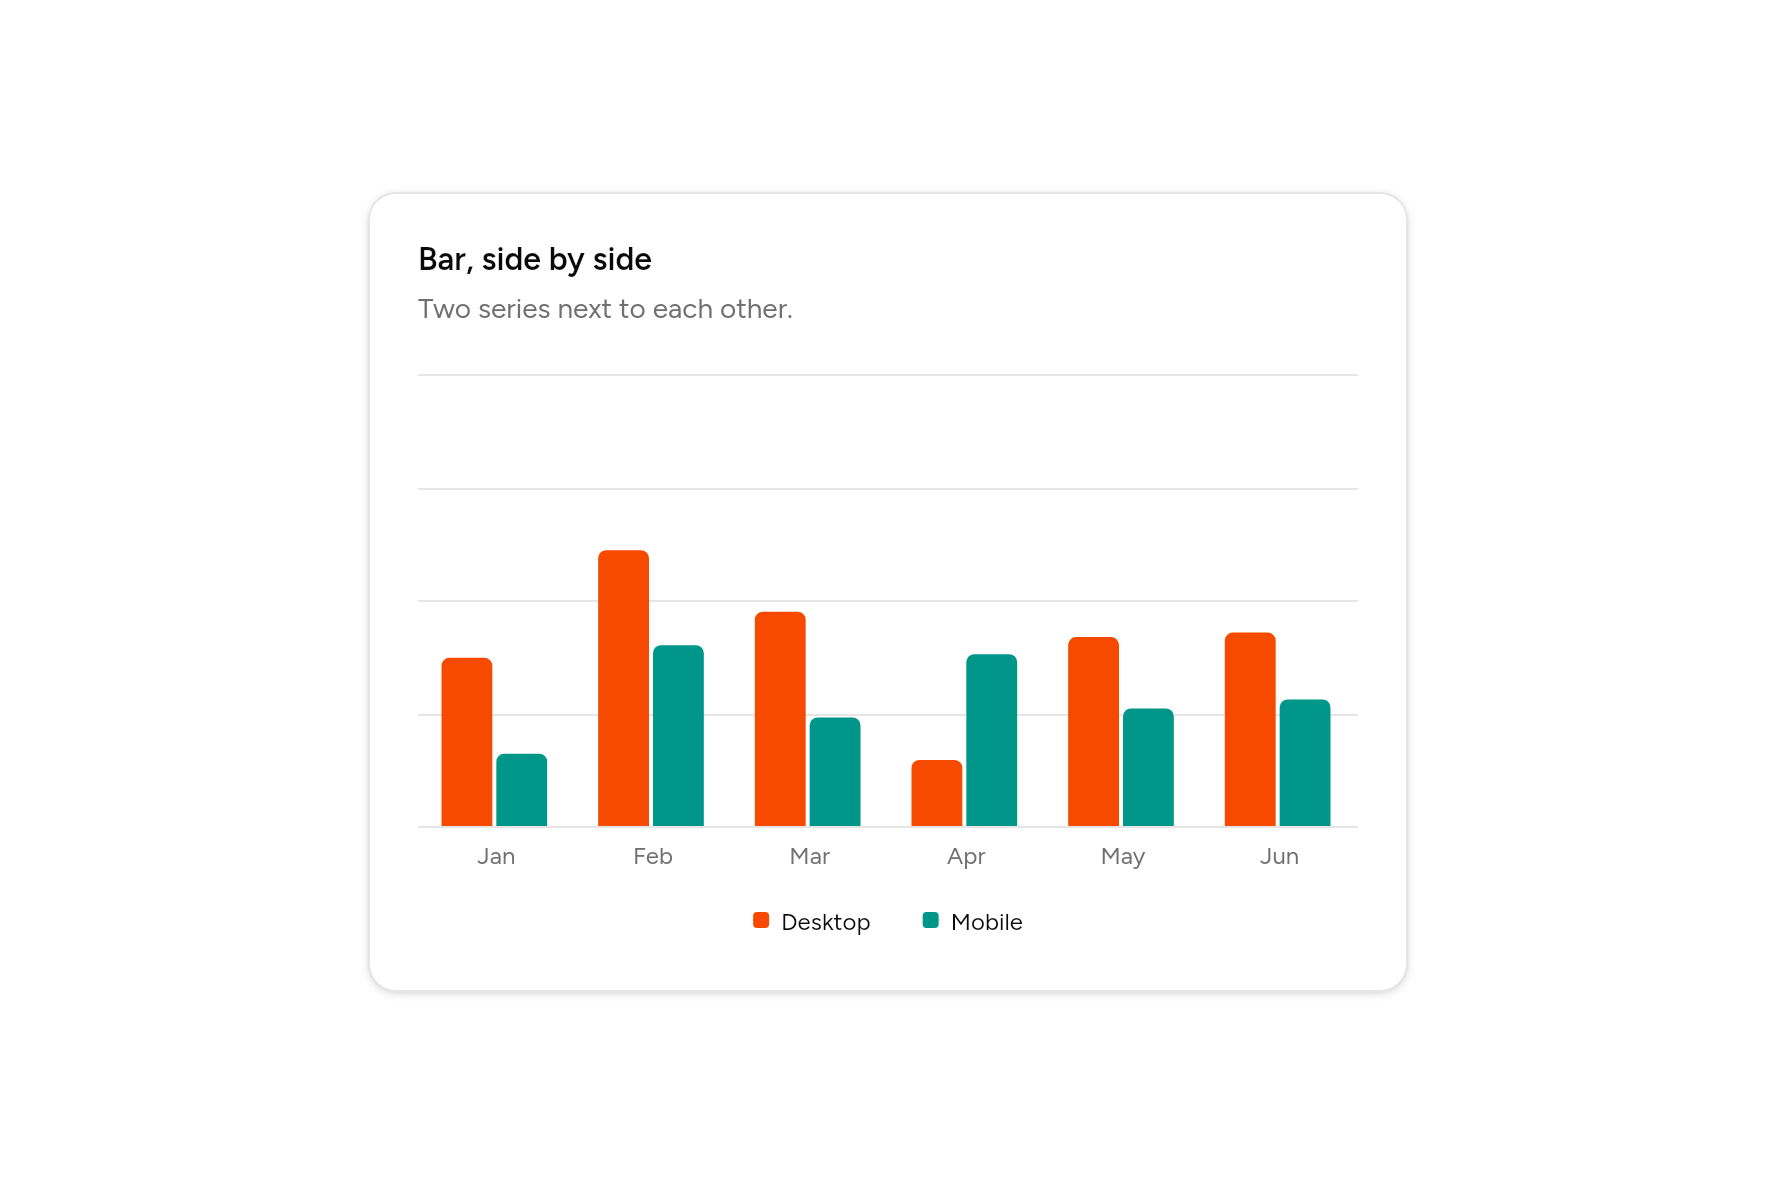
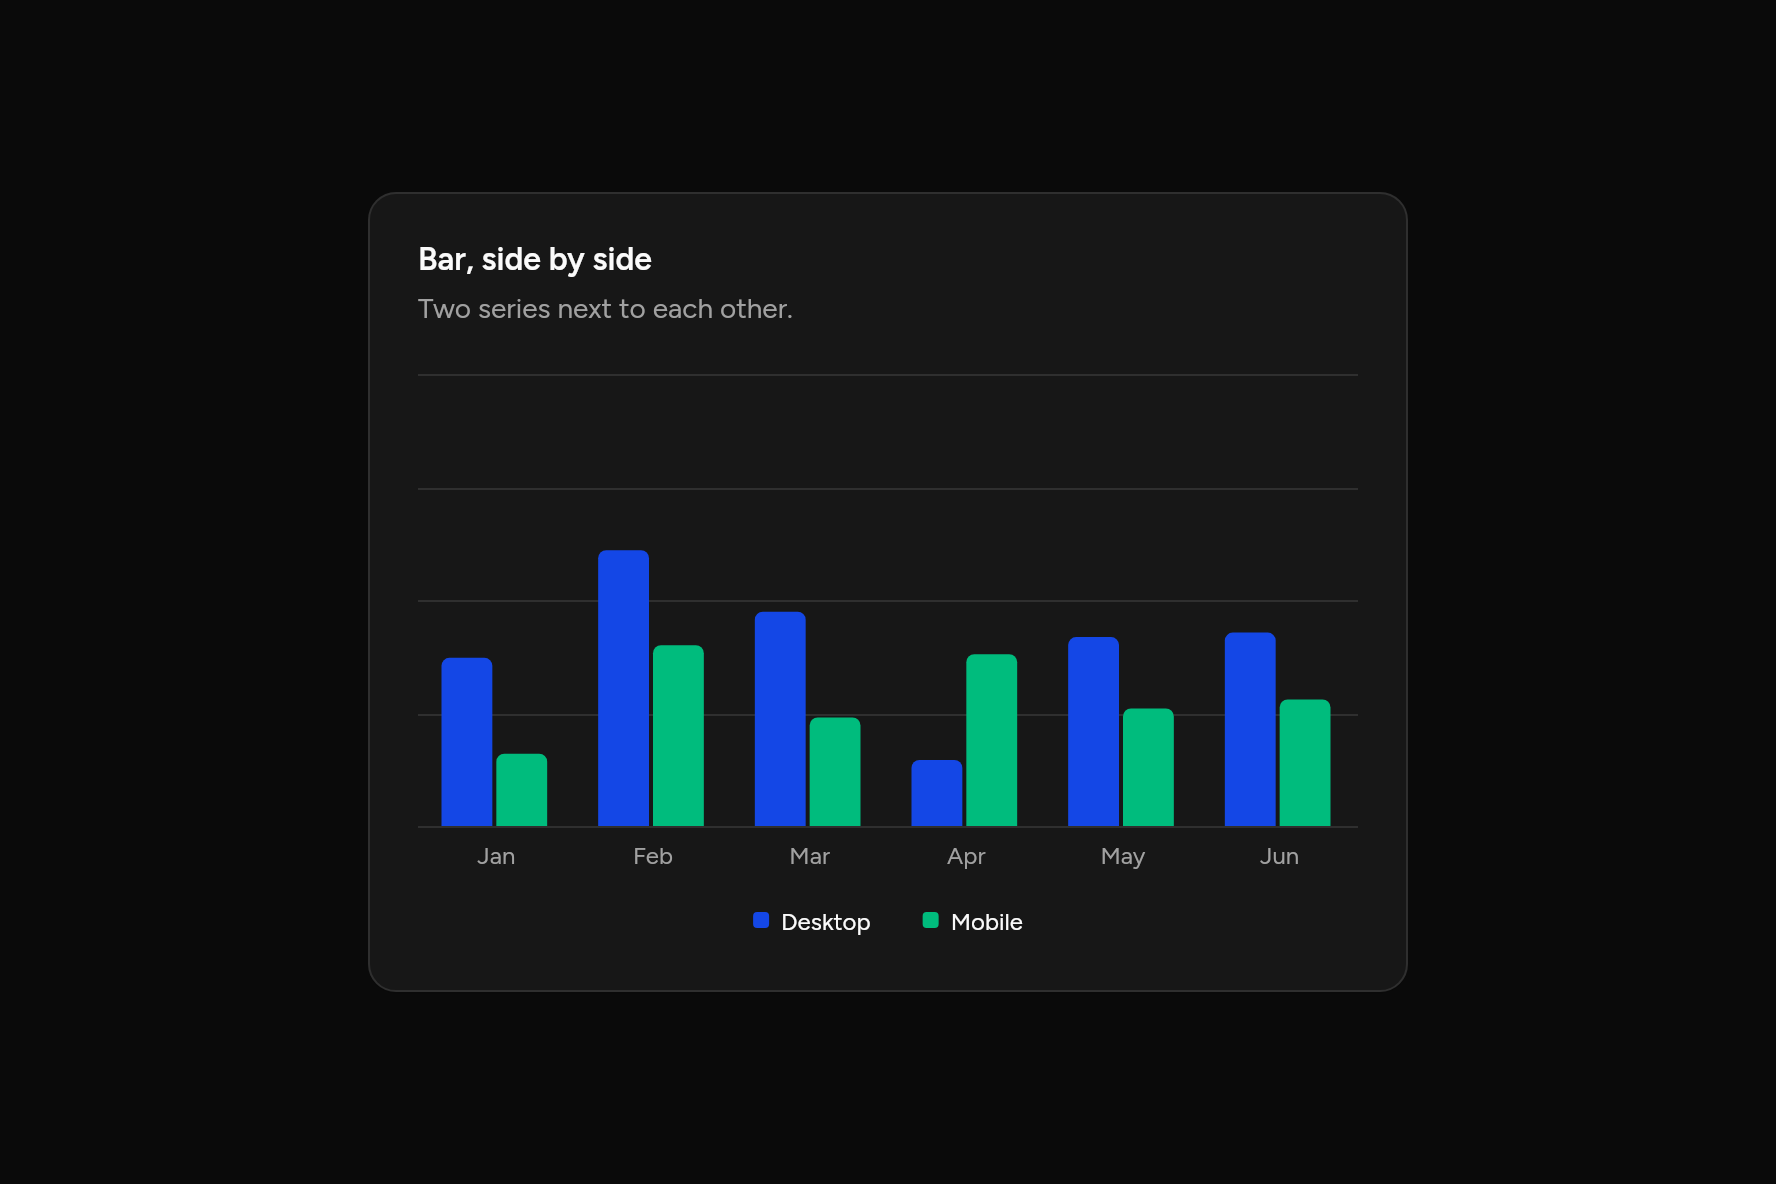
Bar, side by side
Two series next to each other.
Code
// Bar, side by side: Two series next to each other. Sample data.
import 'package:flutter/widgets.dart';

import 'ui/card.dart';
import 'ui/chart.dart';

class BarMultipleChart extends StatelessWidget {
  const BarMultipleChart({super.key});

  @override
  Widget build(BuildContext context) => SizedBox(
    width: 520,
    child: Card(
      children: [
        const CardHeader(
          title: Text("Bar, side by side"),
          description: Text("Two series next to each other."),
        ),
        CardContent(
          child: BarChart(
            labels: ['Jan', 'Feb', 'Mar', 'Apr', 'May', 'Jun'],
            series: const [
              ChartSeries('Desktop', [186, 305, 237, 73, 209, 214]),
              ChartSeries('Mobile', [80, 200, 120, 190, 130, 140]),
            ],
          ),
        ),
      ],
    ),
  );
}
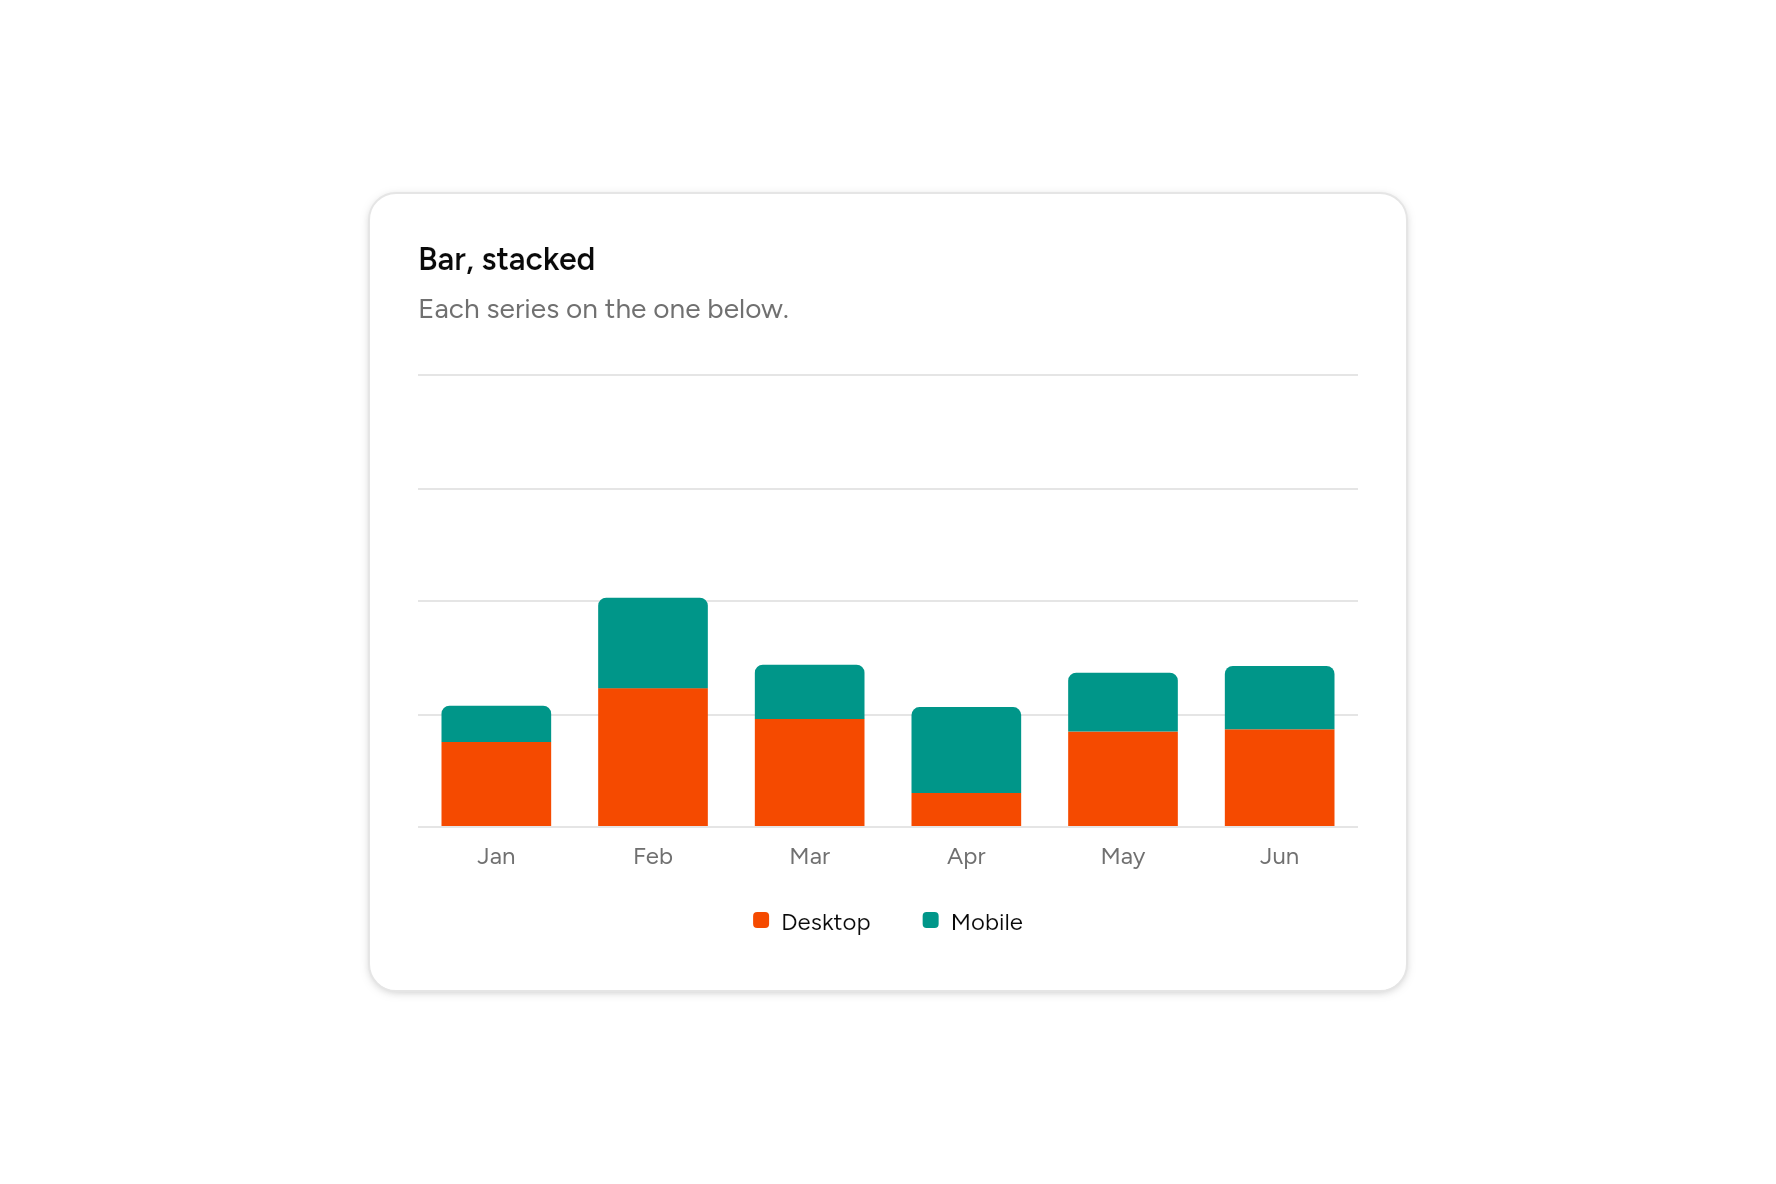
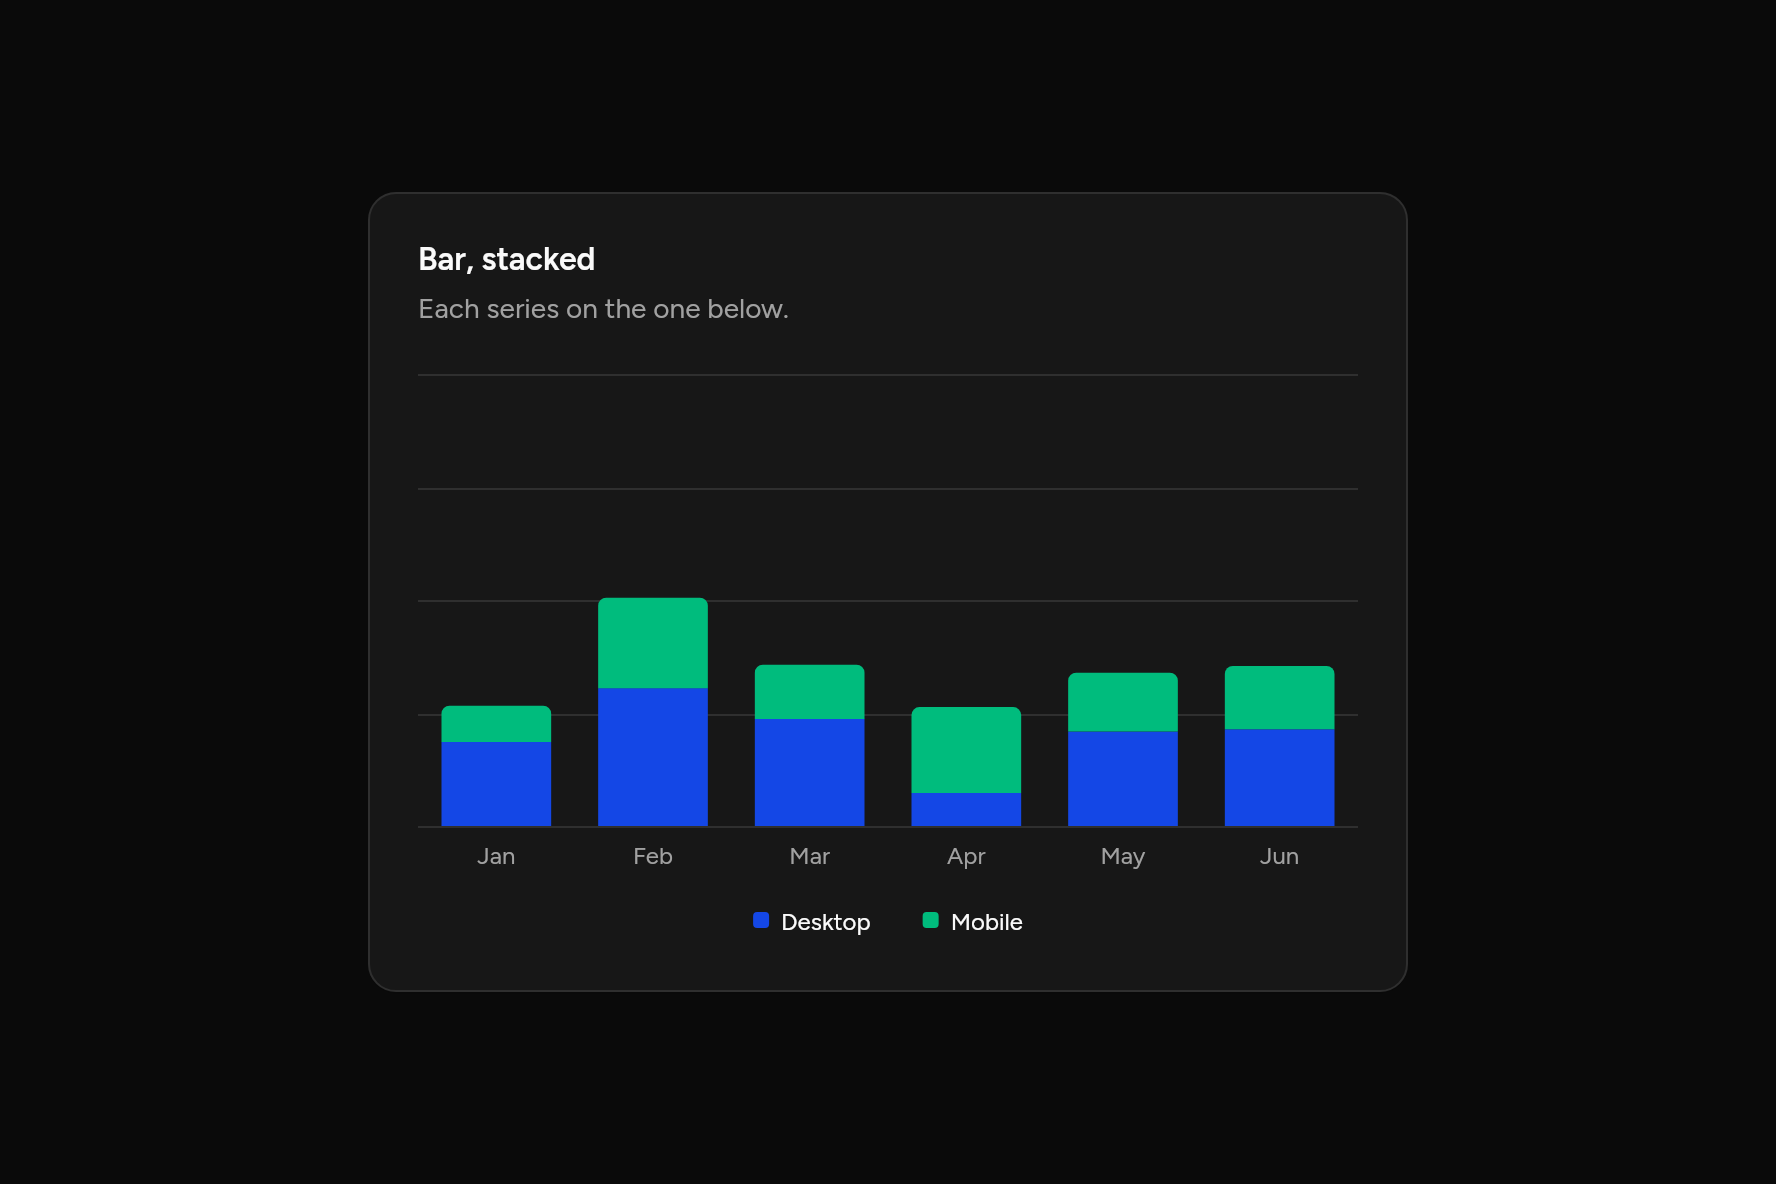
Bar, stacked
Each series on the one below.
Code
// Bar, stacked: Each series on the one below. Sample data.
import 'package:flutter/widgets.dart';

import 'ui/card.dart';
import 'ui/chart.dart';

class BarStackedChart extends StatelessWidget {
  const BarStackedChart({super.key});

  @override
  Widget build(BuildContext context) => SizedBox(
    width: 520,
    child: Card(
      children: [
        const CardHeader(
          title: Text("Bar, stacked"),
          description: Text("Each series on the one below."),
        ),
        CardContent(
          child: BarChart(
            labels: ['Jan', 'Feb', 'Mar', 'Apr', 'May', 'Jun'],
            series: const [
              ChartSeries('Desktop', [186, 305, 237, 73, 209, 214]),
              ChartSeries('Mobile', [80, 200, 120, 190, 130, 140]),
            ],
            stacked: true,
          ),
        ),
      ],
    ),
  );
}
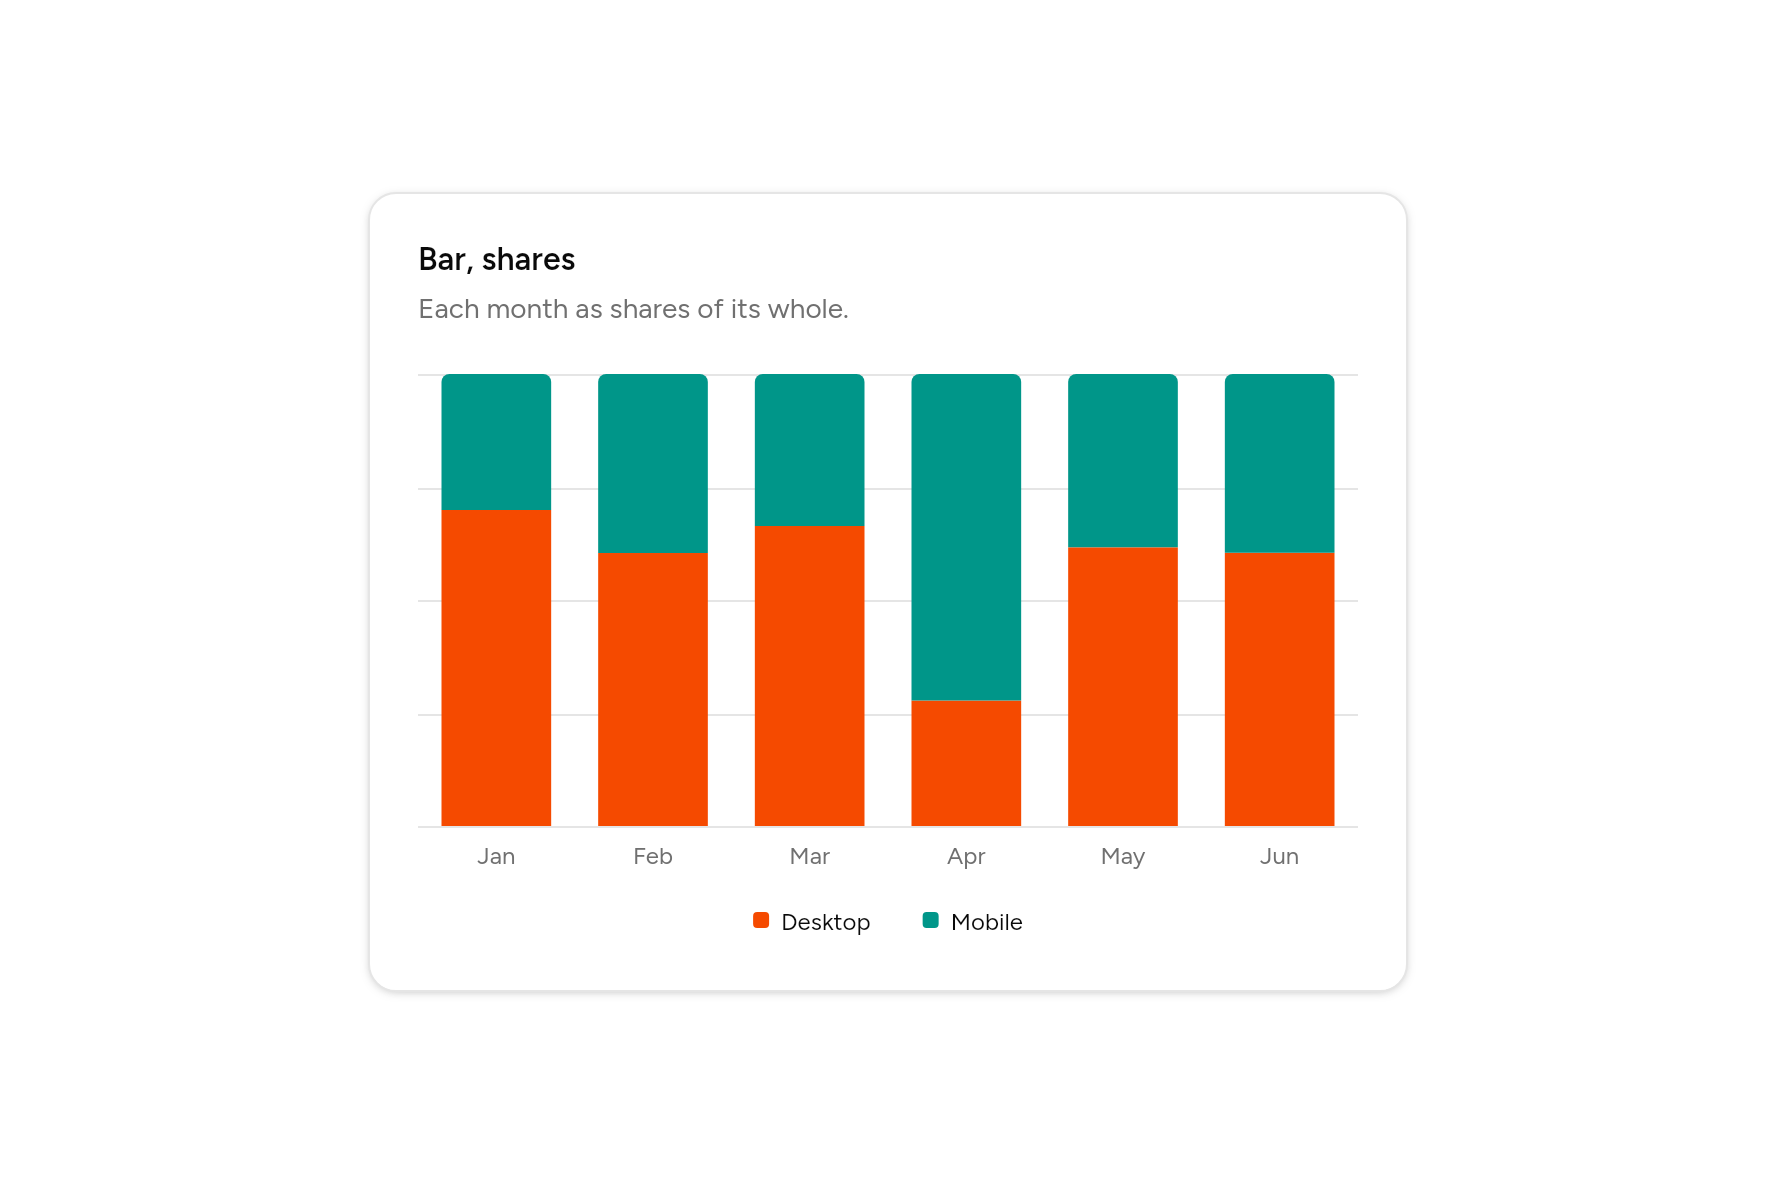
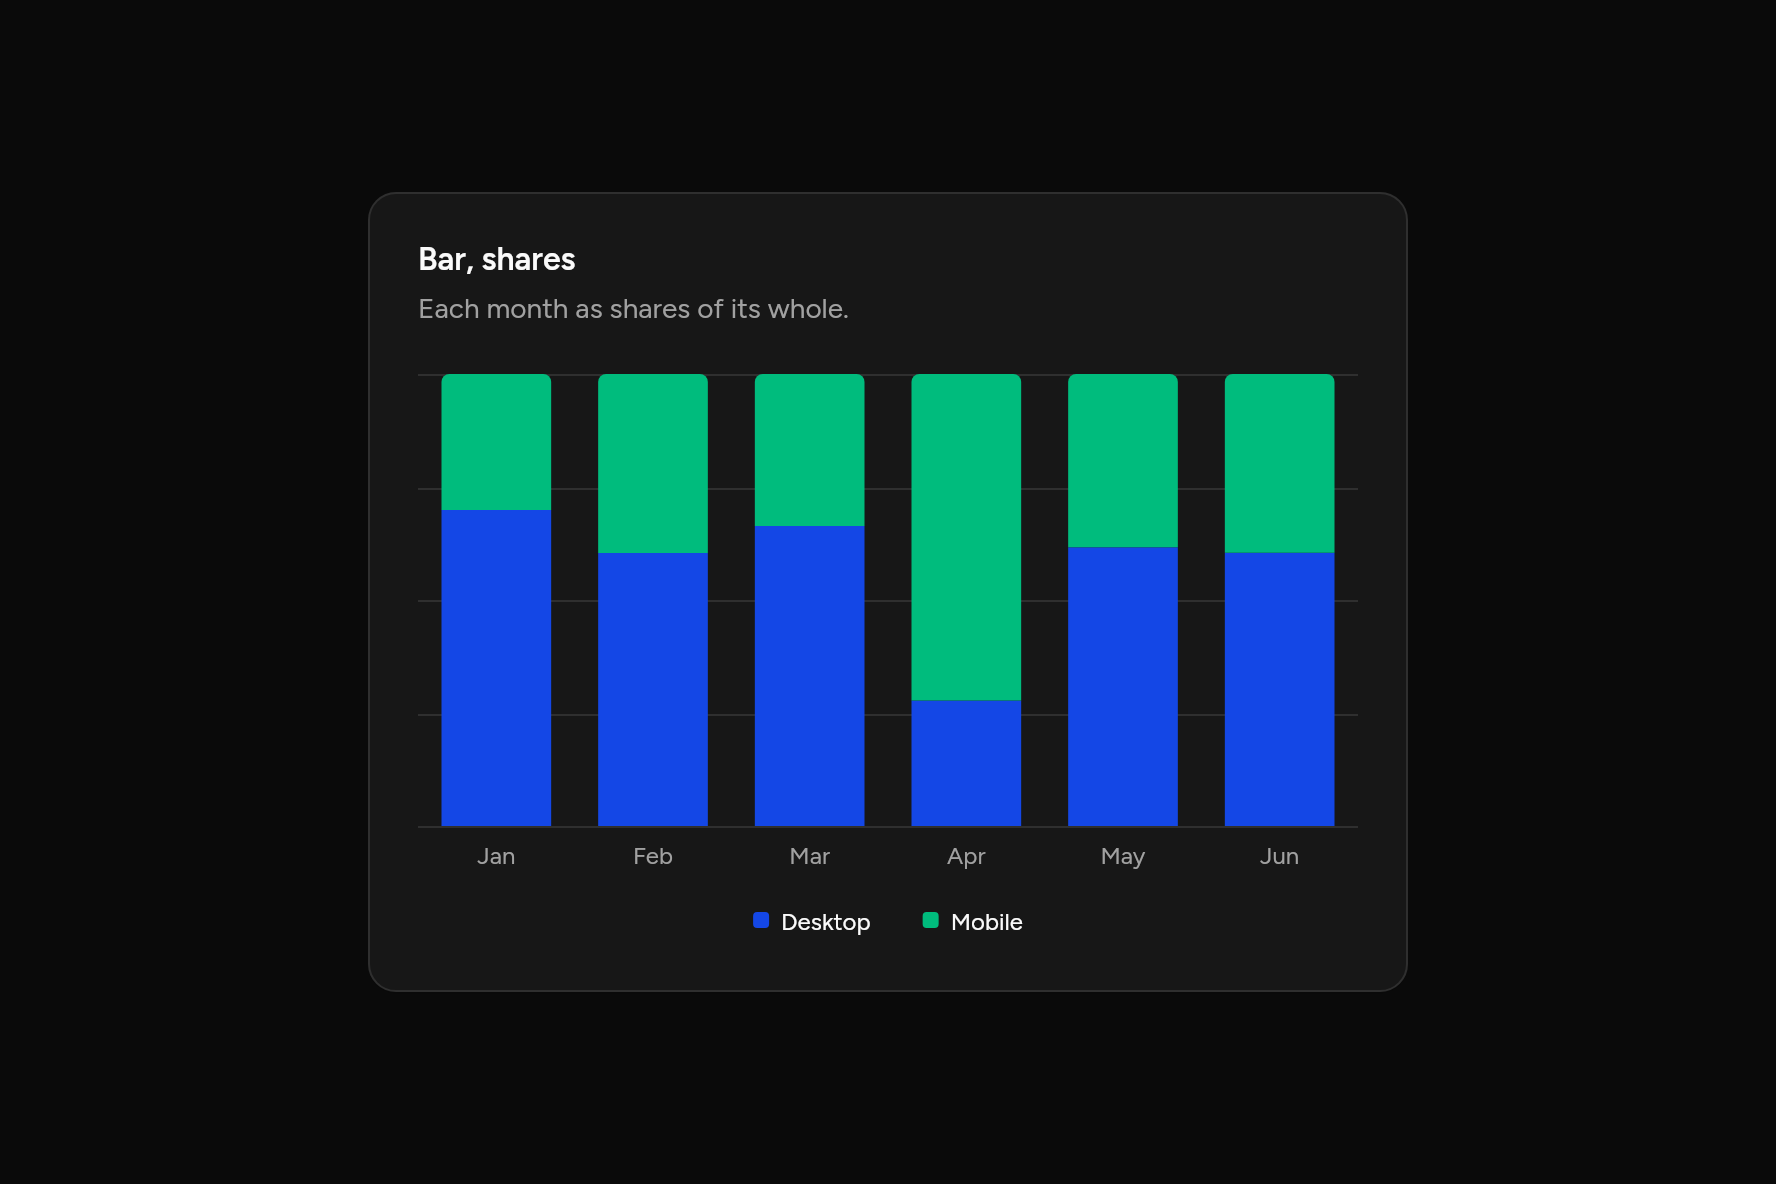
Bar, shares
Each month as shares of its whole.
Code
// Bar, shares: Each month as shares of its whole. Sample data.
import 'package:flutter/widgets.dart';

import 'ui/card.dart';
import 'ui/chart.dart';

class BarExpandedChart extends StatelessWidget {
  const BarExpandedChart({super.key});

  @override
  Widget build(BuildContext context) => SizedBox(
    width: 520,
    child: Card(
      children: [
        const CardHeader(
          title: Text("Bar, shares"),
          description: Text("Each month as shares of its whole."),
        ),
        CardContent(
          child: BarChart(
            labels: ['Jan', 'Feb', 'Mar', 'Apr', 'May', 'Jun'],
            series: const [
              ChartSeries('Desktop', [186, 305, 237, 73, 209, 214]),
              ChartSeries('Mobile', [80, 200, 120, 190, 130, 140]),
            ],
            expand: true,
          ),
        ),
      ],
    ),
  );
}
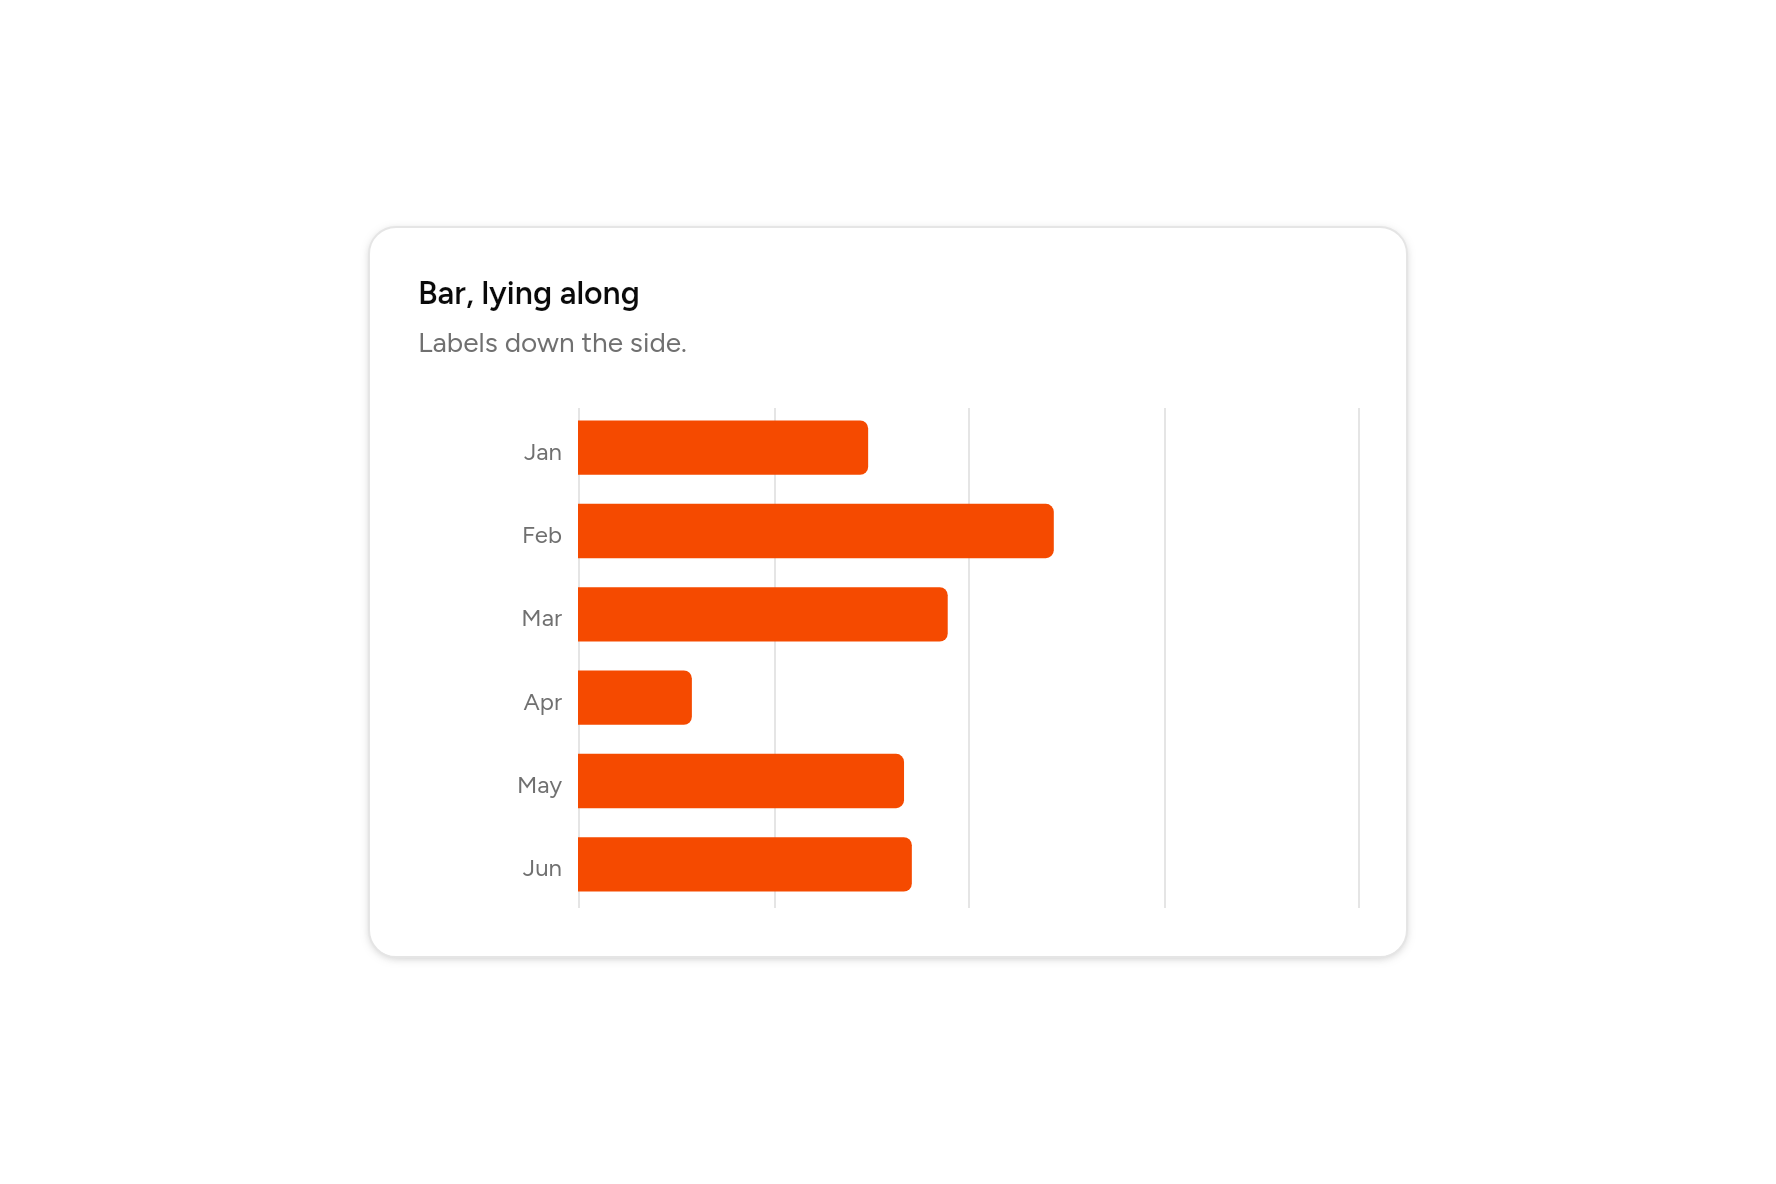
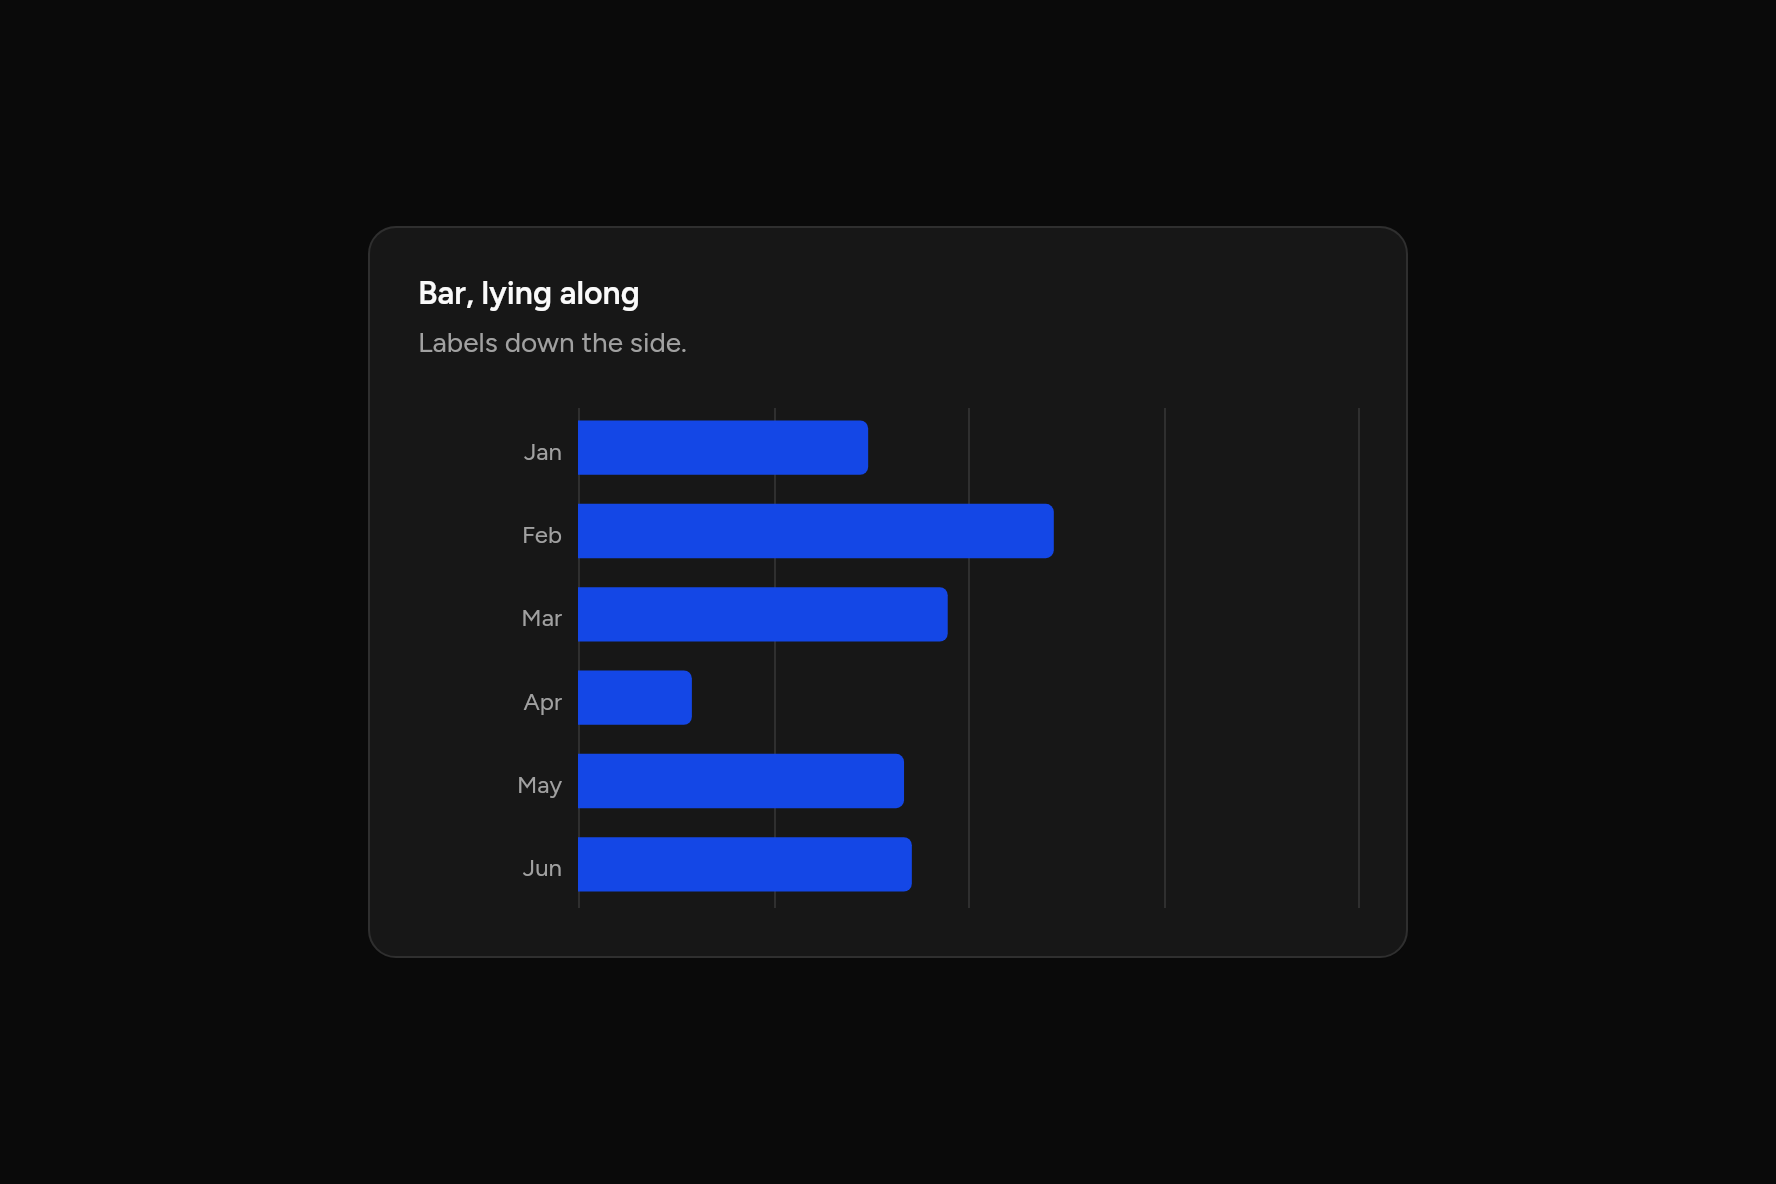
Bar, lying along
Labels down the side.
Code
// Bar, lying along: Labels down the side. Sample data.
import 'package:flutter/widgets.dart';

import 'ui/card.dart';
import 'ui/chart.dart';

class BarHorizontalChart extends StatelessWidget {
  const BarHorizontalChart({super.key});

  @override
  Widget build(BuildContext context) => SizedBox(
    width: 520,
    child: Card(
      children: [
        const CardHeader(
          title: Text("Bar, lying along"),
          description: Text("Labels down the side."),
        ),
        CardContent(
          child: BarChart(
            labels: ['Jan', 'Feb', 'Mar', 'Apr', 'May', 'Jun'],
            series: const [
              ChartSeries('Desktop', [186, 305, 237, 73, 209, 214]),
            ],
            horizontal: true,
          ),
        ),
      ],
    ),
  );
}
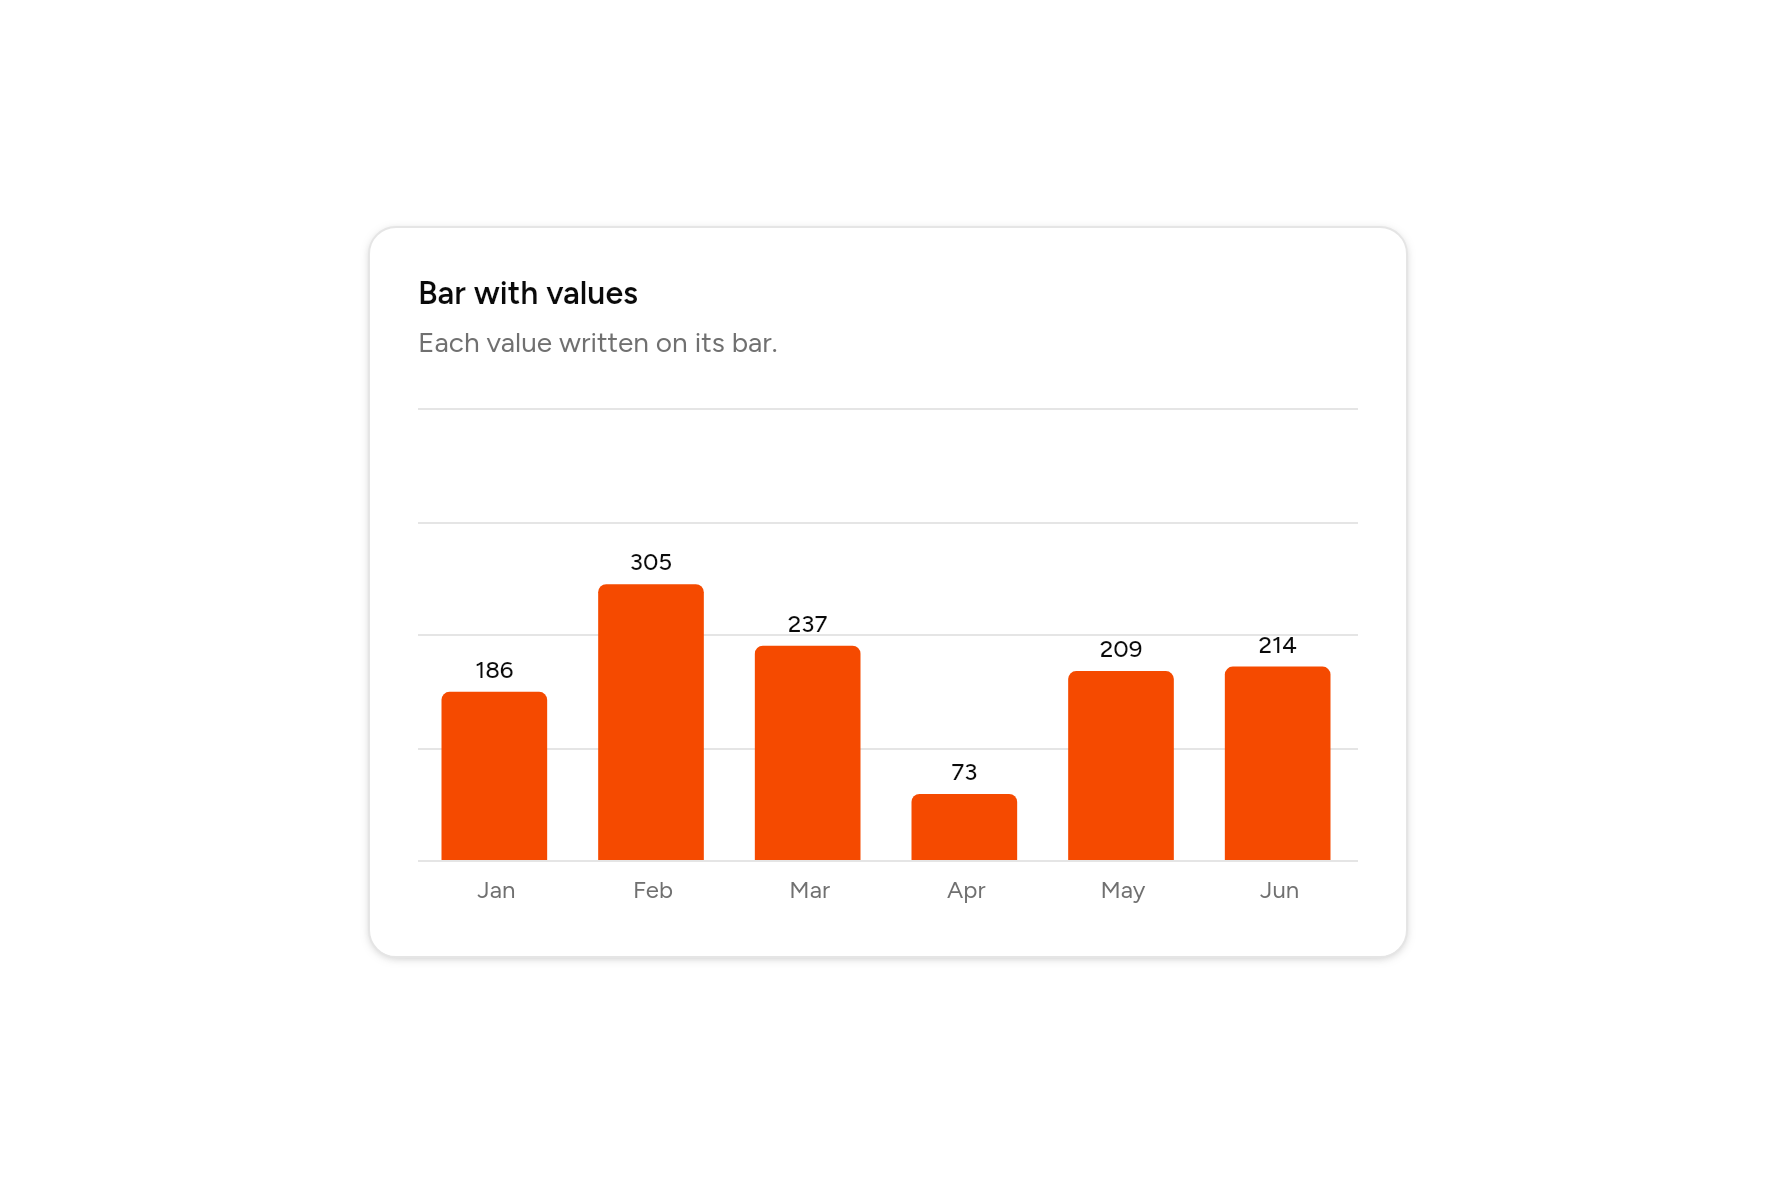
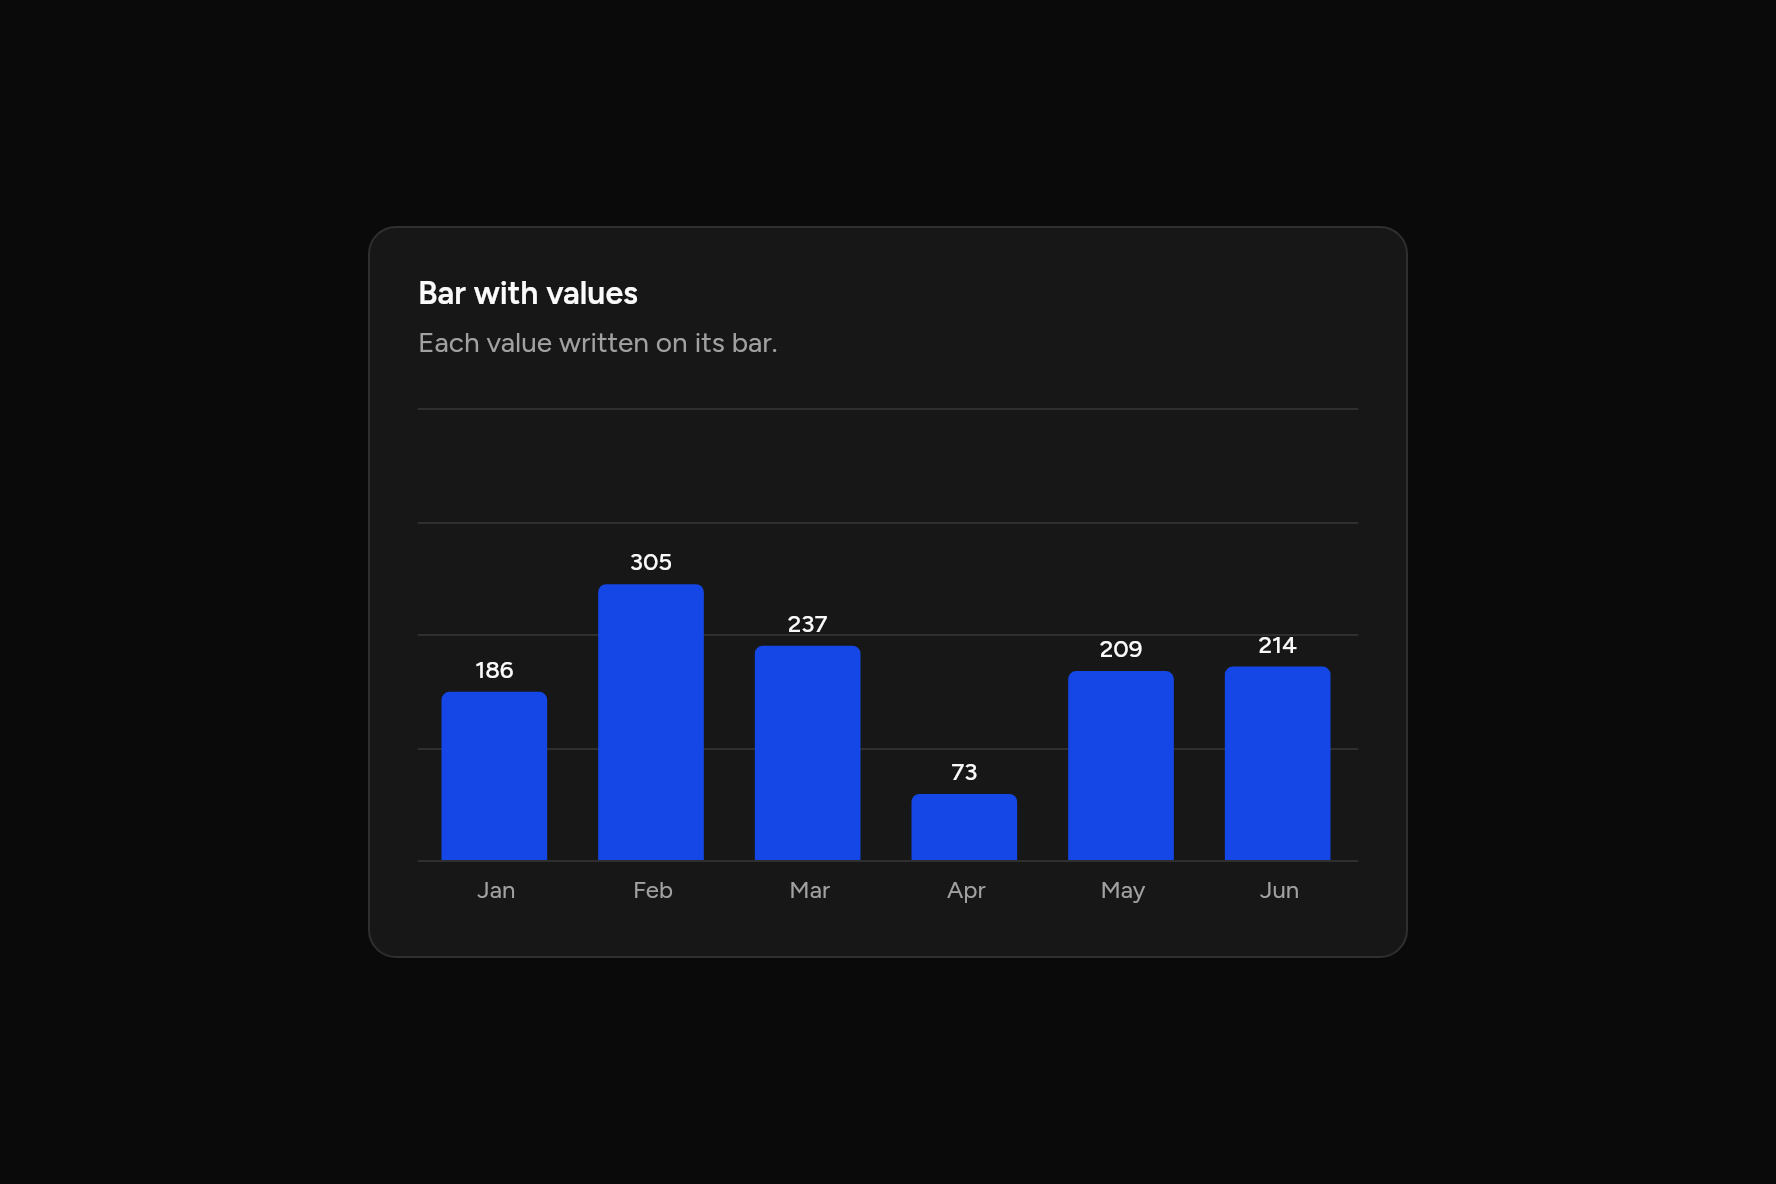
Bar with values
Each value written on its bar.
Code
// Bar with values: Each value written on its bar. Sample data.
import 'package:flutter/widgets.dart';

import 'ui/card.dart';
import 'ui/chart.dart';

class BarLabelChart extends StatelessWidget {
  const BarLabelChart({super.key});

  @override
  Widget build(BuildContext context) => SizedBox(
    width: 520,
    child: Card(
      children: [
        const CardHeader(
          title: Text("Bar with values"),
          description: Text("Each value written on its bar."),
        ),
        CardContent(
          child: BarChart(
            labels: ['Jan', 'Feb', 'Mar', 'Apr', 'May', 'Jun'],
            series: const [
              ChartSeries('Desktop', [186, 305, 237, 73, 209, 214]),
            ],
            valueLabels: true,
          ),
        ),
      ],
    ),
  );
}
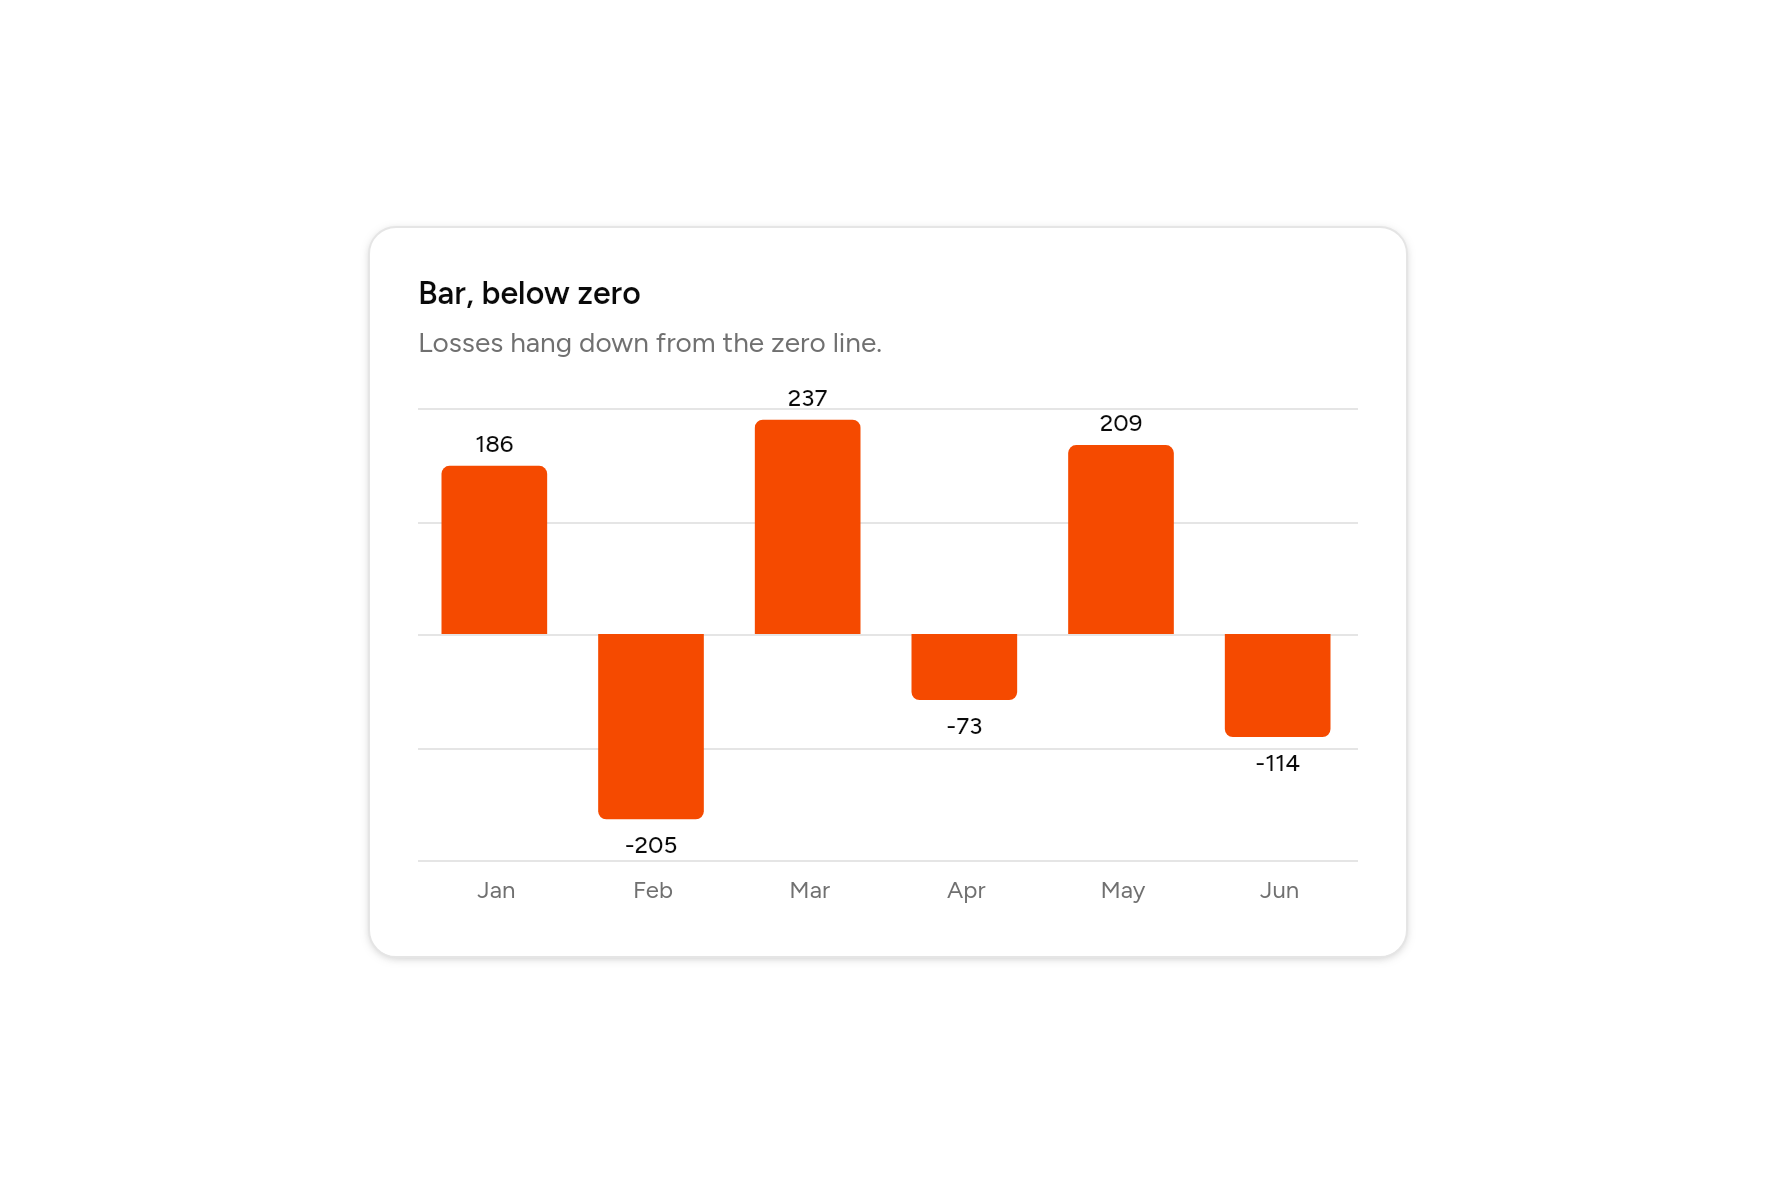
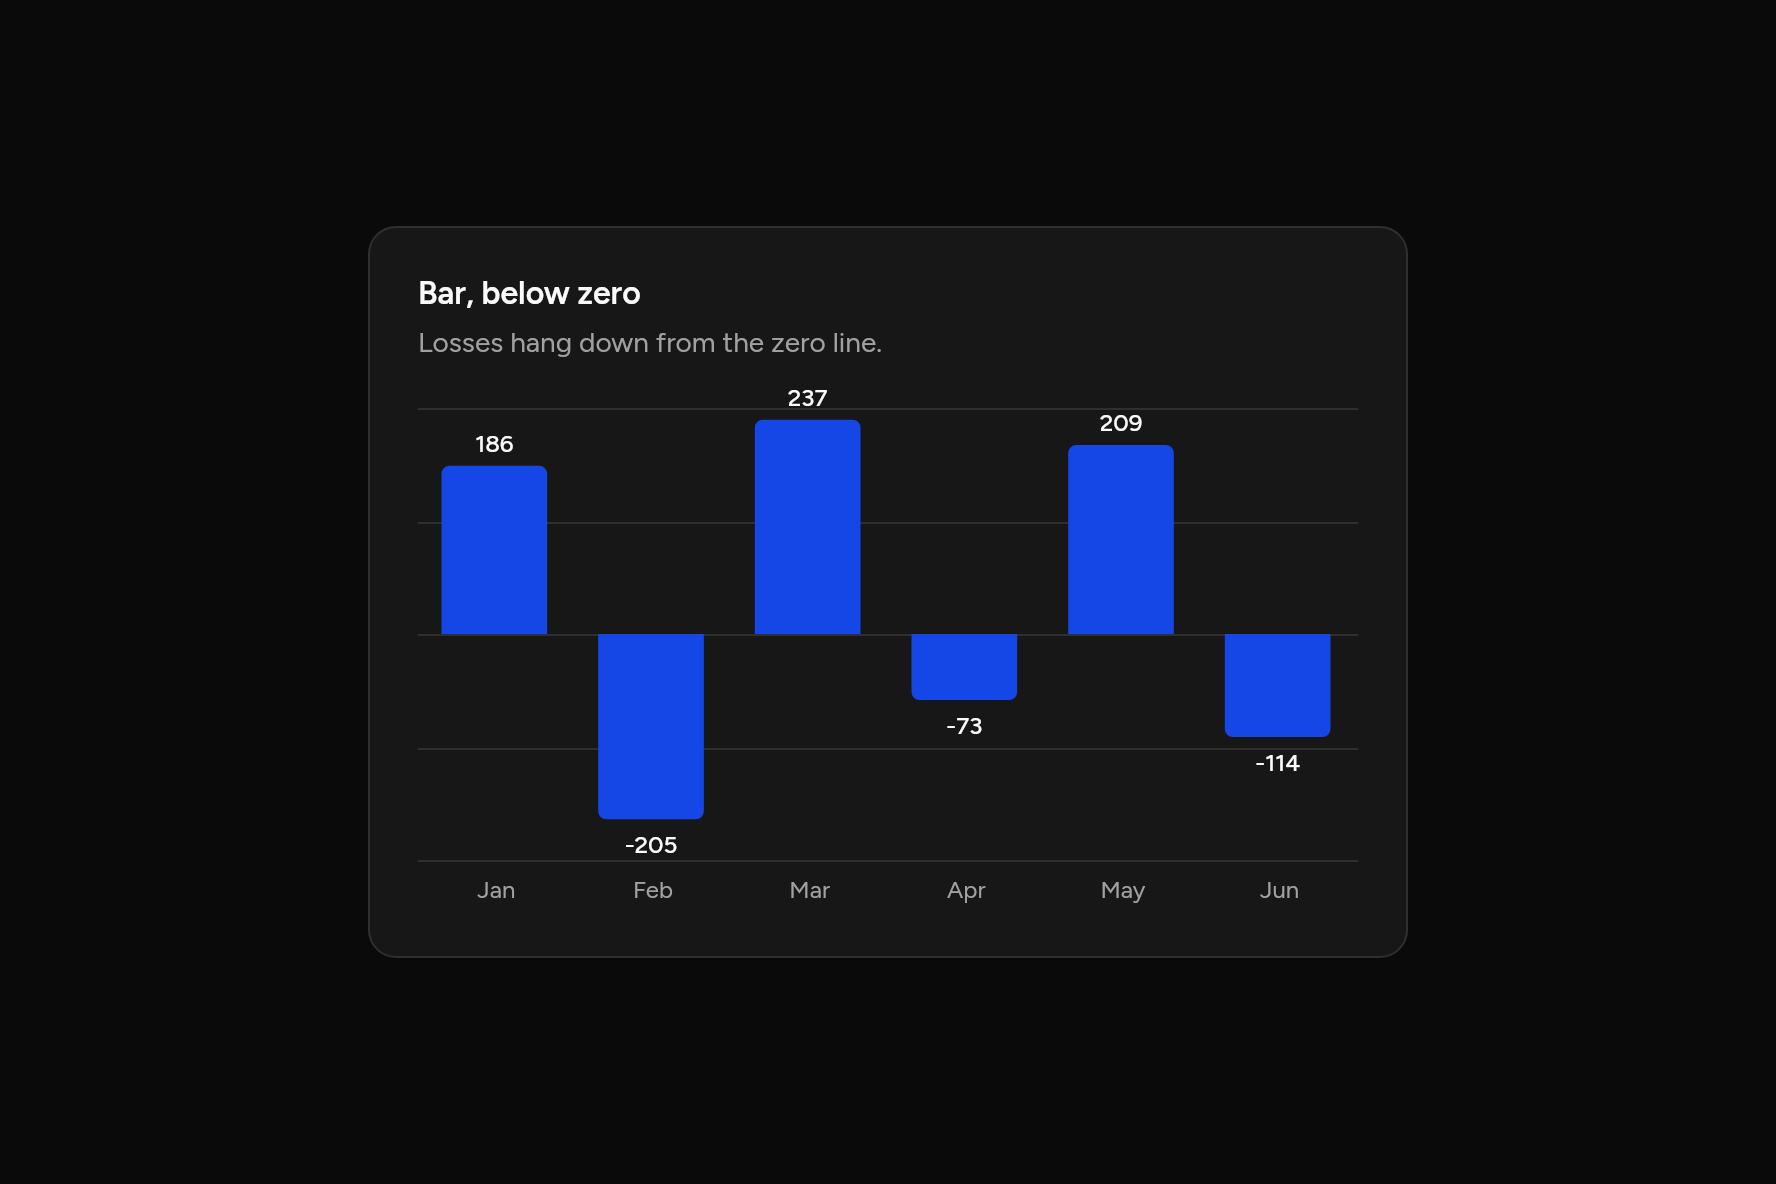
Bar, below zero
Losses hang down from the zero line.
Code
// Bar, below zero: Losses hang down from the zero line. Sample data.
import 'package:flutter/widgets.dart';

import 'ui/card.dart';
import 'ui/chart.dart';

class BarNegativeChart extends StatelessWidget {
  const BarNegativeChart({super.key});

  @override
  Widget build(BuildContext context) => SizedBox(
    width: 520,
    child: Card(
      children: [
        const CardHeader(
          title: Text("Bar, below zero"),
          description: Text("Losses hang down from the zero line."),
        ),
        CardContent(
          child: BarChart(
            labels: ['Jan', 'Feb', 'Mar', 'Apr', 'May', 'Jun'],
            series: const [
              ChartSeries('Change', [186, -205, 237, -73, 209, -114]),
            ],
            valueLabels: true,
          ),
        ),
      ],
    ),
  );
}
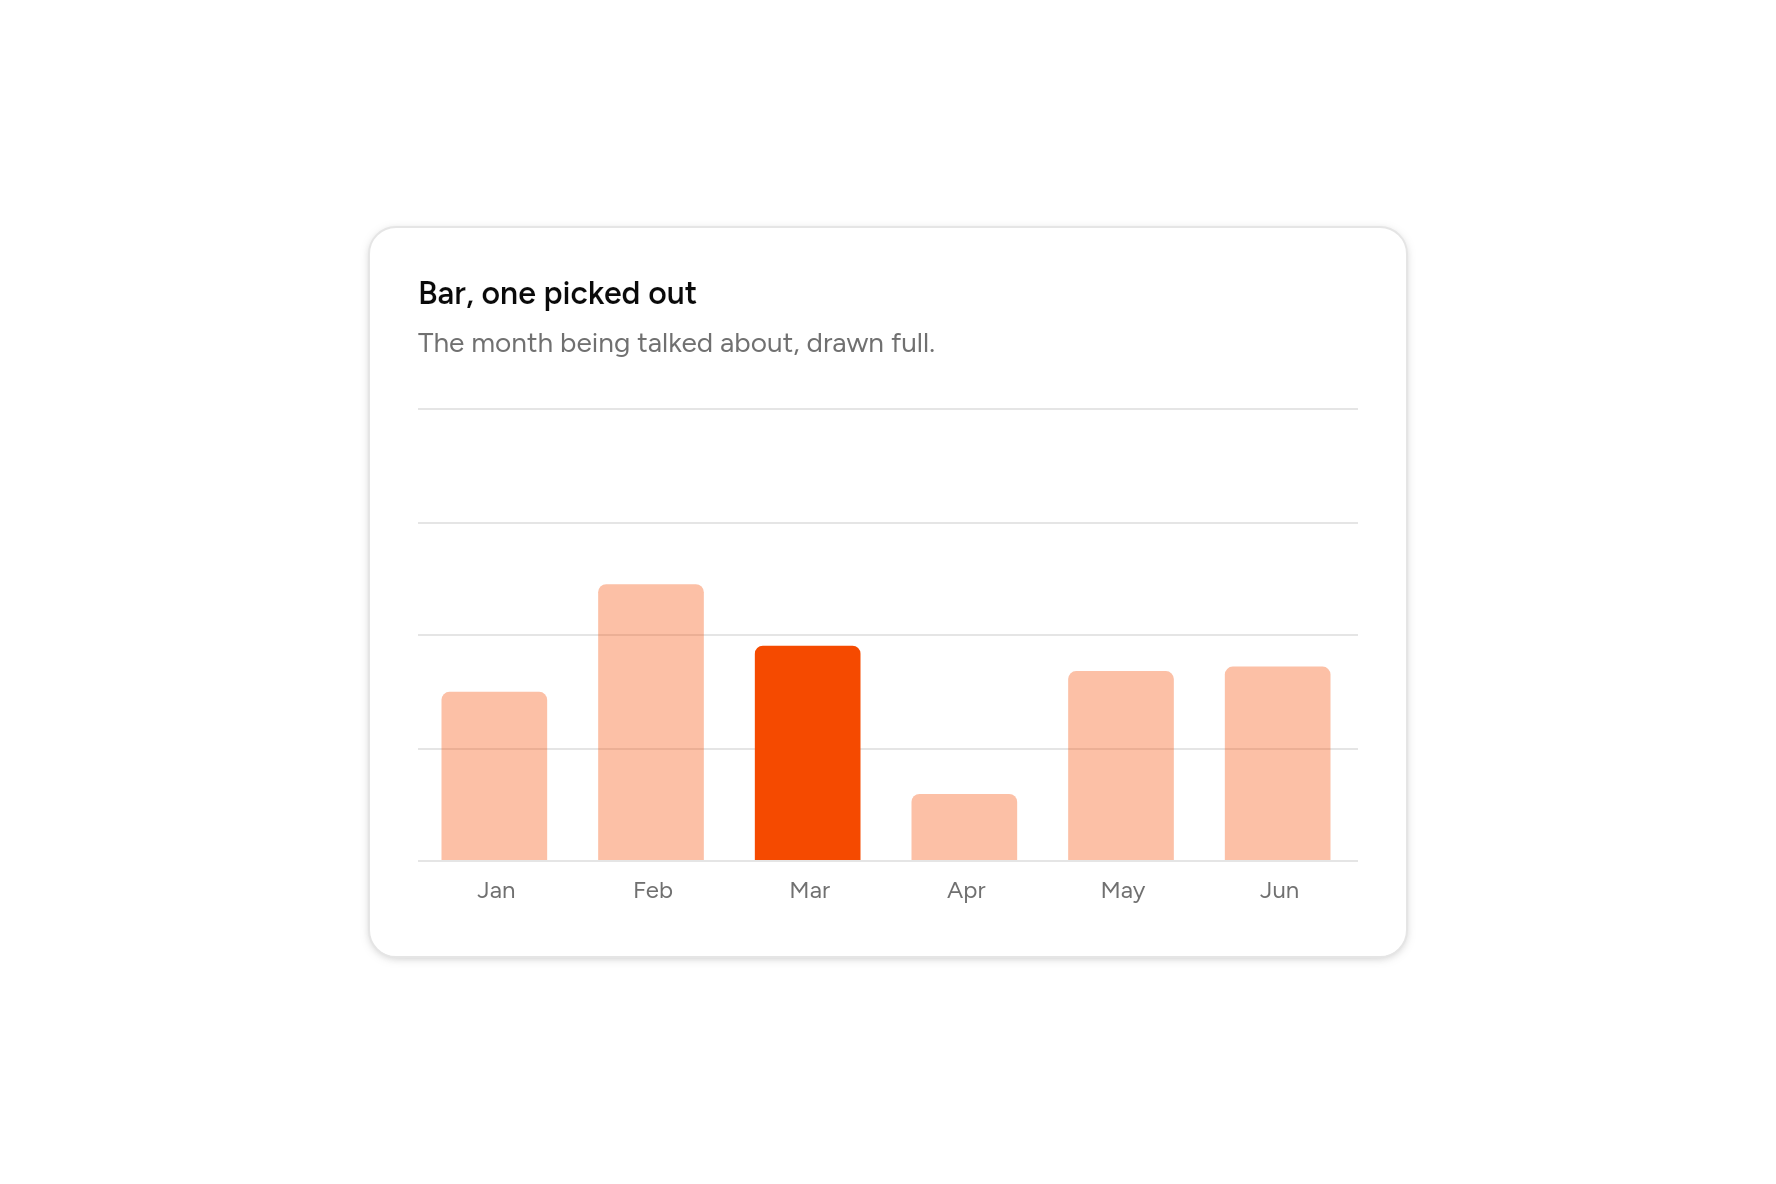
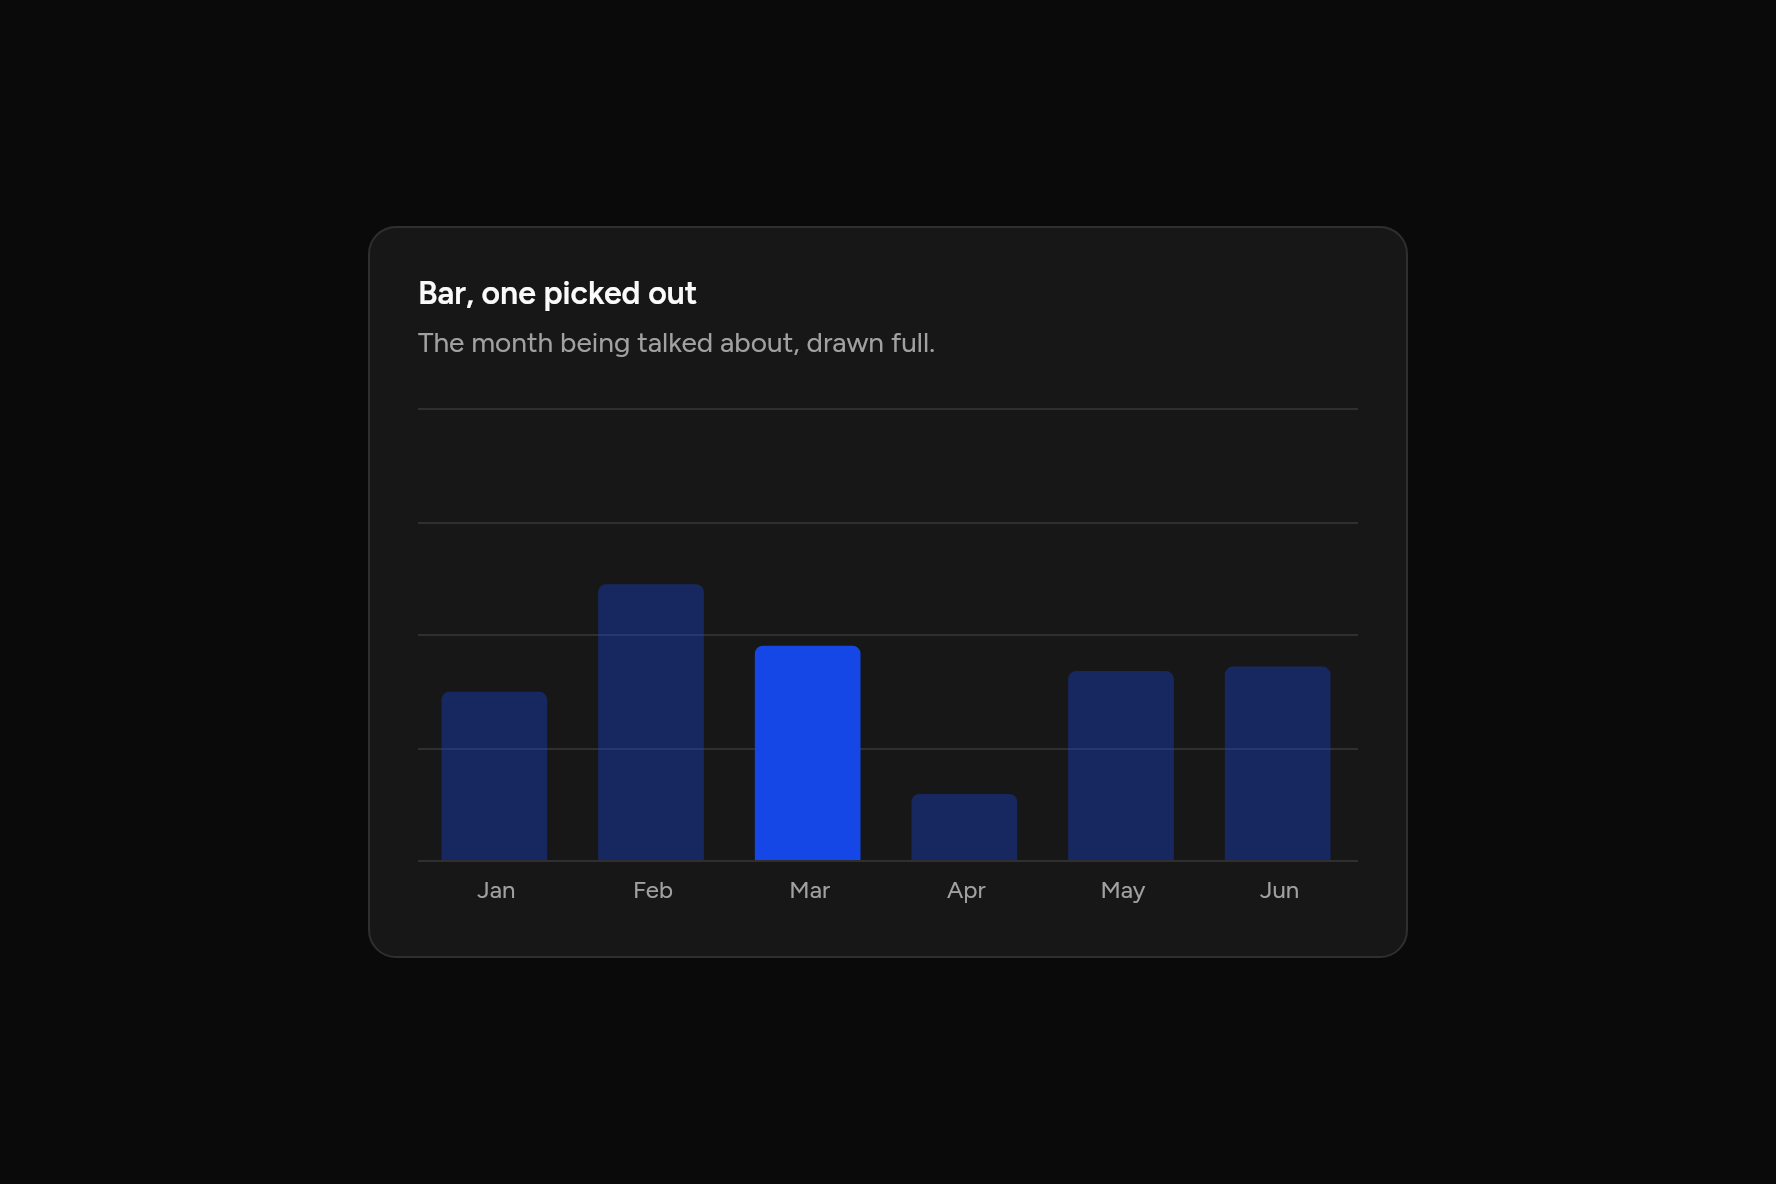
Bar, one picked out
The month being talked about, drawn full.
Code
// Bar, one picked out: The month being talked about, drawn full. Sample data.
import 'package:flutter/widgets.dart';

import 'ui/card.dart';
import 'ui/chart.dart';

class BarActiveChart extends StatelessWidget {
  const BarActiveChart({super.key});

  @override
  Widget build(BuildContext context) => SizedBox(
    width: 520,
    child: Card(
      children: [
        const CardHeader(
          title: Text("Bar, one picked out"),
          description: Text("The month being talked about, drawn full."),
        ),
        CardContent(
          child: BarChart(
            labels: ['Jan', 'Feb', 'Mar', 'Apr', 'May', 'Jun'],
            series: const [
              ChartSeries('Desktop', [186, 305, 237, 73, 209, 214]),
            ],
            active: 2,
          ),
        ),
      ],
    ),
  );
}
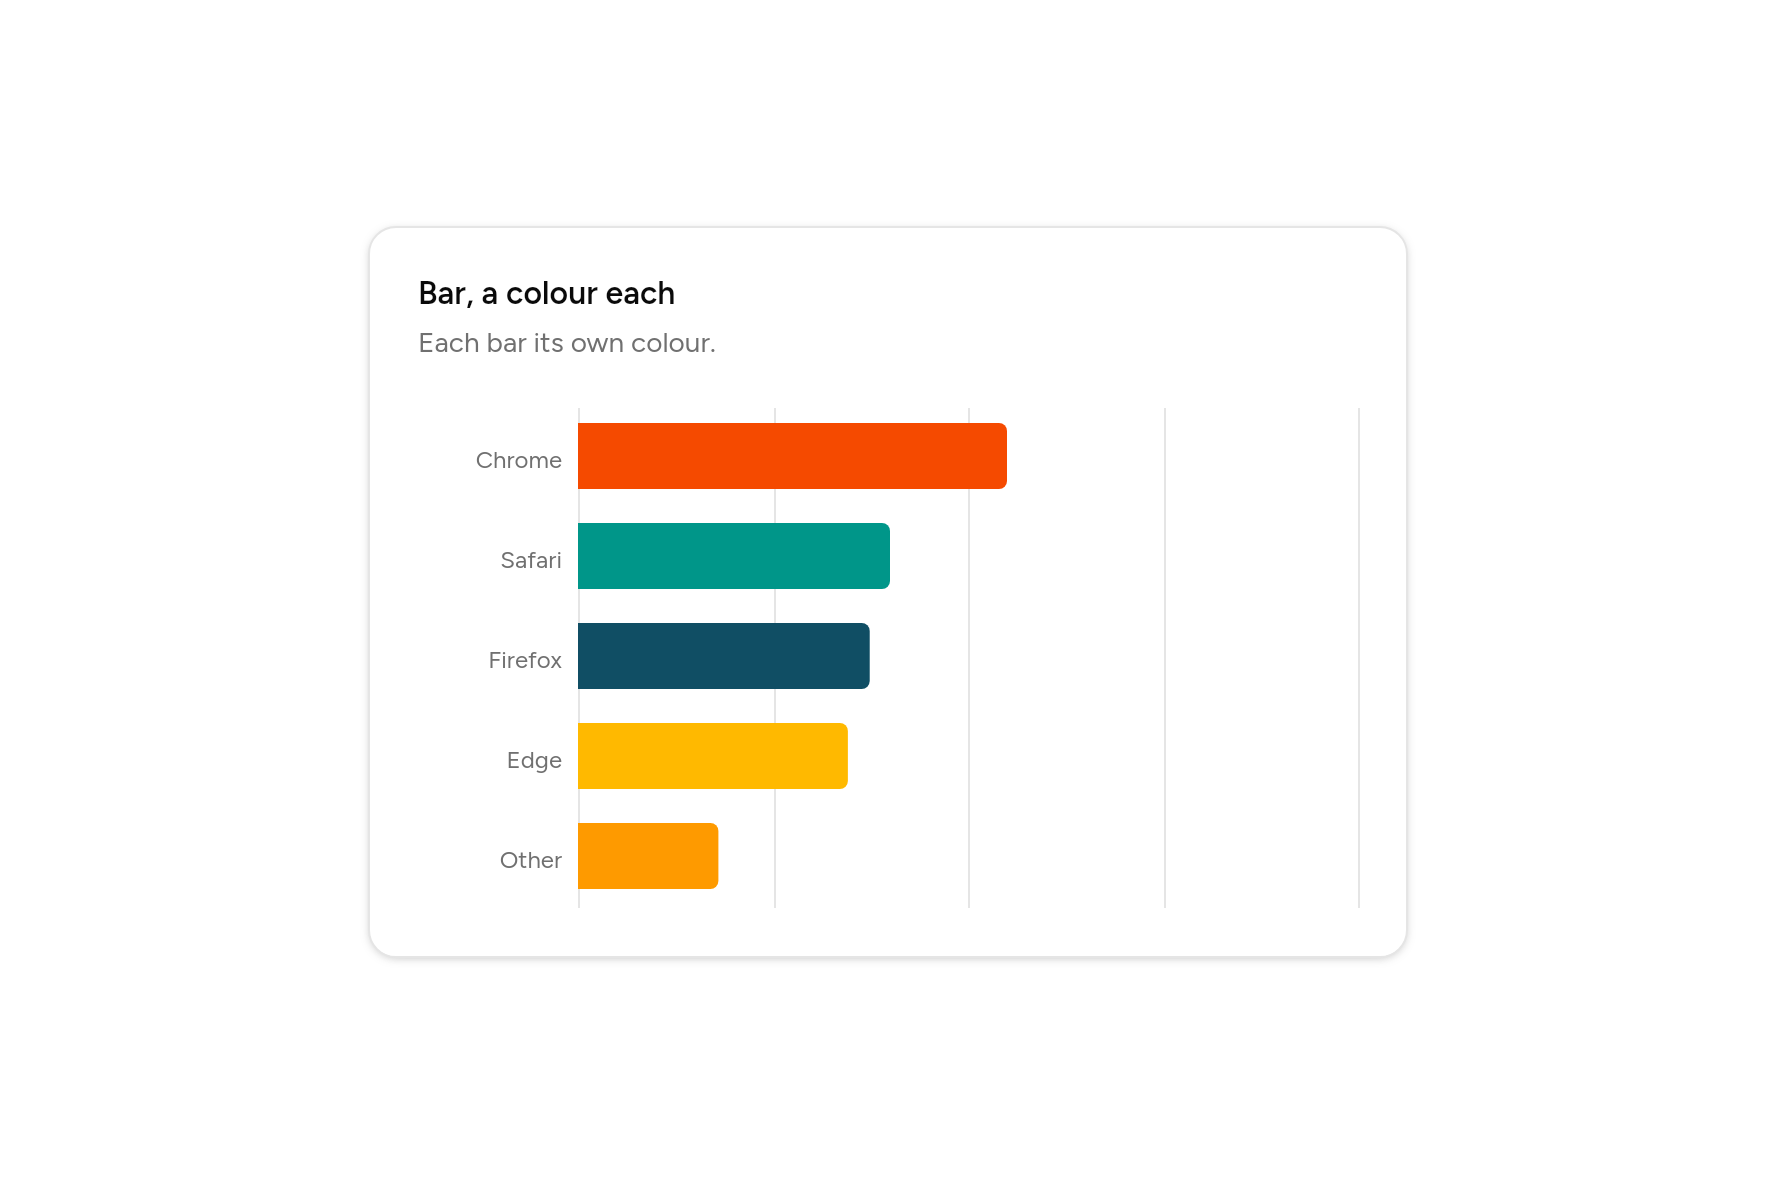
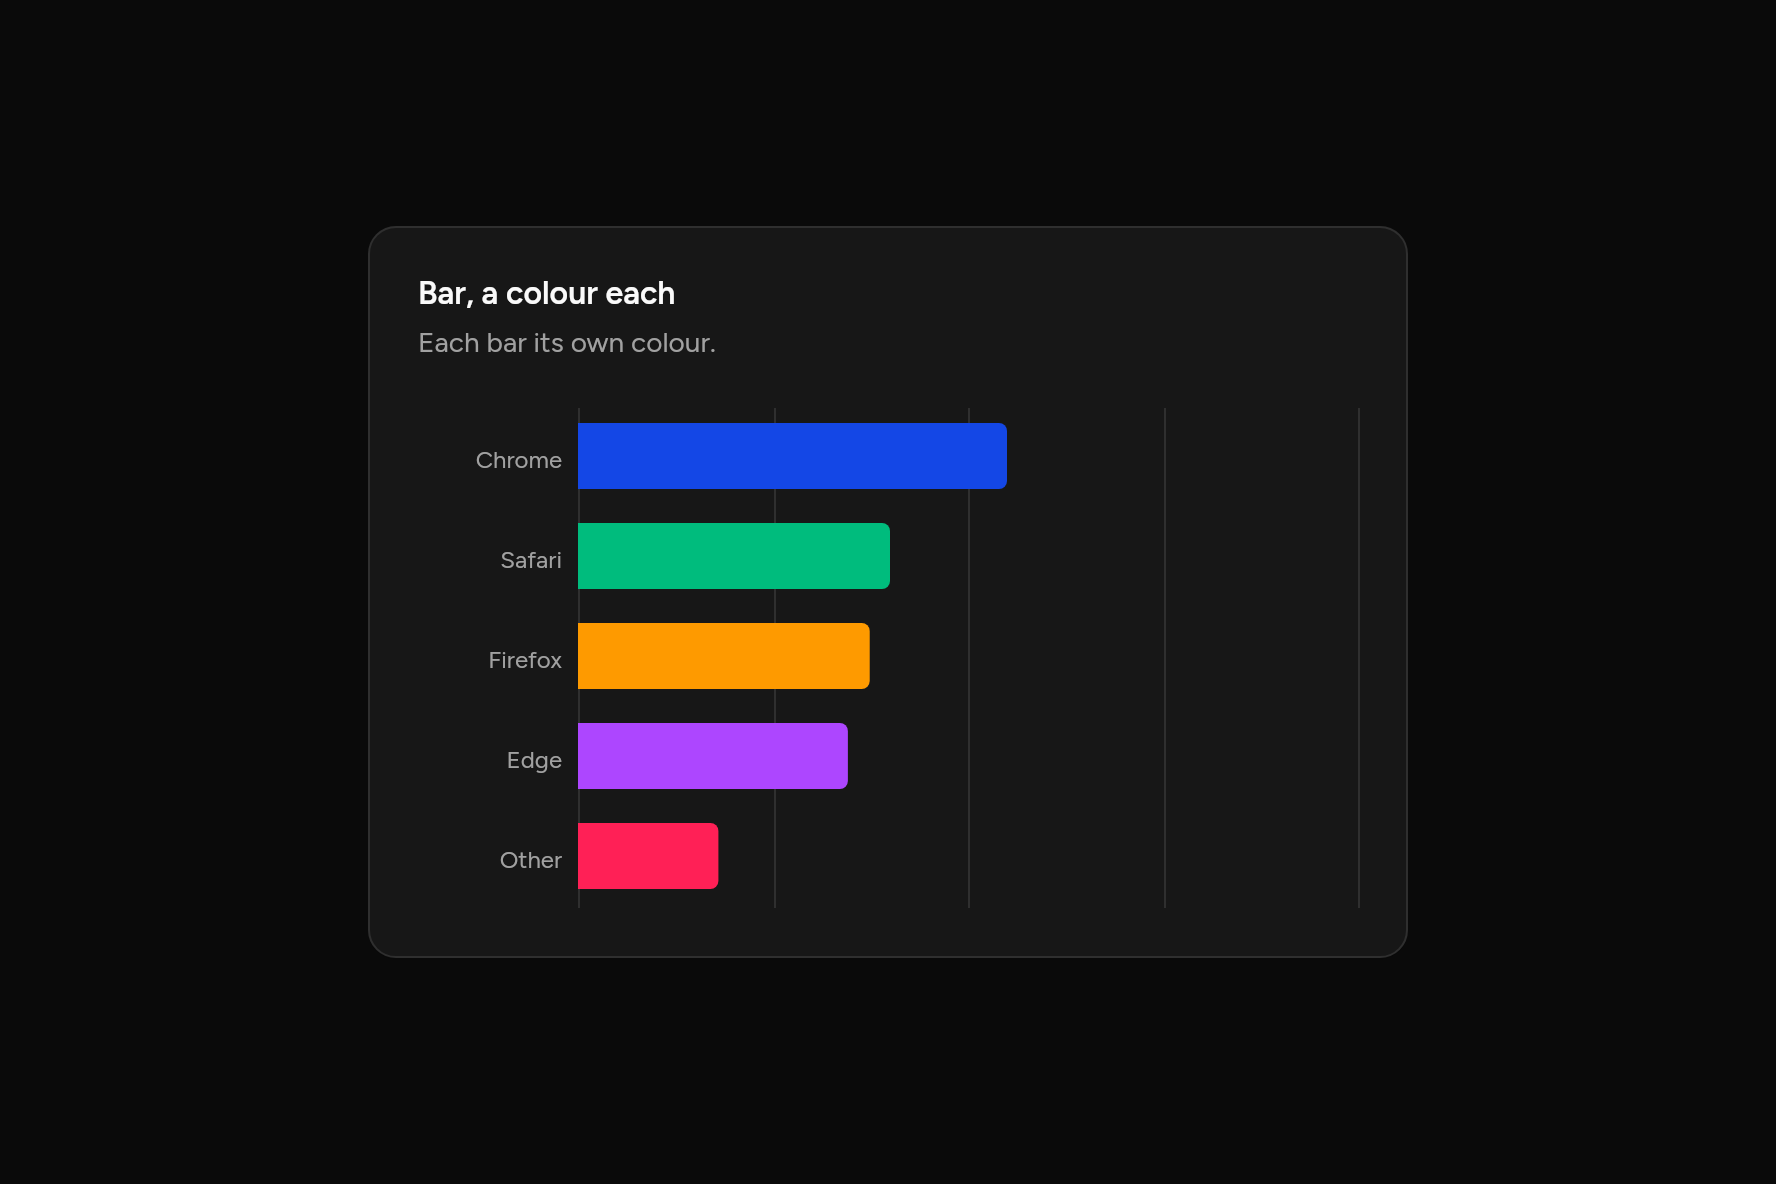
Bar, a colour each
Each bar its own colour.
Code
// Bar, a colour each: Each bar its own colour. Sample data.
import 'package:flutter/widgets.dart';

import 'ui/card.dart';
import 'ui/chart.dart';
import 'ui/theme.dart';

class BarMixedChart extends StatelessWidget {
  const BarMixedChart({super.key});

  @override
  Widget build(BuildContext context) => SizedBox(
    width: 520,
    child: Card(
      children: [
        const CardHeader(
          title: Text("Bar, a colour each"),
          description: Text("Each bar its own colour."),
        ),
        CardContent(
          child: Builder(
            builder: (context) {
              final c = AshlarTheme.of(context).colors;
              return BarChart(
                labels: const ['Chrome', 'Safari', 'Firefox', 'Edge', 'Other'],
                horizontal: true,
                series: [
                  ChartSeries('Visitors', const [275, 200, 187, 173, 90], colors: c.charts),
                ],
              );
            },
          ),
        ),
      ],
    ),
  );
}
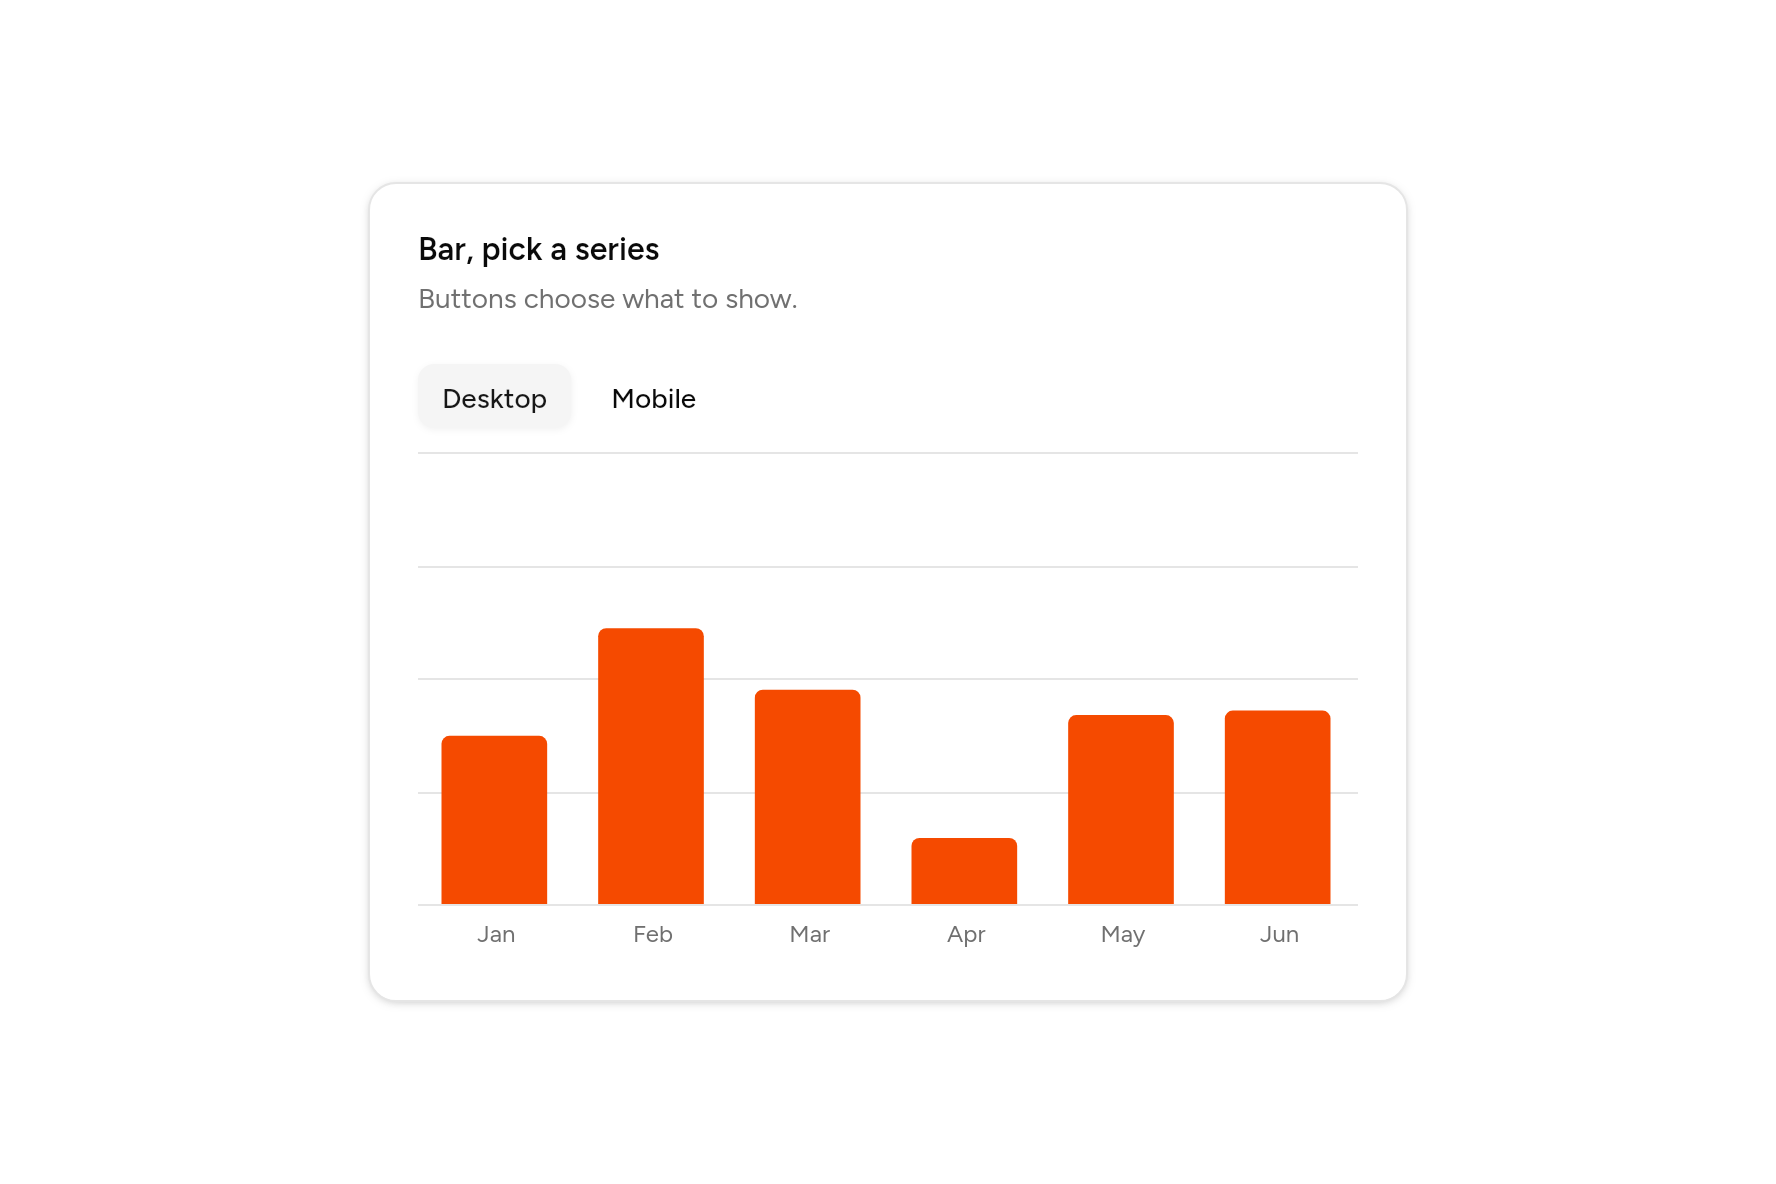
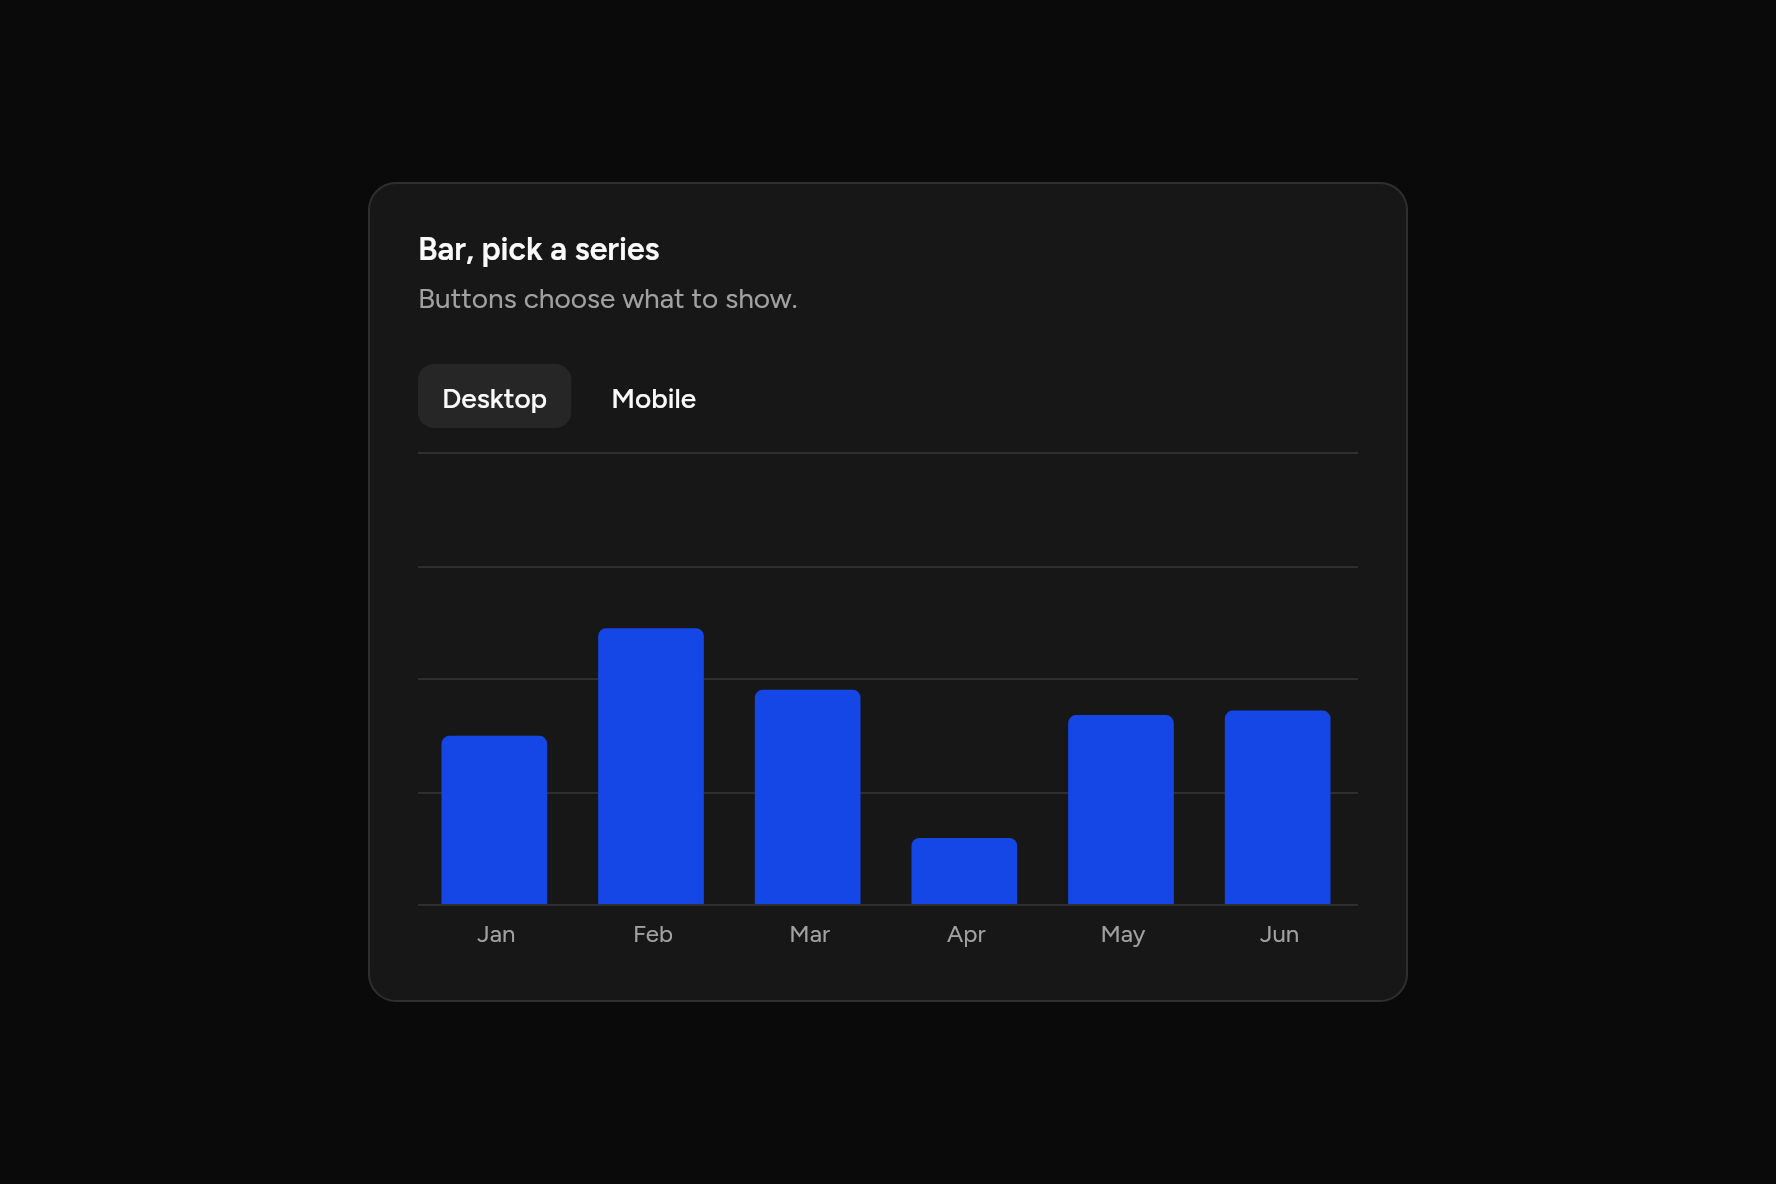
Bar, pick a series
Buttons choose what to show.
Code
// Bar, pick a series: Buttons choose what to show. Sample data.
import 'package:flutter/widgets.dart';

import 'ui/button.dart';
import 'ui/card.dart';
import 'ui/chart.dart';

class BarInteractiveChart extends StatefulWidget {
  const BarInteractiveChart({super.key});

  @override
  State<BarInteractiveChart> createState() => _BarInteractiveChartState();
}

class _BarInteractiveChartState extends State<BarInteractiveChart> {
  var shown = 0;

  @override
  Widget build(BuildContext context) => SizedBox(
    width: 520,
    child: Card(
      children: [
        const CardHeader(
          title: Text("Bar, pick a series"),
          description: Text("Buttons choose what to show."),
        ),
        CardContent(
          child: Column(
            mainAxisSize: MainAxisSize.min,
            crossAxisAlignment: CrossAxisAlignment.stretch,
            children: [
              Row(
                children: [
                  for (final (i, name) in ['Desktop', 'Mobile'].indexed)
                    Padding(
                      padding: const EdgeInsetsDirectional.only(end: 8),
                      child: Button(
                        size: ButtonSize.sm,
                        variant: i == shown ? ButtonVariant.secondary : ButtonVariant.ghost,
                        onPressed: () => setState(() => shown = i),
                        child: Text(name),
                      ),
                    ),
                ],
              ),
              const SizedBox(height: 12),
              BarChart(
                labels: ['Jan', 'Feb', 'Mar', 'Apr', 'May', 'Jun'],
                series: [
                  [
                    ChartSeries('Desktop', [186, 305, 237, 73, 209, 214]),
                    ChartSeries('Mobile', [80, 200, 120, 190, 130, 140]),
                  ][shown],
                ],
              ),
            ],
          ),
        ),
      ],
    ),
  );
}
Line
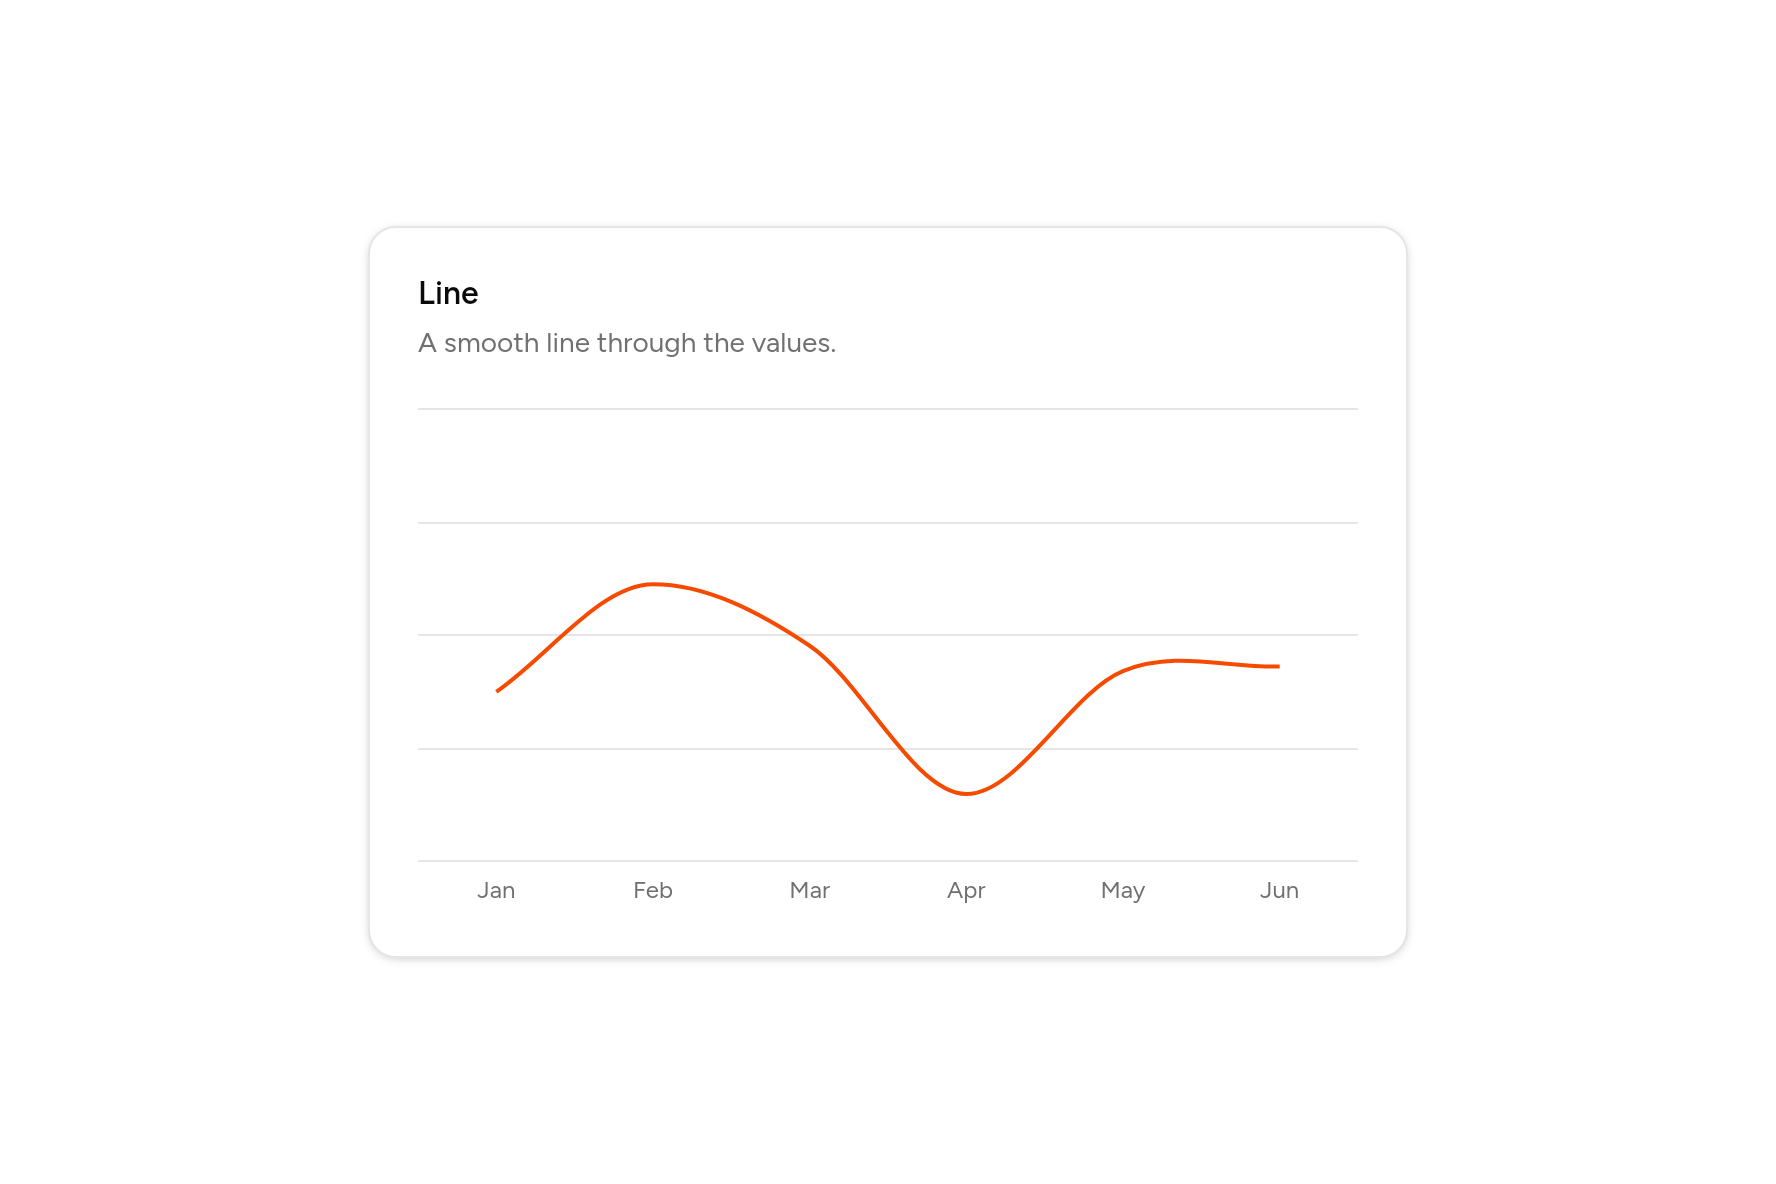
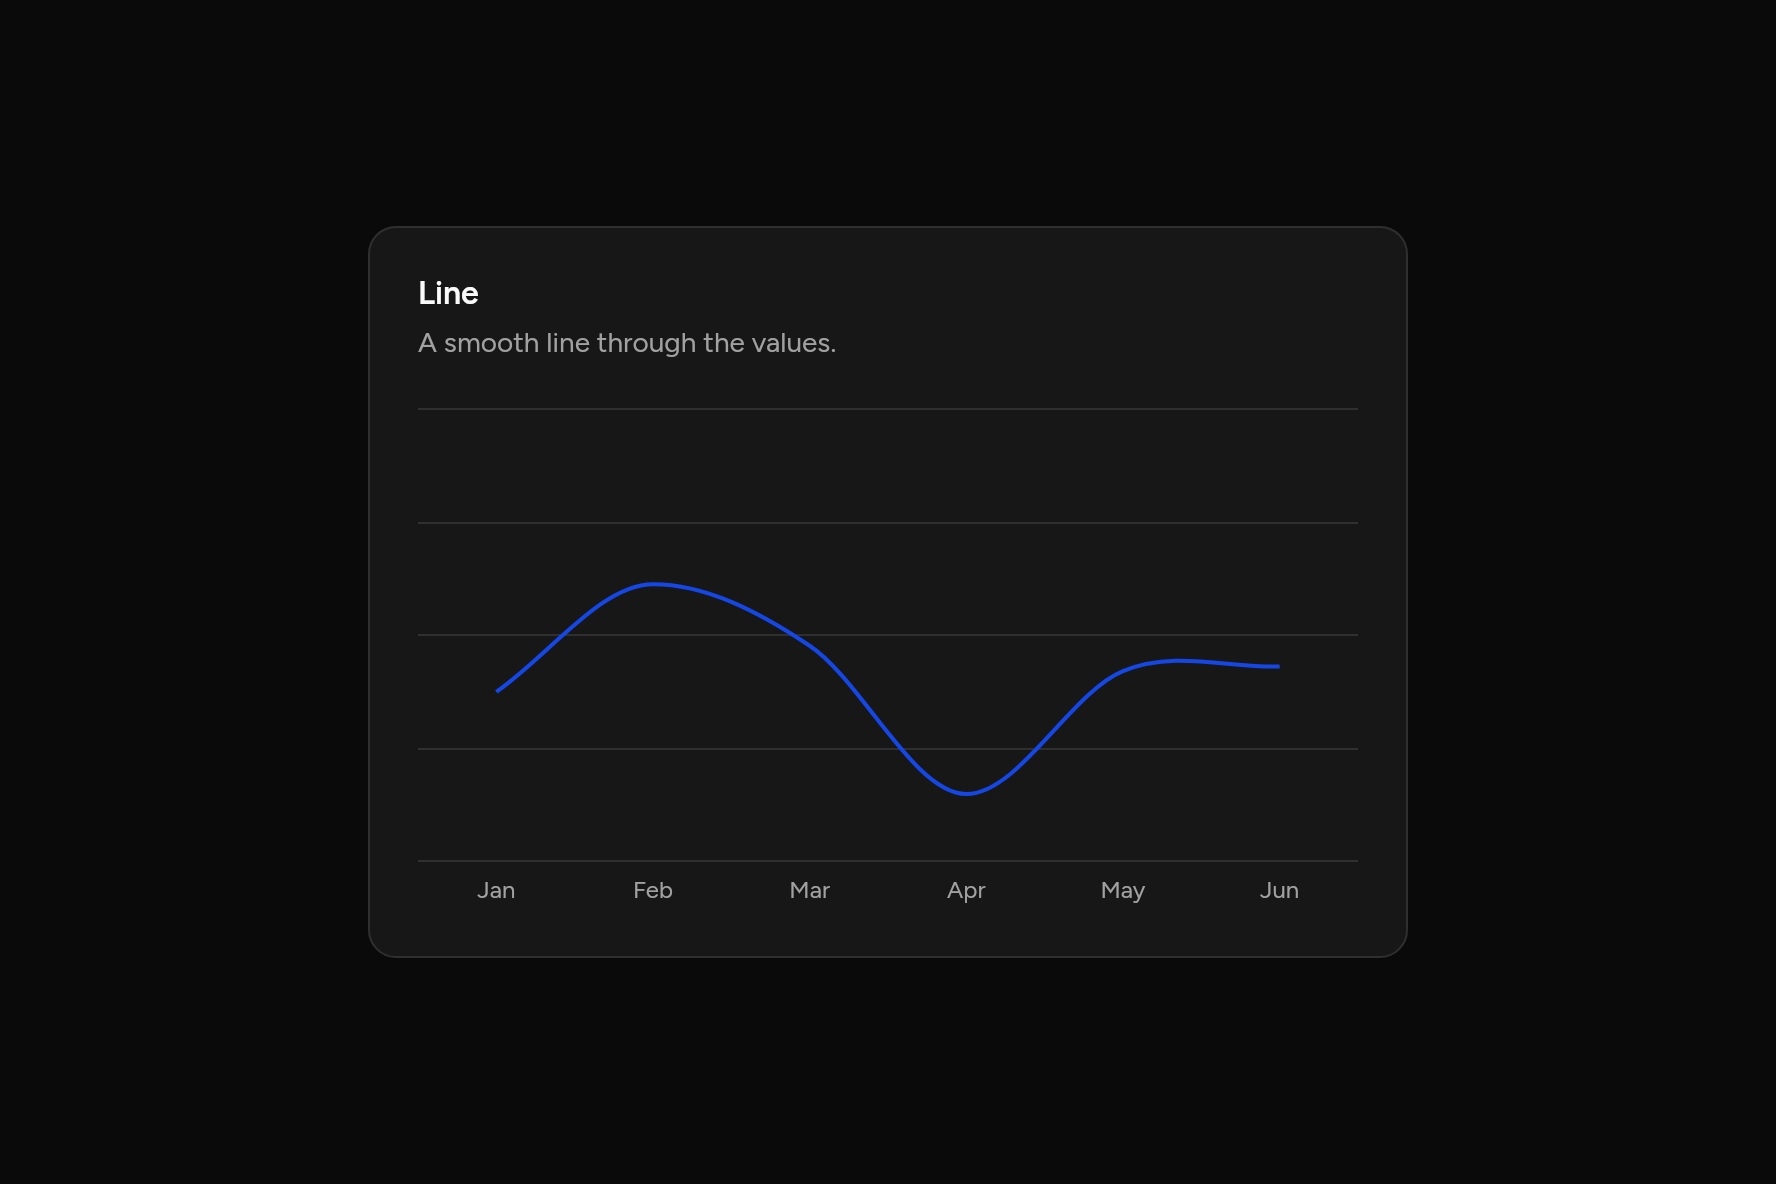
Line
A smooth line through the values.
Code
// Line: A smooth line through the values. Sample data.
import 'package:flutter/widgets.dart';

import 'ui/card.dart';
import 'ui/chart.dart';

class LineDefaultChart extends StatelessWidget {
  const LineDefaultChart({super.key});

  @override
  Widget build(BuildContext context) => SizedBox(
    width: 520,
    child: Card(
      children: [
        const CardHeader(
          title: Text("Line"),
          description: Text("A smooth line through the values."),
        ),
        CardContent(
          child: LineChart(
            labels: ['Jan', 'Feb', 'Mar', 'Apr', 'May', 'Jun'],
            series: const [
              ChartSeries('Desktop', [186, 305, 237, 73, 209, 214]),
            ],
          ),
        ),
      ],
    ),
  );
}
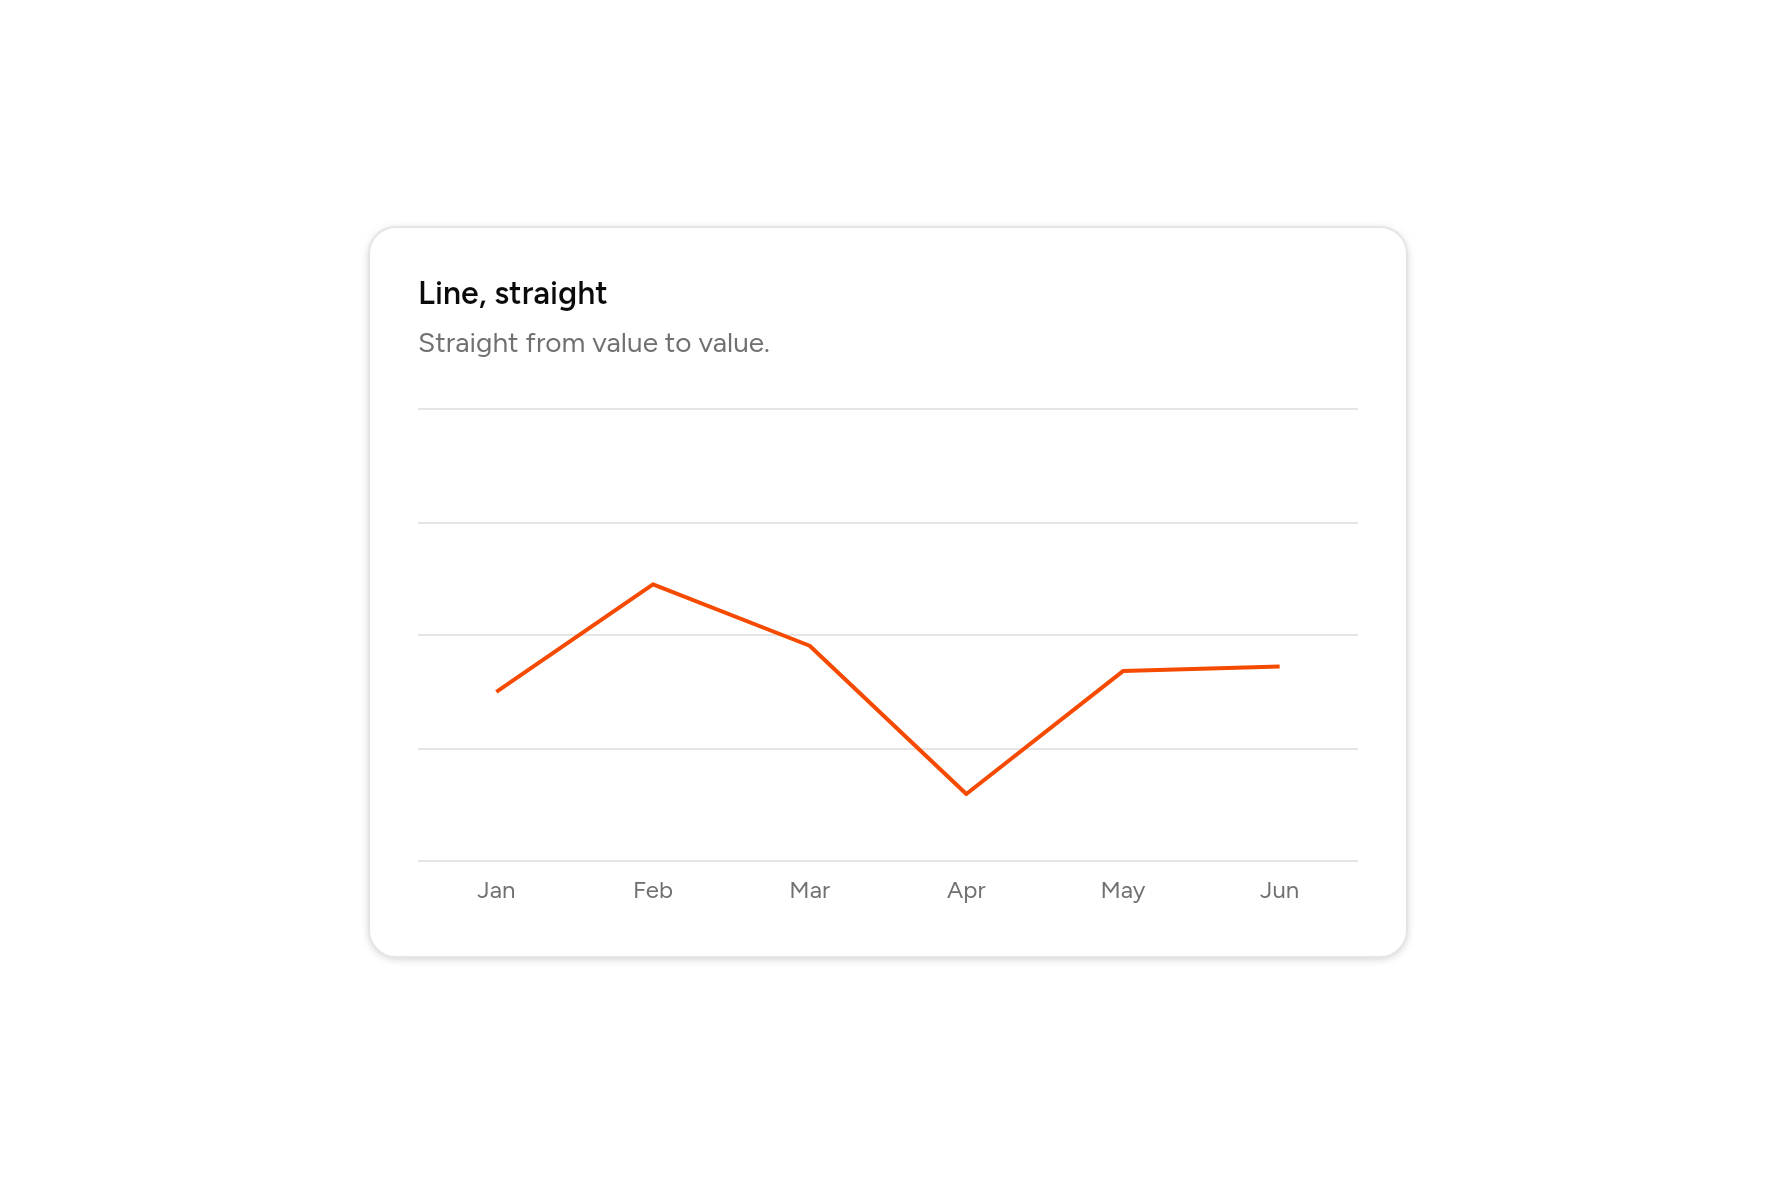
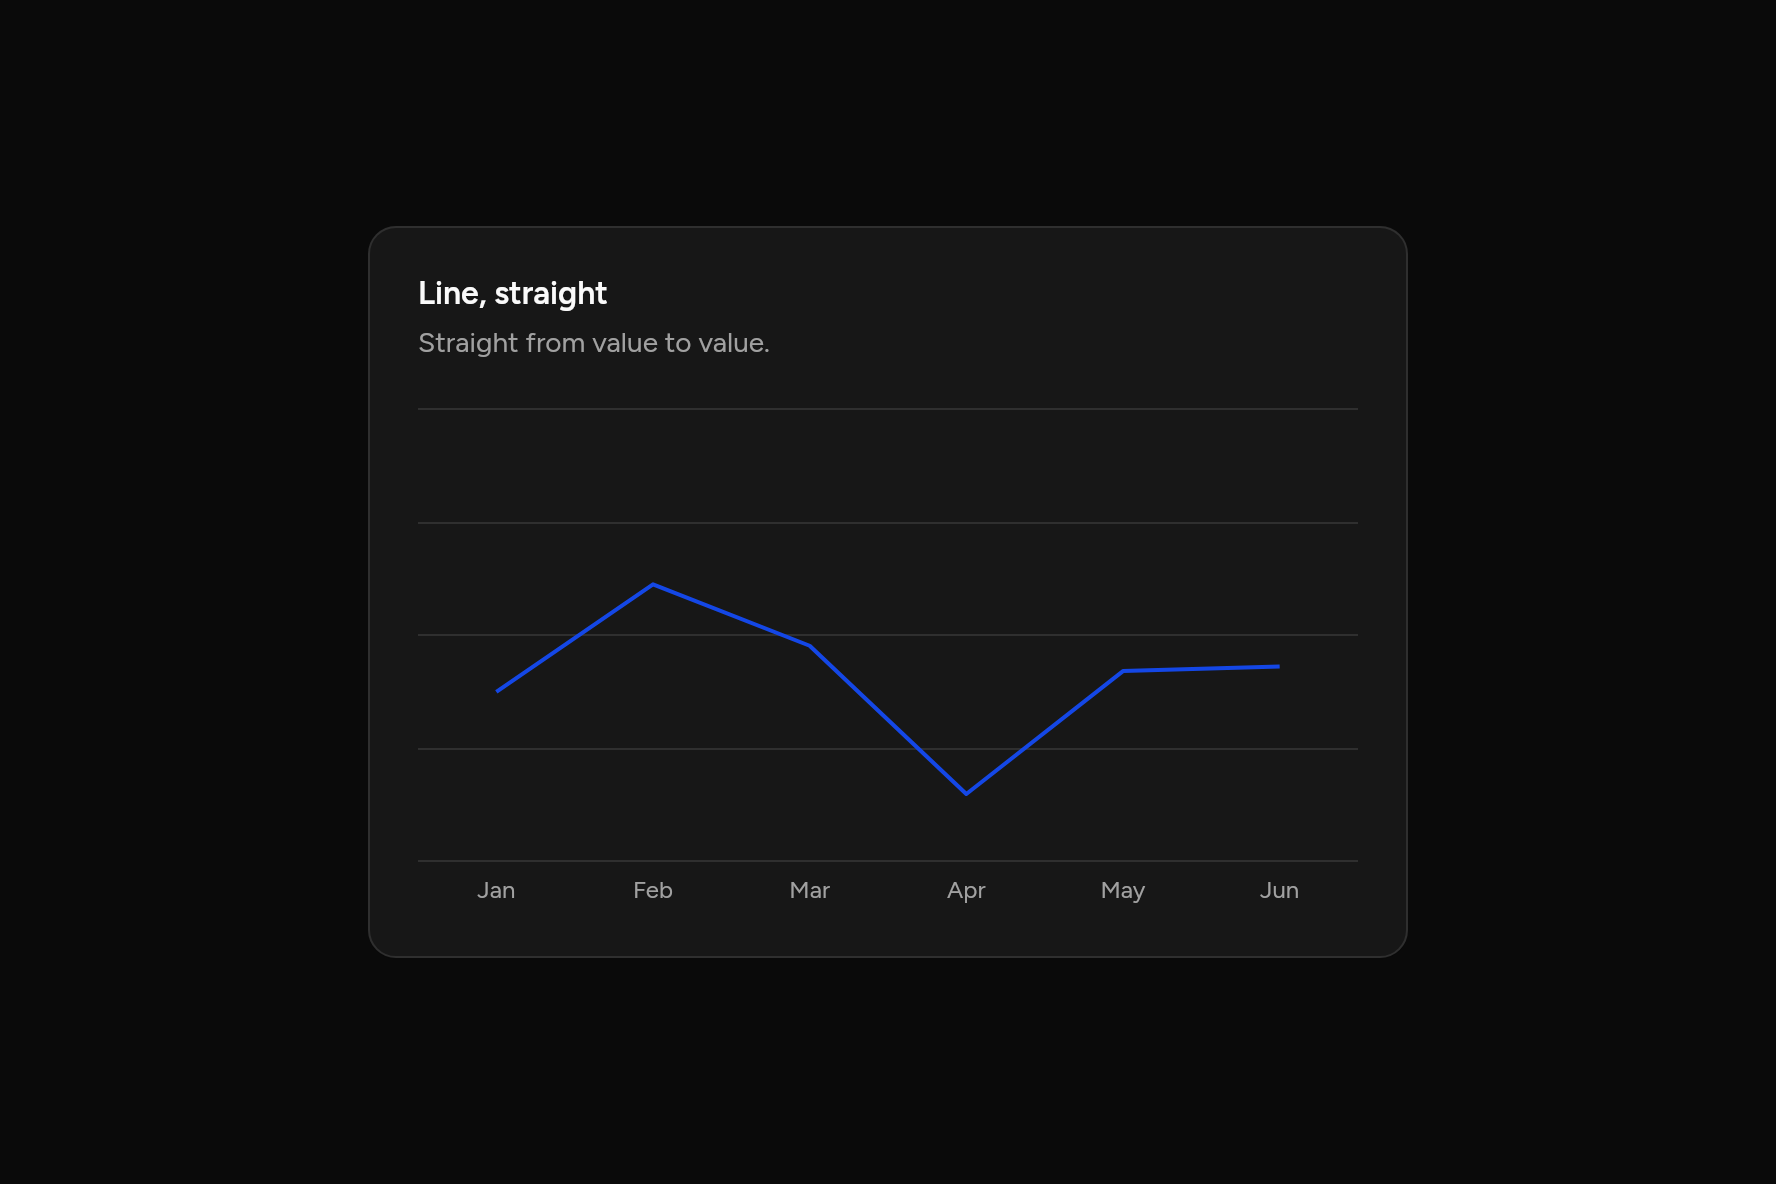
Line, straight
Straight from value to value.
Code
// Line, straight: Straight from value to value. Sample data.
import 'package:flutter/widgets.dart';

import 'ui/card.dart';
import 'ui/chart.dart';

class LineLinearChart extends StatelessWidget {
  const LineLinearChart({super.key});

  @override
  Widget build(BuildContext context) => SizedBox(
    width: 520,
    child: Card(
      children: [
        const CardHeader(
          title: Text("Line, straight"),
          description: Text("Straight from value to value."),
        ),
        CardContent(
          child: LineChart(
            labels: ['Jan', 'Feb', 'Mar', 'Apr', 'May', 'Jun'],
            series: const [
              ChartSeries('Desktop', [186, 305, 237, 73, 209, 214]),
            ],
            curve: ChartCurve.linear,
          ),
        ),
      ],
    ),
  );
}
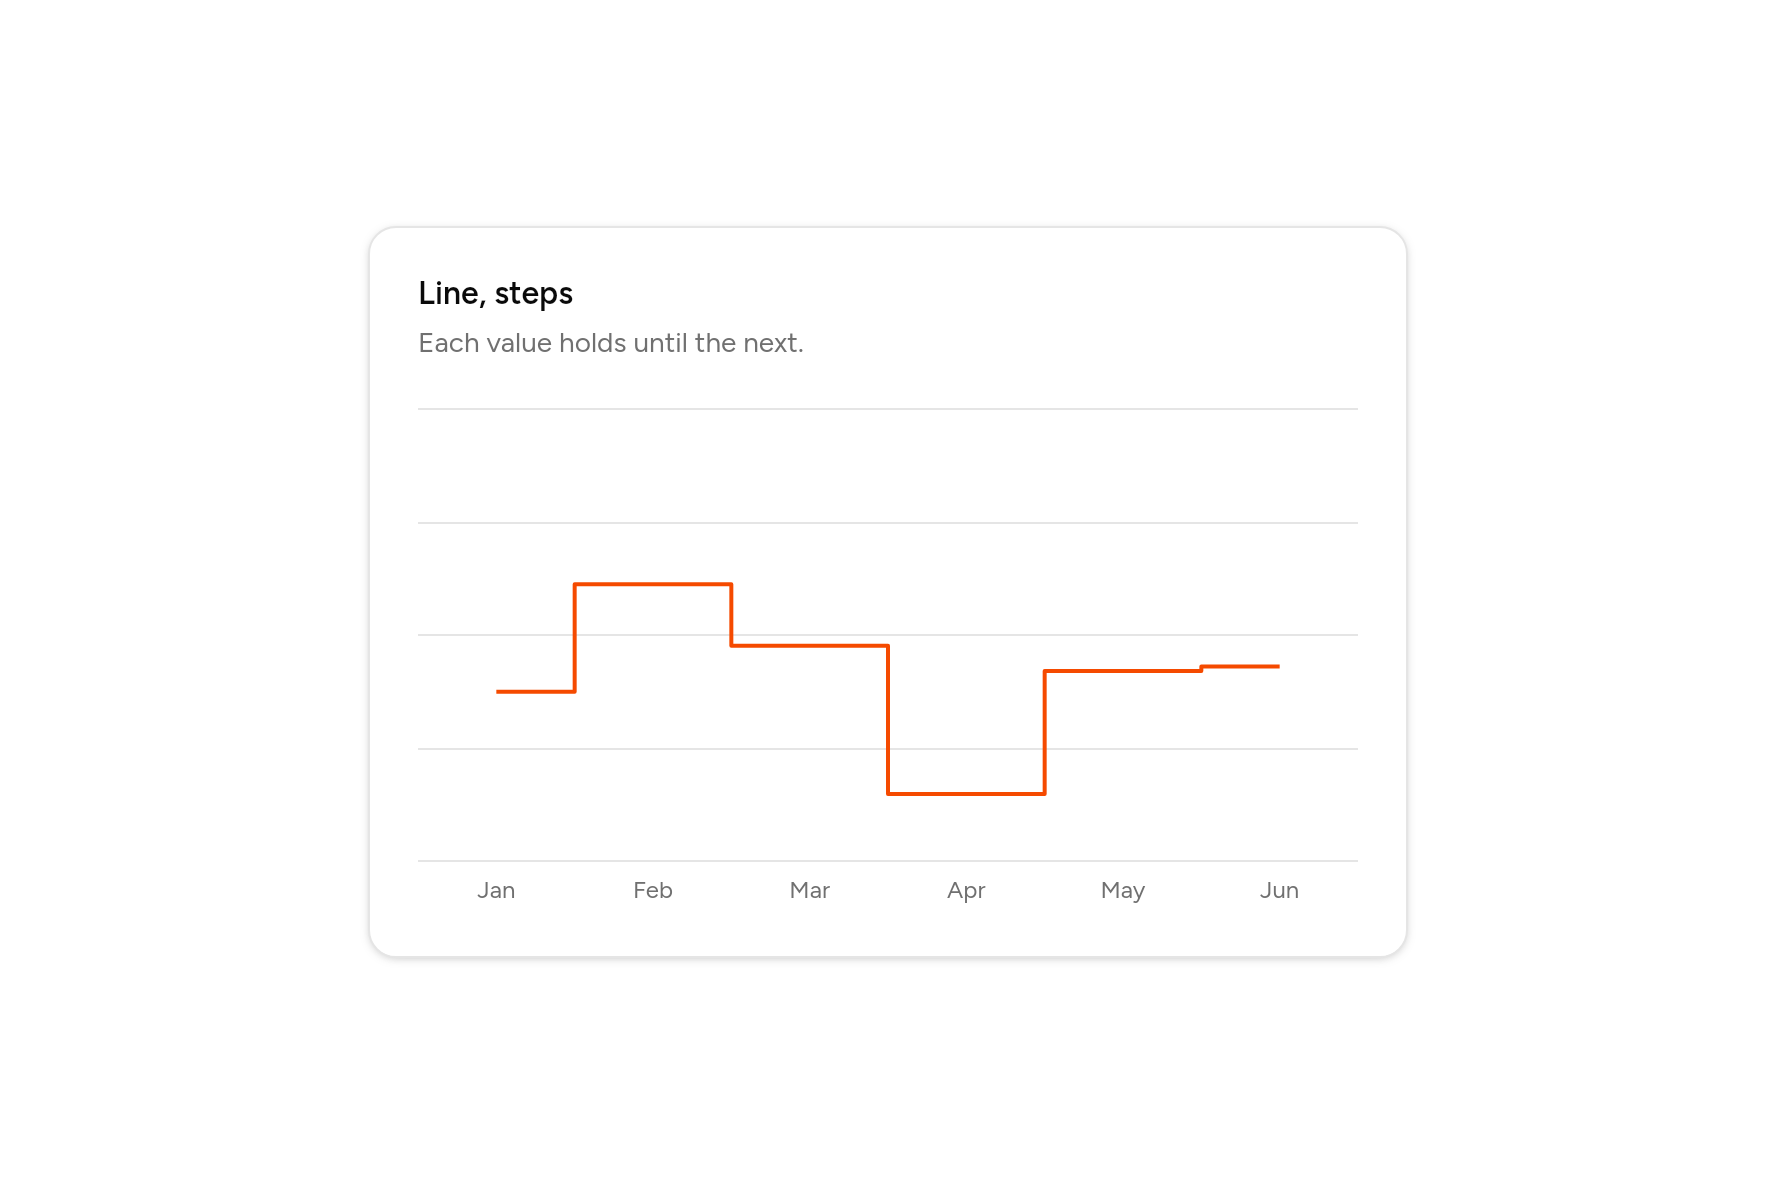
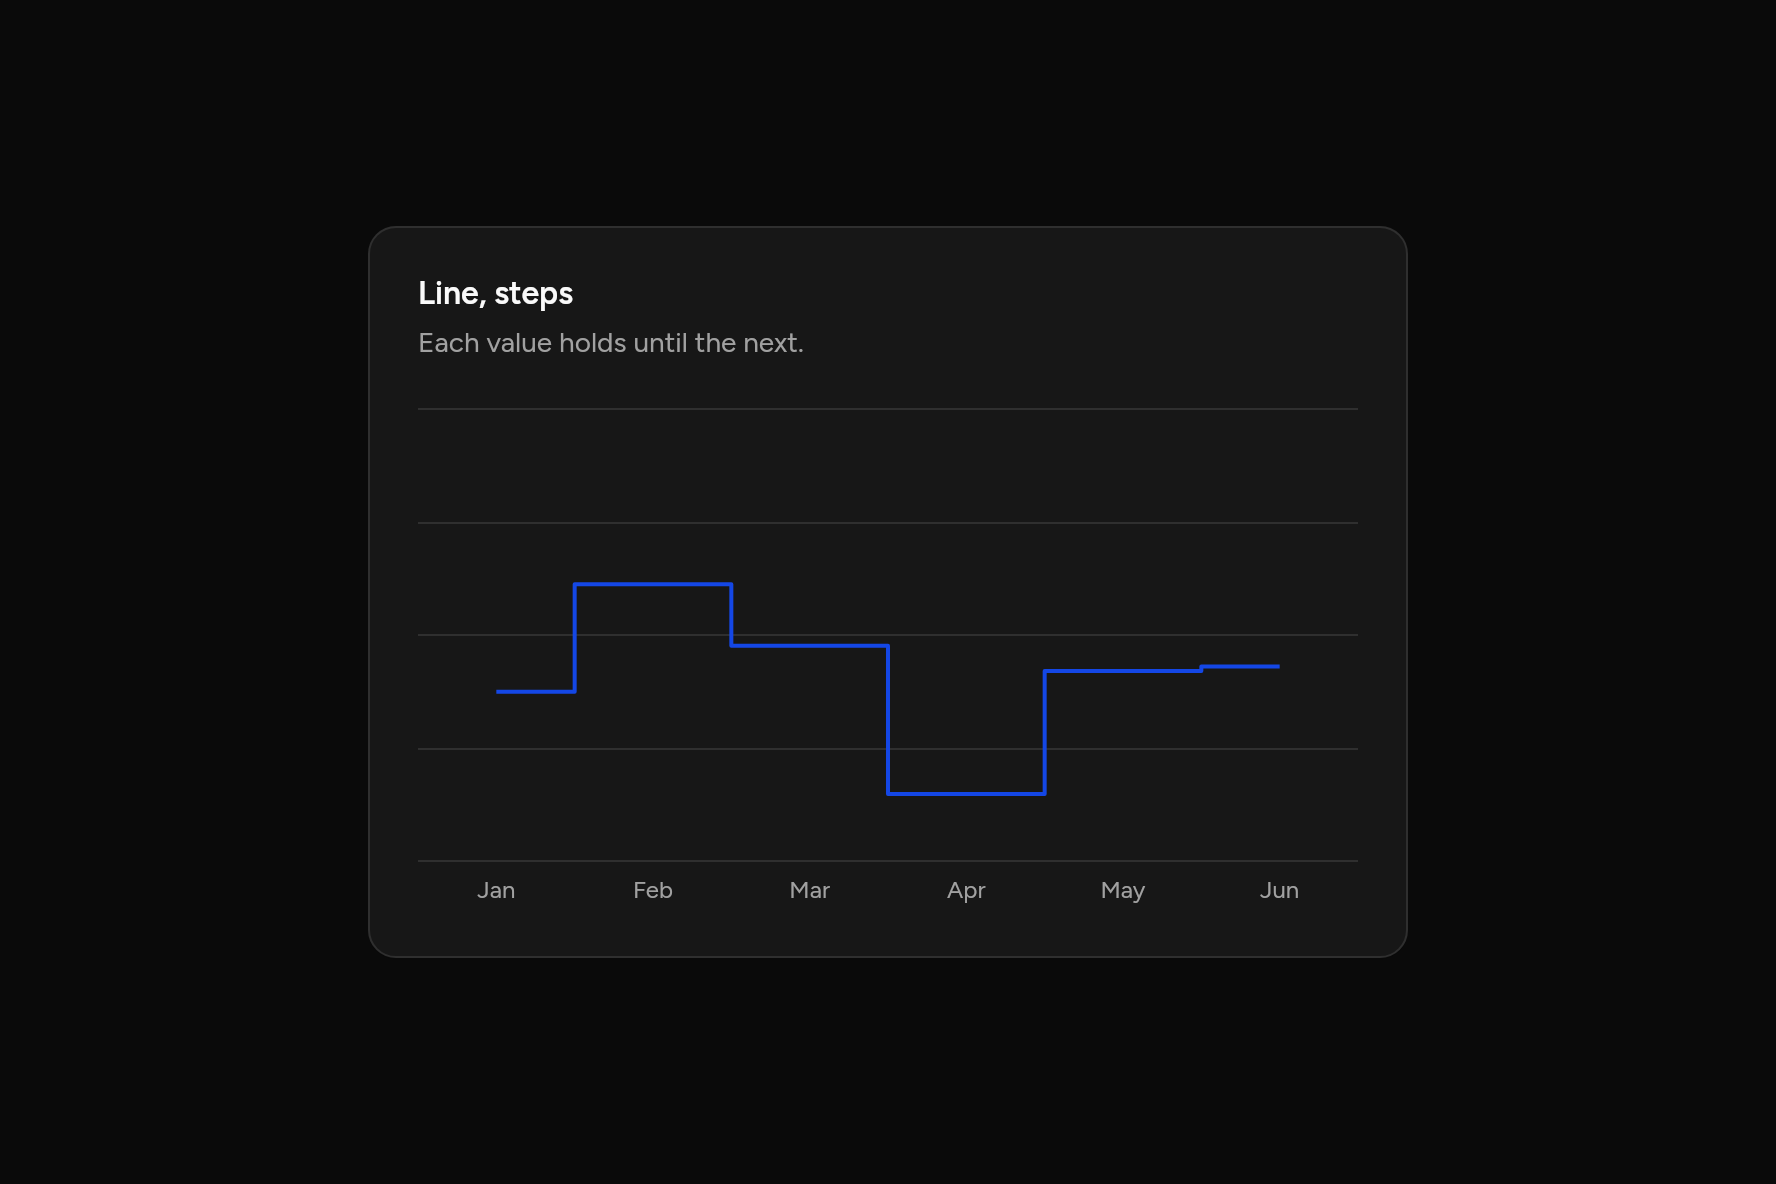
Line, steps
Each value holds until the next.
Code
// Line, steps: Each value holds until the next. Sample data.
import 'package:flutter/widgets.dart';

import 'ui/card.dart';
import 'ui/chart.dart';

class LineStepChart extends StatelessWidget {
  const LineStepChart({super.key});

  @override
  Widget build(BuildContext context) => SizedBox(
    width: 520,
    child: Card(
      children: [
        const CardHeader(
          title: Text("Line, steps"),
          description: Text("Each value holds until the next."),
        ),
        CardContent(
          child: LineChart(
            labels: ['Jan', 'Feb', 'Mar', 'Apr', 'May', 'Jun'],
            series: const [
              ChartSeries('Desktop', [186, 305, 237, 73, 209, 214]),
            ],
            curve: ChartCurve.step,
          ),
        ),
      ],
    ),
  );
}
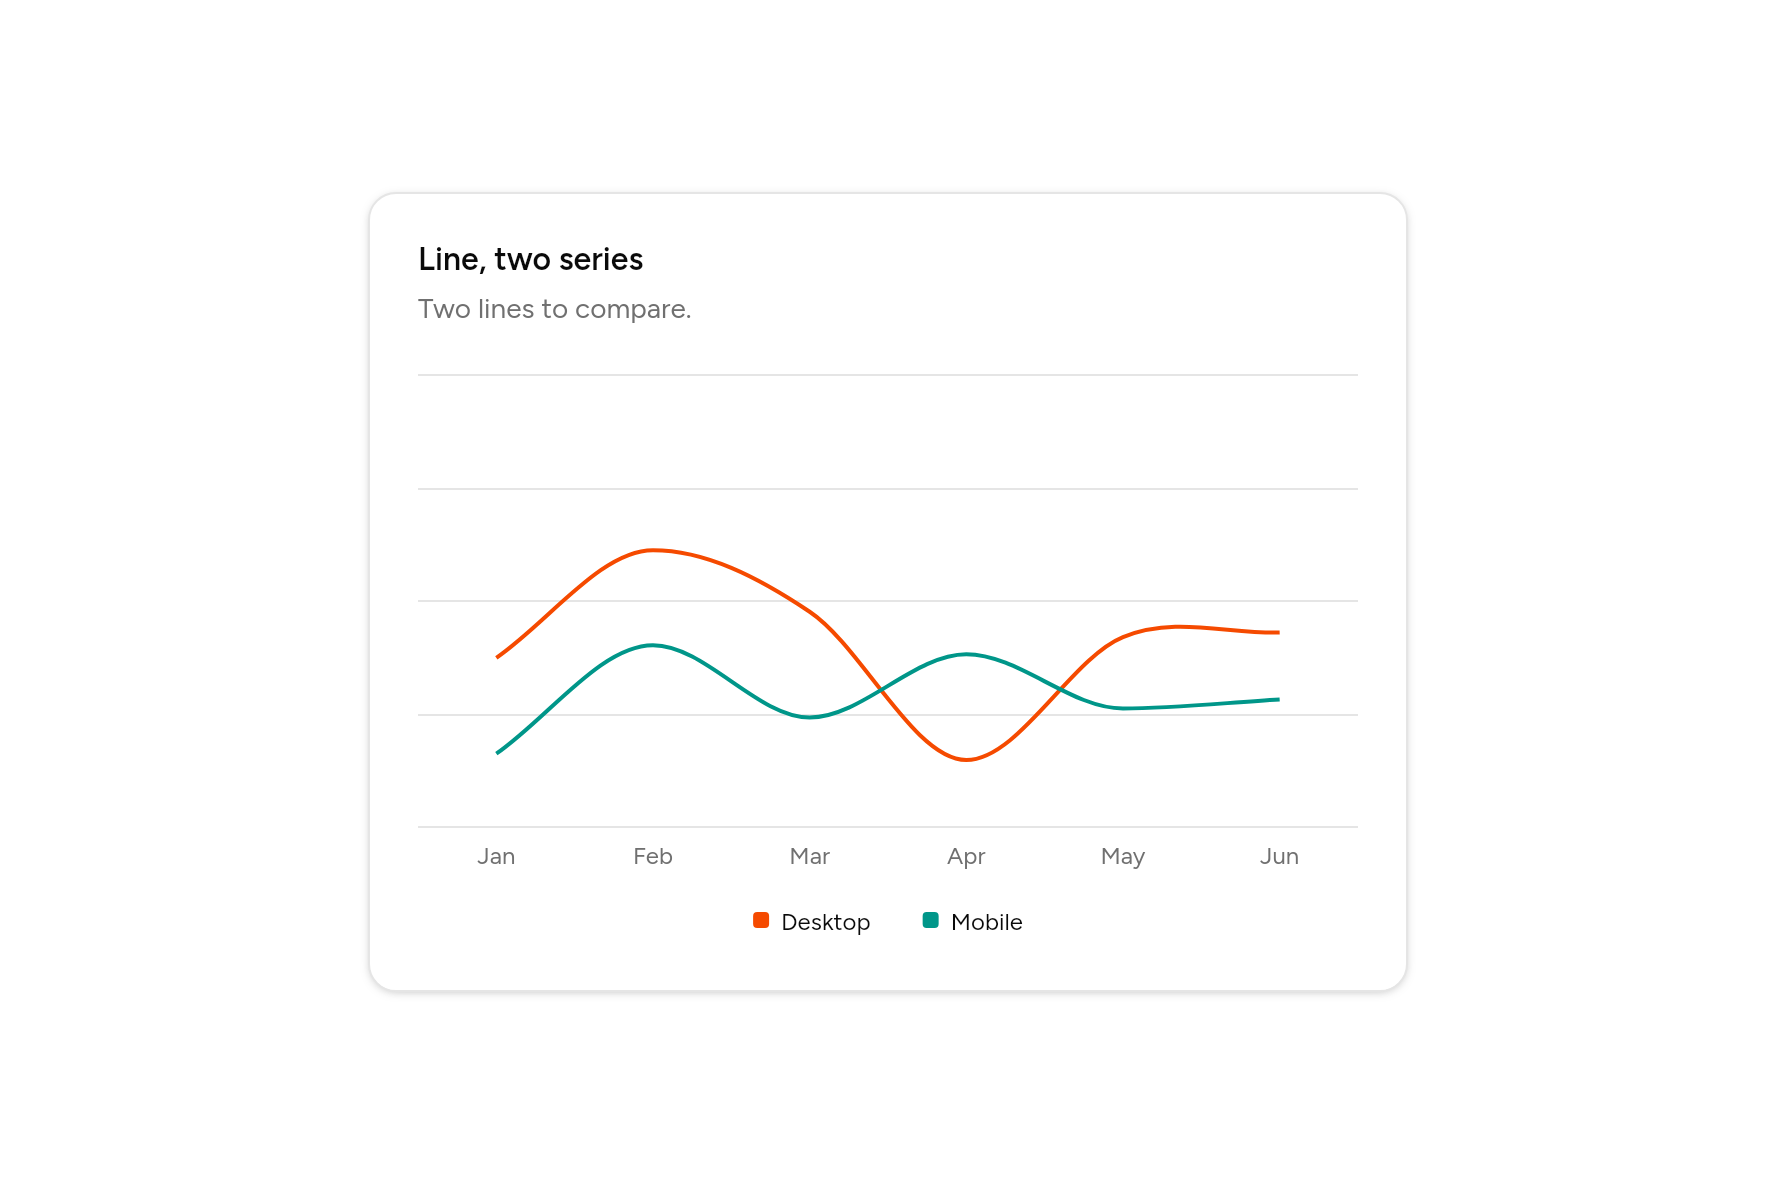
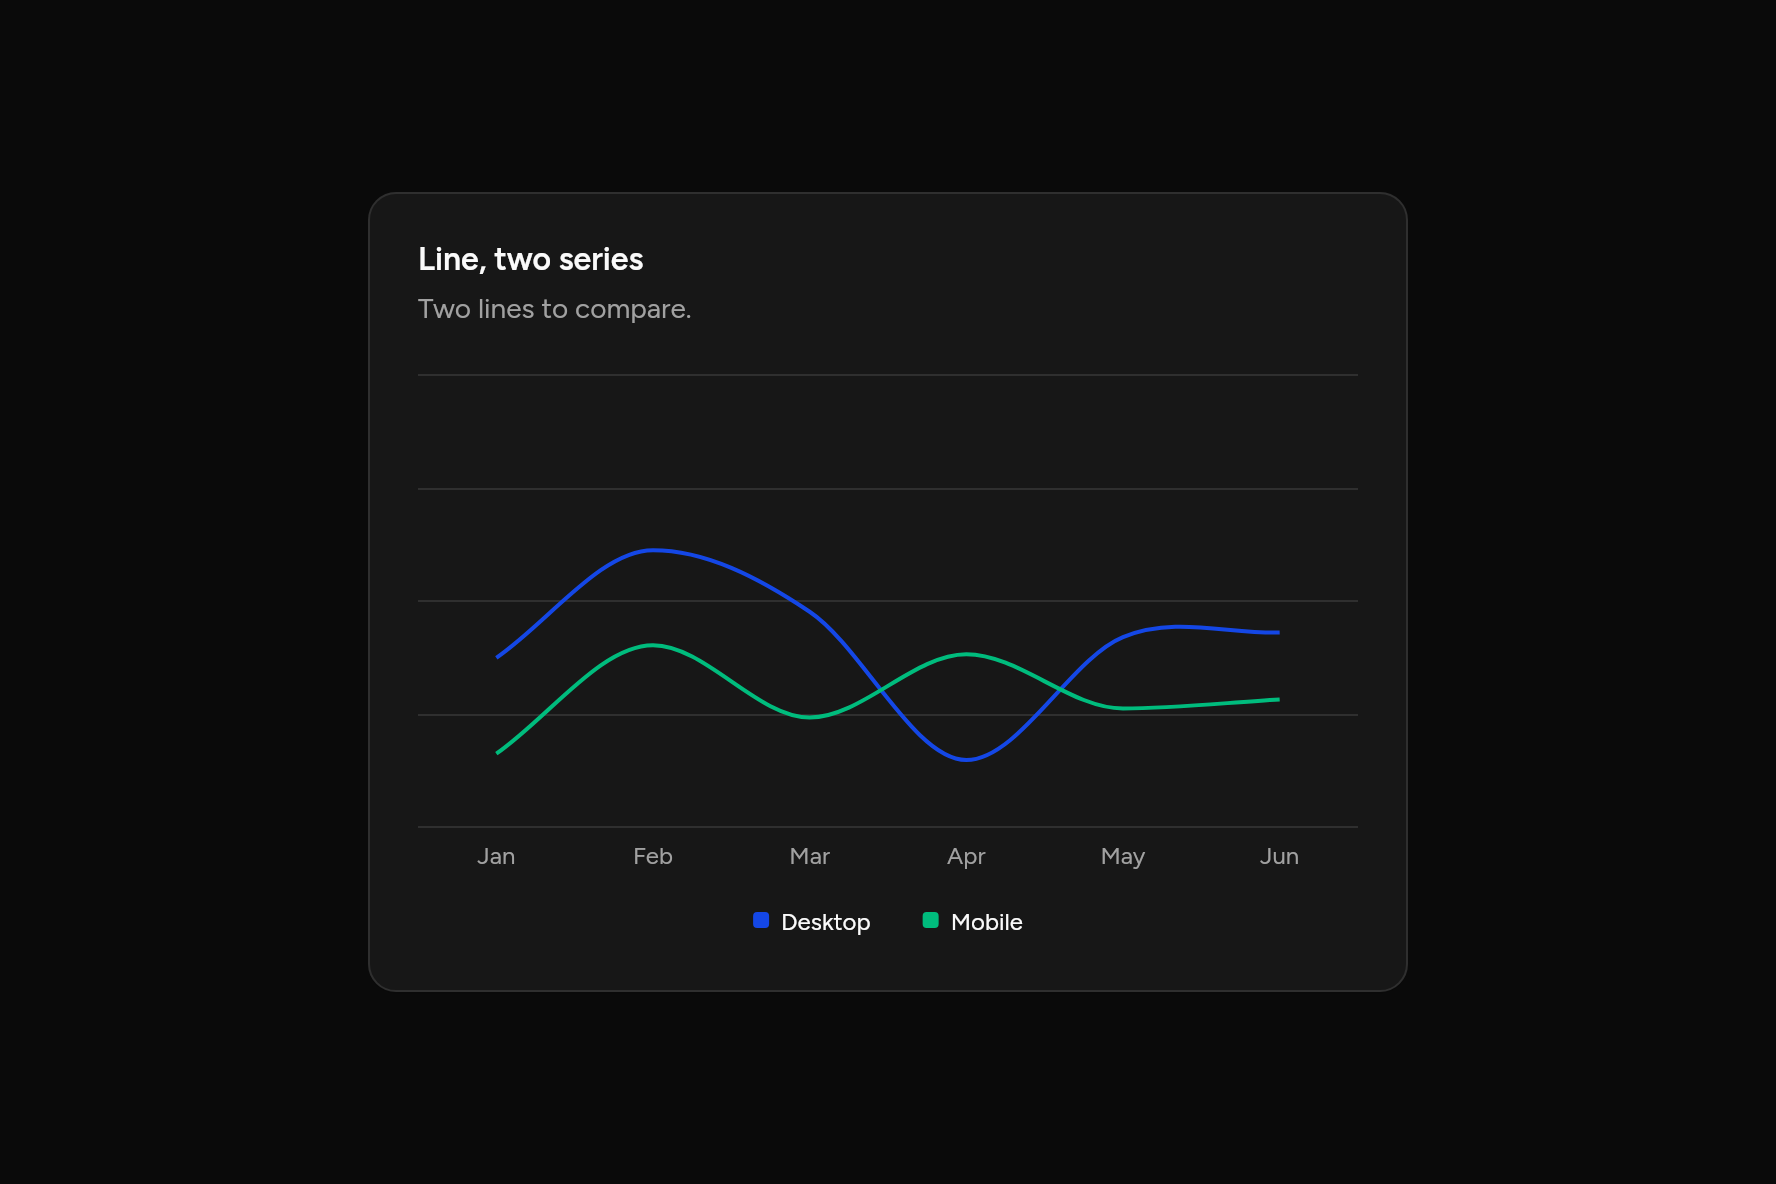
Line, two series
Two lines to compare.
Code
// Line, two series: Two lines to compare. Sample data.
import 'package:flutter/widgets.dart';

import 'ui/card.dart';
import 'ui/chart.dart';

class LineMultipleChart extends StatelessWidget {
  const LineMultipleChart({super.key});

  @override
  Widget build(BuildContext context) => SizedBox(
    width: 520,
    child: Card(
      children: [
        const CardHeader(
          title: Text("Line, two series"),
          description: Text("Two lines to compare."),
        ),
        CardContent(
          child: LineChart(
            labels: ['Jan', 'Feb', 'Mar', 'Apr', 'May', 'Jun'],
            series: const [
              ChartSeries('Desktop', [186, 305, 237, 73, 209, 214]),
              ChartSeries('Mobile', [80, 200, 120, 190, 130, 140]),
            ],
          ),
        ),
      ],
    ),
  );
}
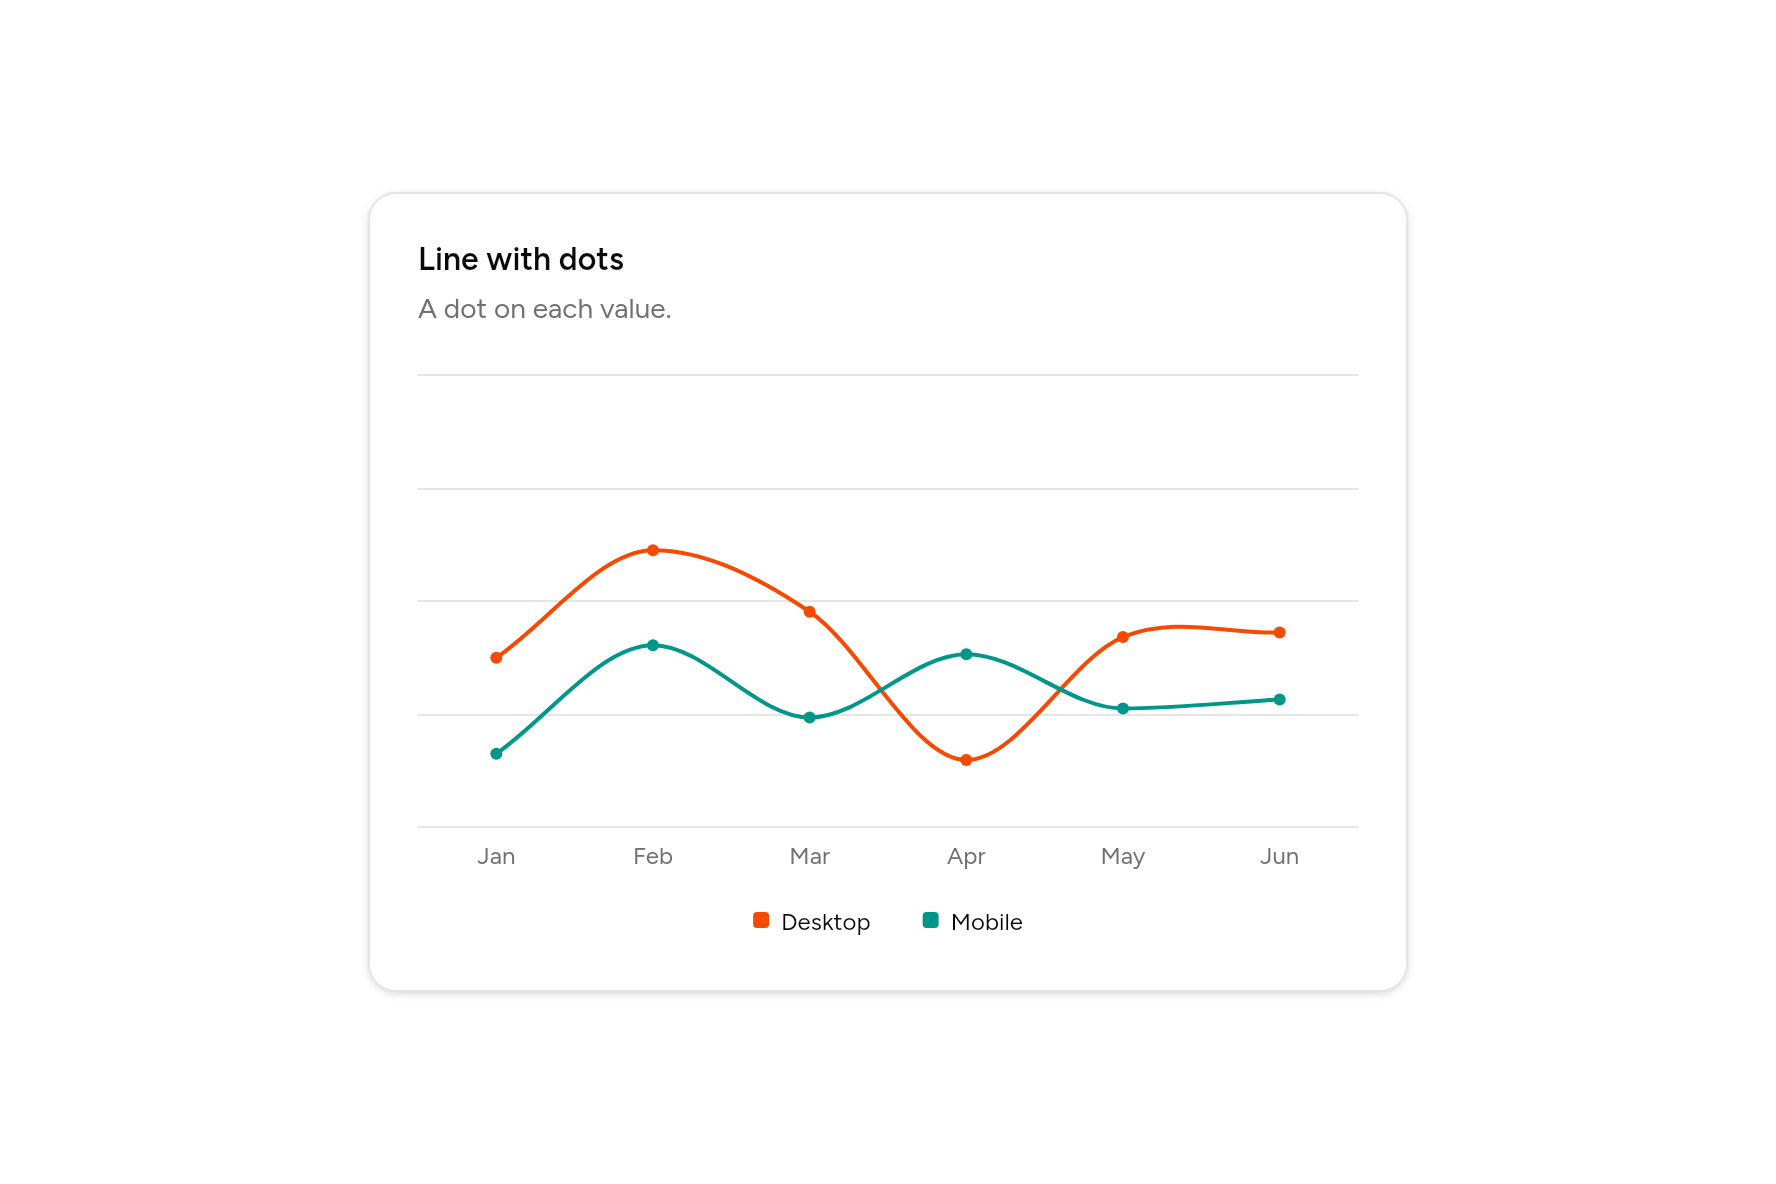
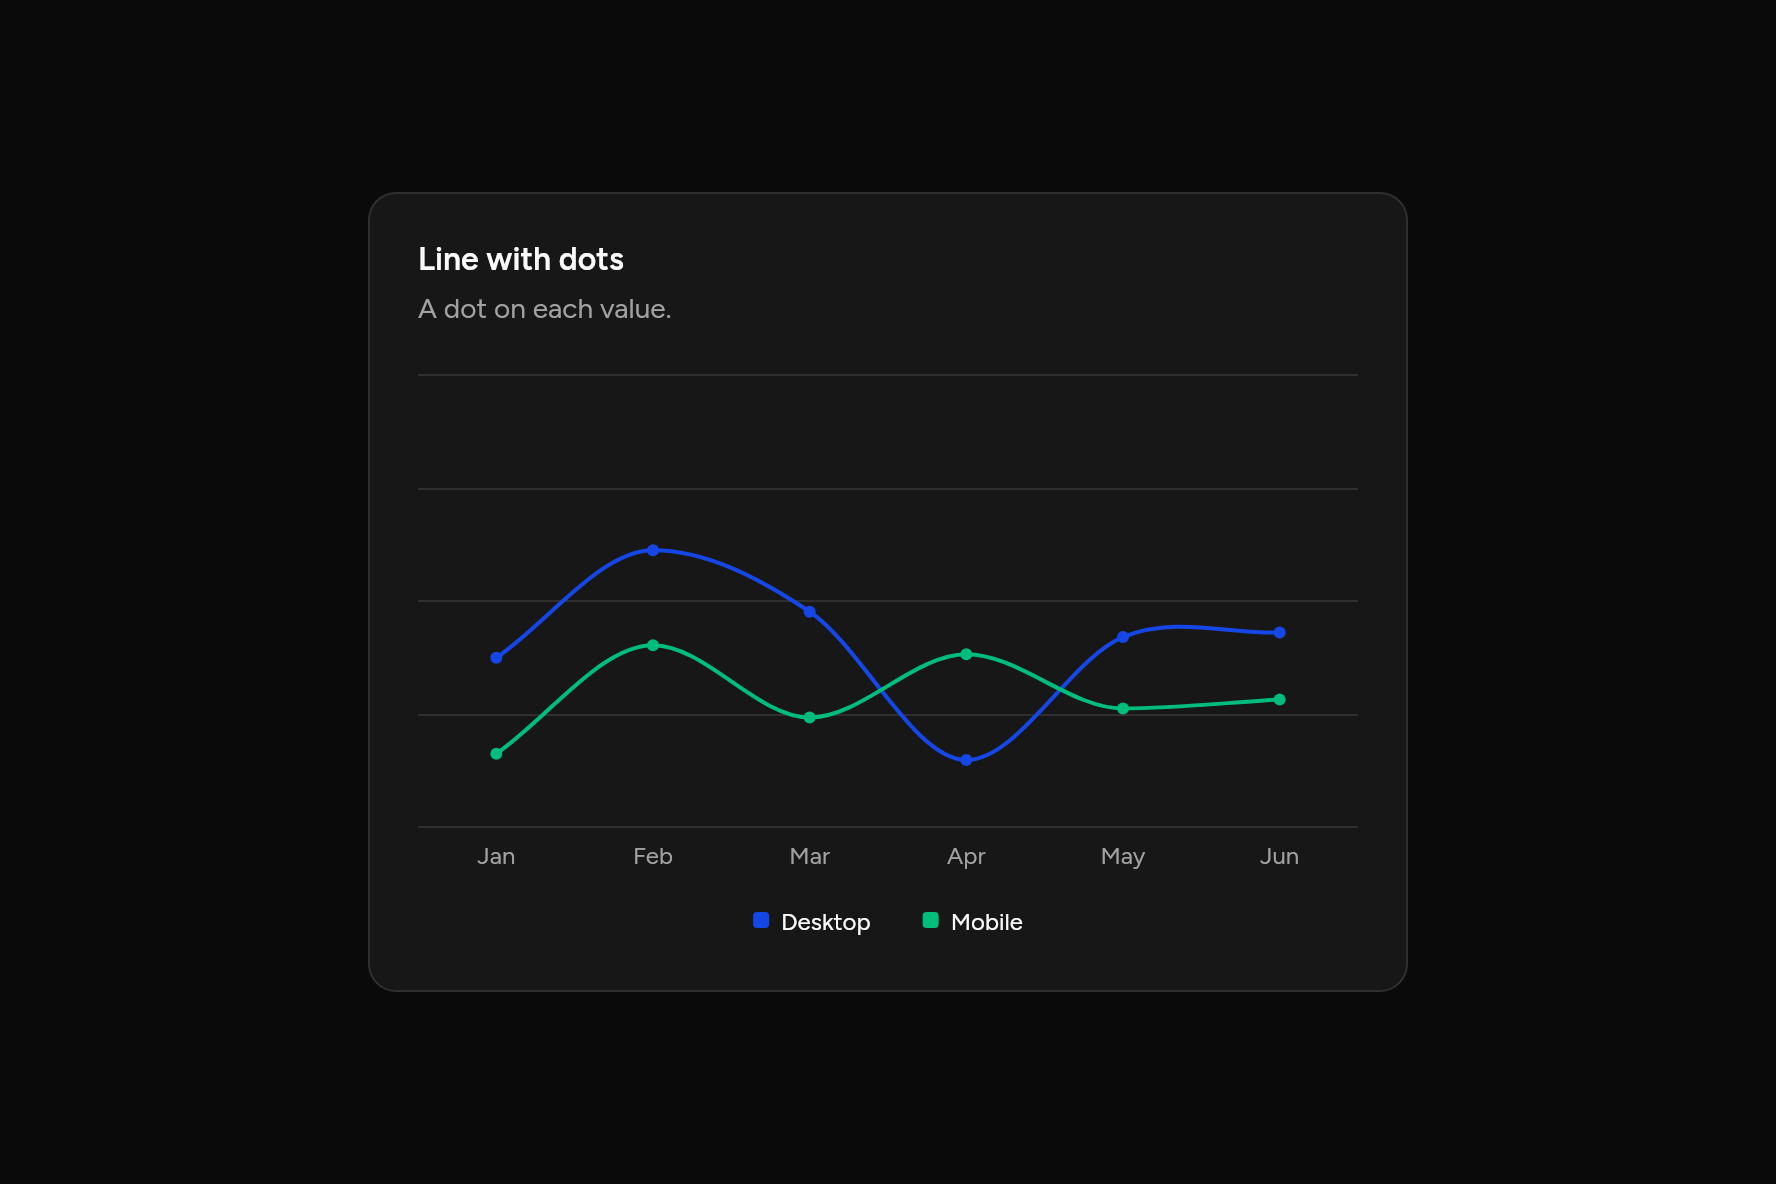
Line with dots
A dot on each value.
Code
// Line with dots: A dot on each value. Sample data.
import 'package:flutter/widgets.dart';

import 'ui/card.dart';
import 'ui/chart.dart';

class LineDotsChart extends StatelessWidget {
  const LineDotsChart({super.key});

  @override
  Widget build(BuildContext context) => SizedBox(
    width: 520,
    child: Card(
      children: [
        const CardHeader(
          title: Text("Line with dots"),
          description: Text("A dot on each value."),
        ),
        CardContent(
          child: LineChart(
            labels: ['Jan', 'Feb', 'Mar', 'Apr', 'May', 'Jun'],
            series: const [
              ChartSeries('Desktop', [186, 305, 237, 73, 209, 214]),
              ChartSeries('Mobile', [80, 200, 120, 190, 130, 140]),
            ],
            dots: true,
          ),
        ),
      ],
    ),
  );
}
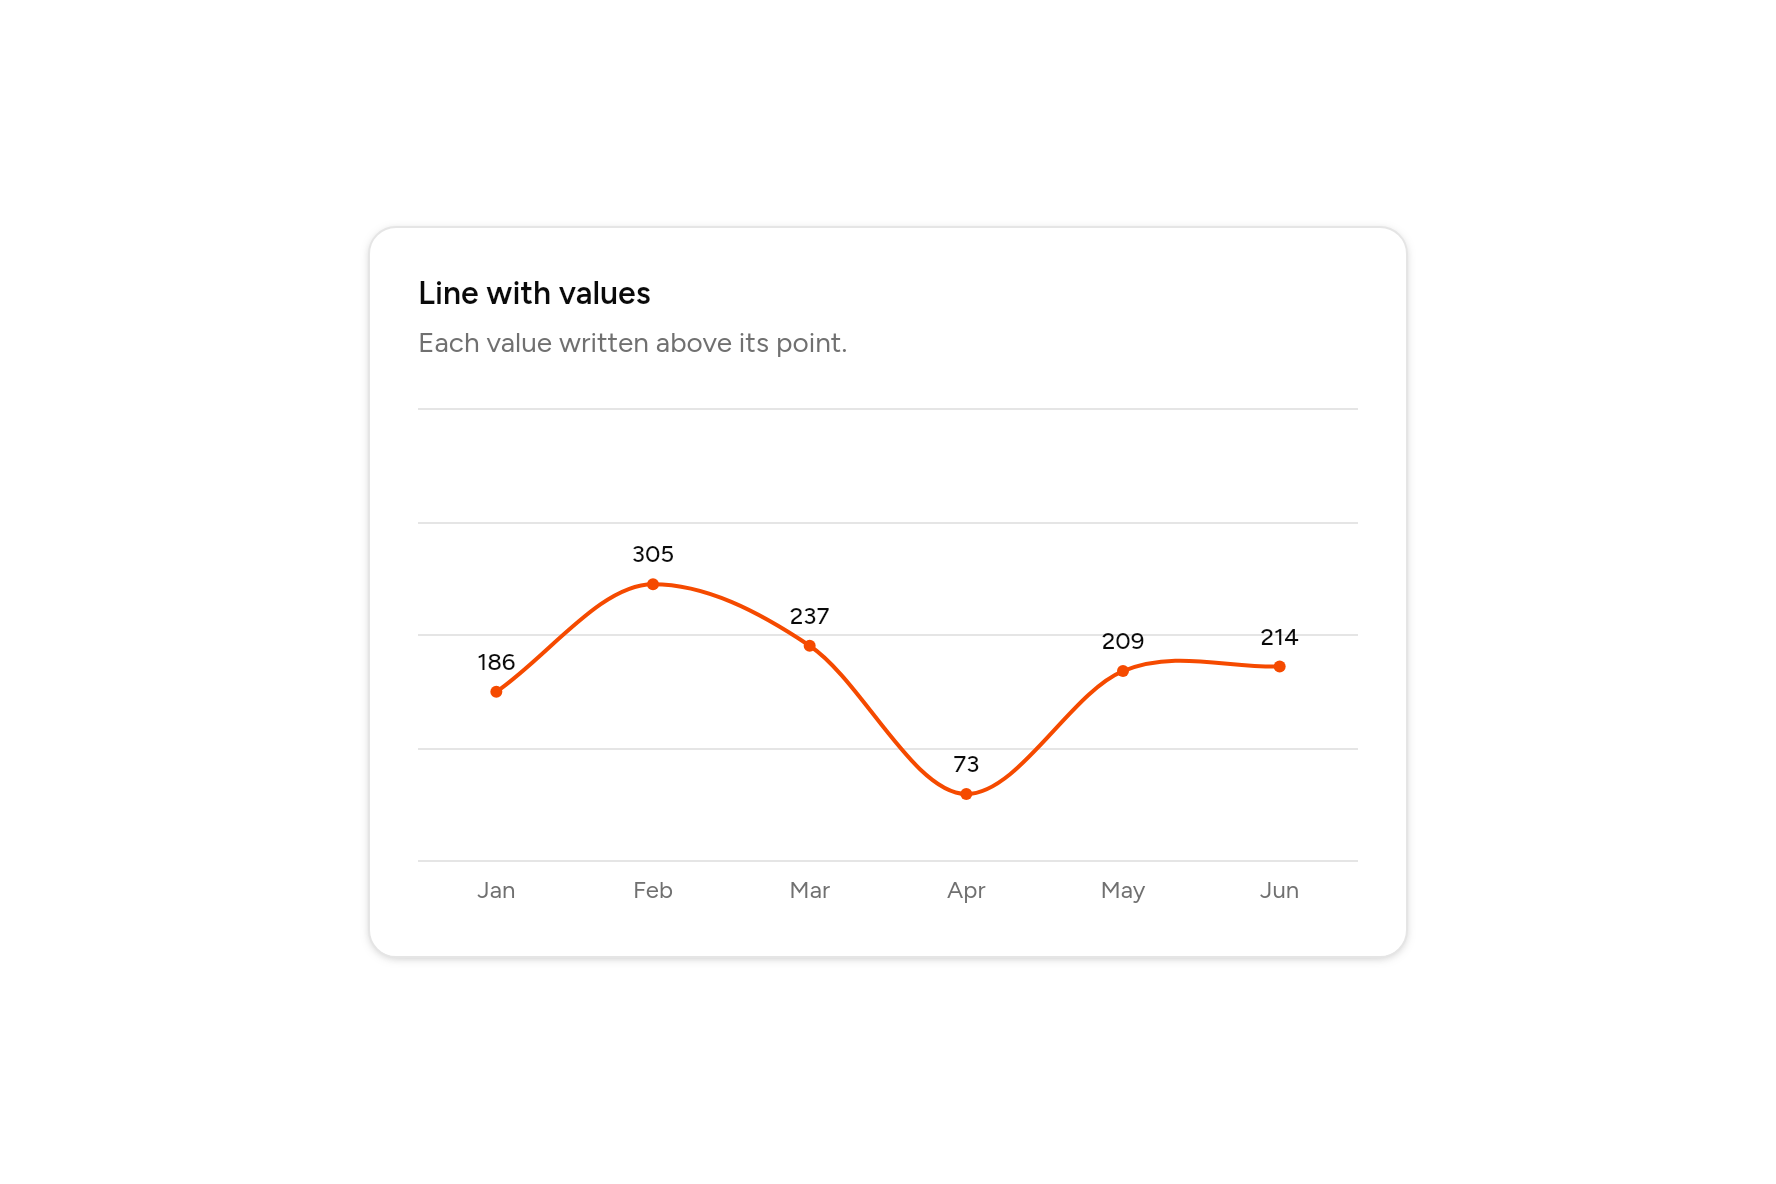
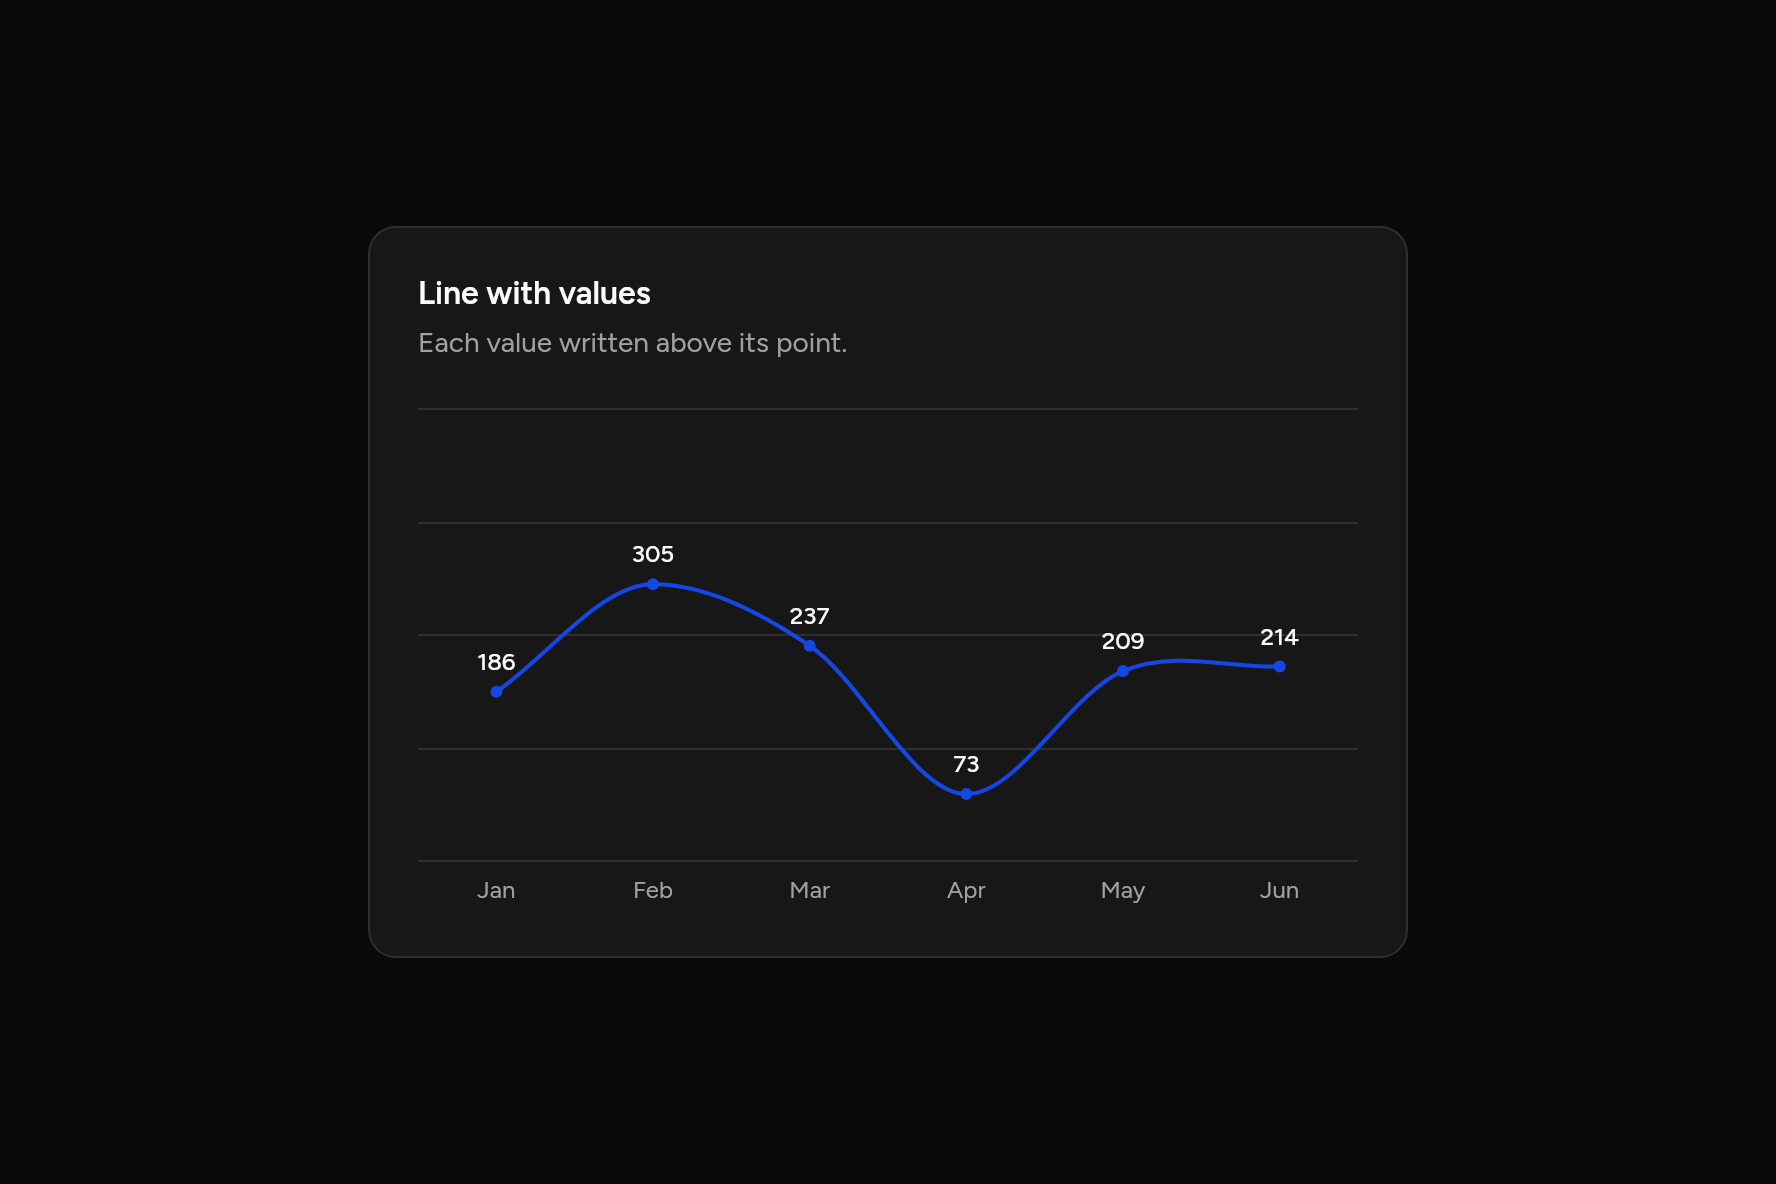
Line with values
Each value written above its point.
Code
// Line with values: Each value written above its point. Sample data.
import 'package:flutter/widgets.dart';

import 'ui/card.dart';
import 'ui/chart.dart';

class LineLabelChart extends StatelessWidget {
  const LineLabelChart({super.key});

  @override
  Widget build(BuildContext context) => SizedBox(
    width: 520,
    child: Card(
      children: [
        const CardHeader(
          title: Text("Line with values"),
          description: Text("Each value written above its point."),
        ),
        CardContent(
          child: LineChart(
            labels: ['Jan', 'Feb', 'Mar', 'Apr', 'May', 'Jun'],
            series: const [
              ChartSeries('Desktop', [186, 305, 237, 73, 209, 214]),
            ],
            dots: true,
            valueLabels: true,
          ),
        ),
      ],
    ),
  );
}
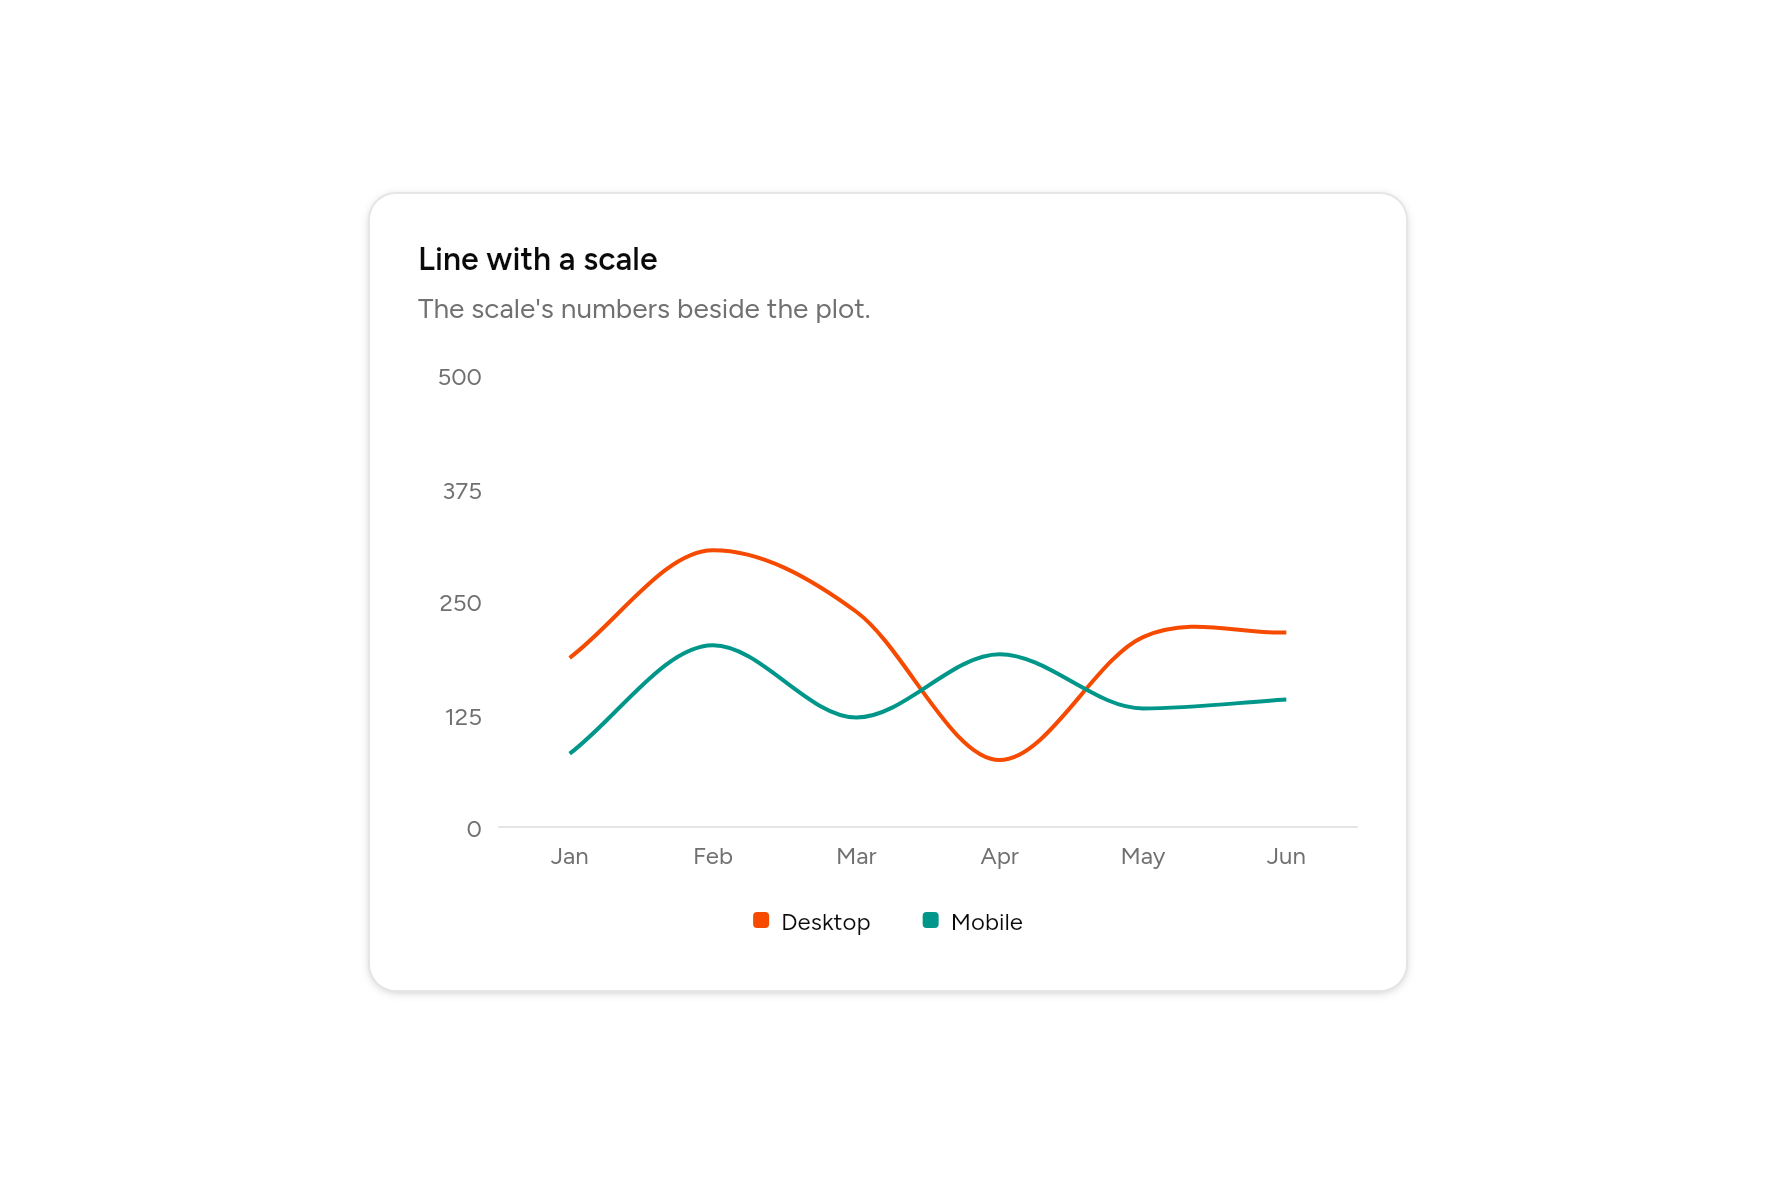
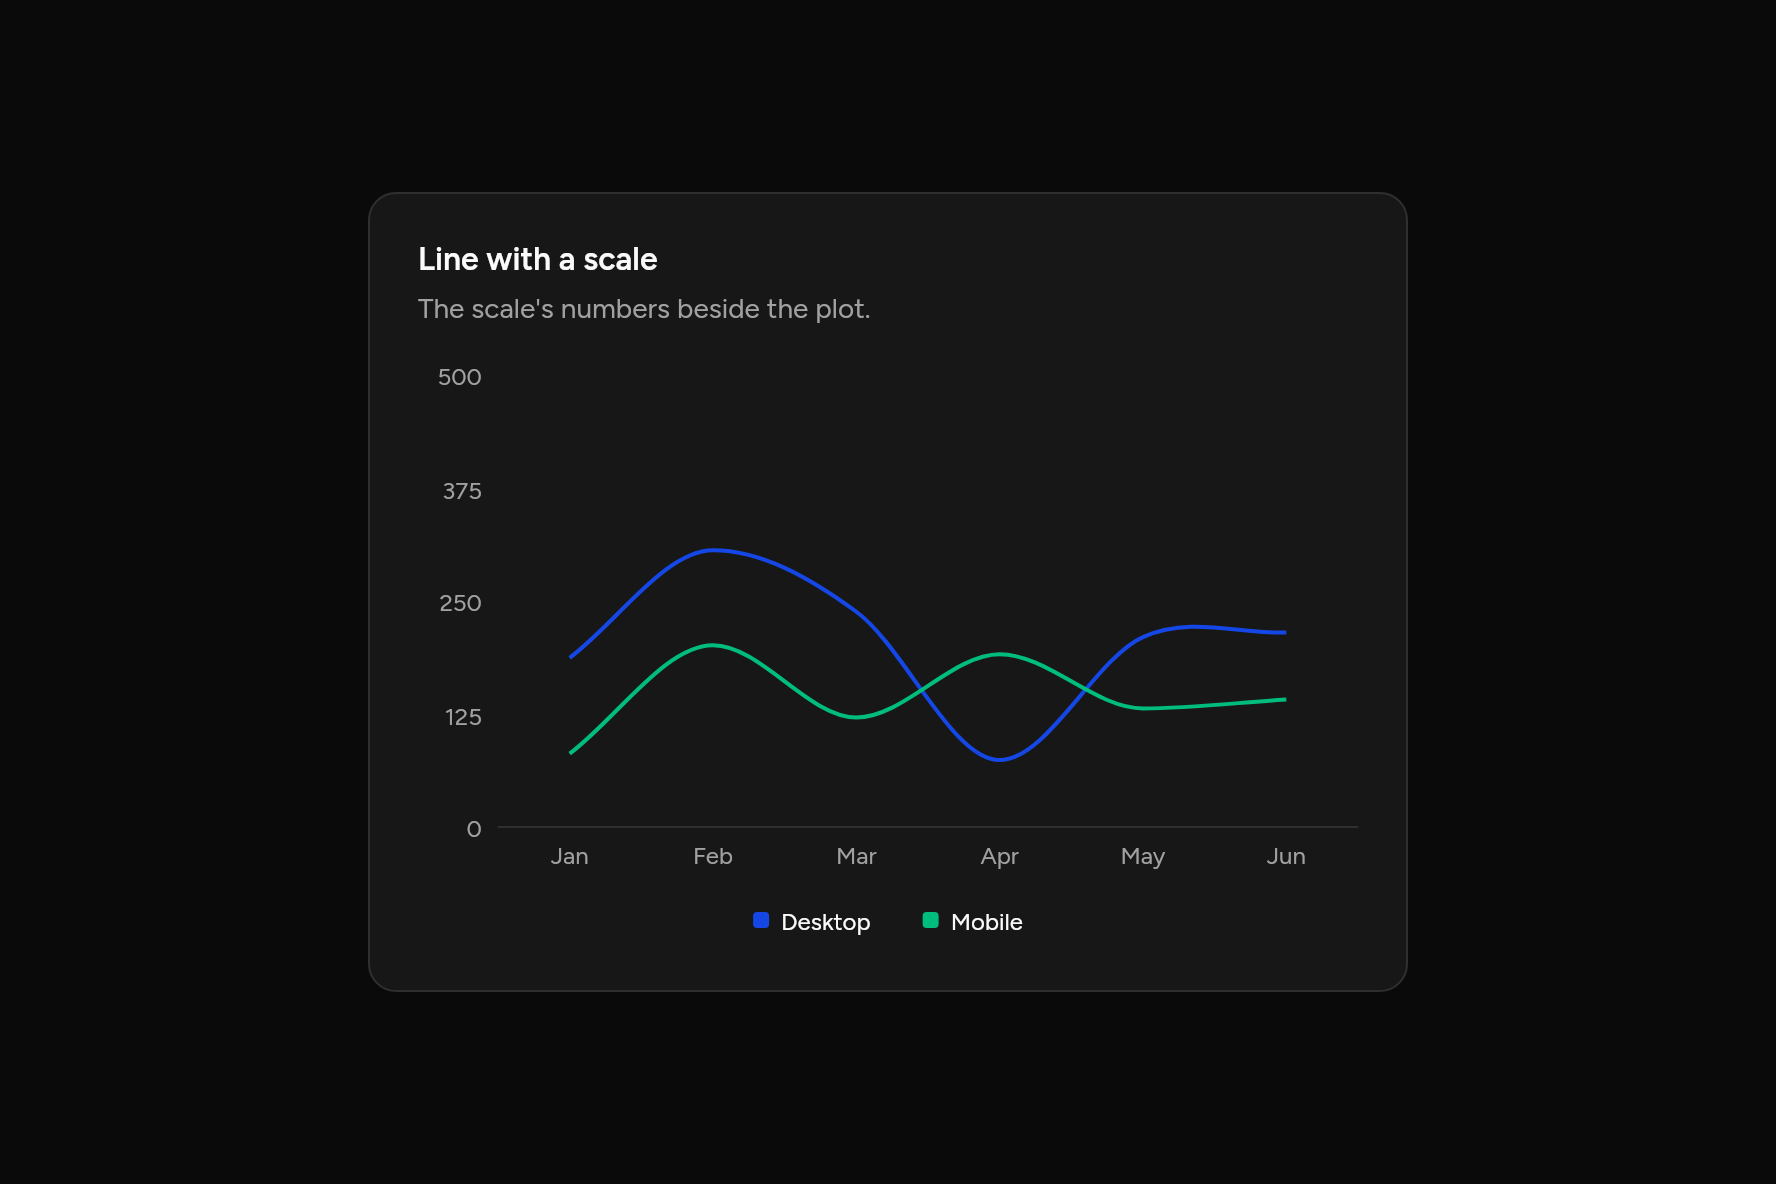
Line with a scale
The scale's numbers beside the plot.
Code
// Line with a scale: The scale's numbers beside the plot. Sample data.
import 'package:flutter/widgets.dart';

import 'ui/card.dart';
import 'ui/chart.dart';

class LineAxisChart extends StatelessWidget {
  const LineAxisChart({super.key});

  @override
  Widget build(BuildContext context) => SizedBox(
    width: 520,
    child: Card(
      children: [
        const CardHeader(
          title: Text("Line with a scale"),
          description: Text("The scale's numbers beside the plot."),
        ),
        CardContent(
          child: LineChart(
            labels: ['Jan', 'Feb', 'Mar', 'Apr', 'May', 'Jun'],
            series: const [
              ChartSeries('Desktop', [186, 305, 237, 73, 209, 214]),
              ChartSeries('Mobile', [80, 200, 120, 190, 130, 140]),
            ],
            axis: true,
            grid: false,
          ),
        ),
      ],
    ),
  );
}
Pie
Pie
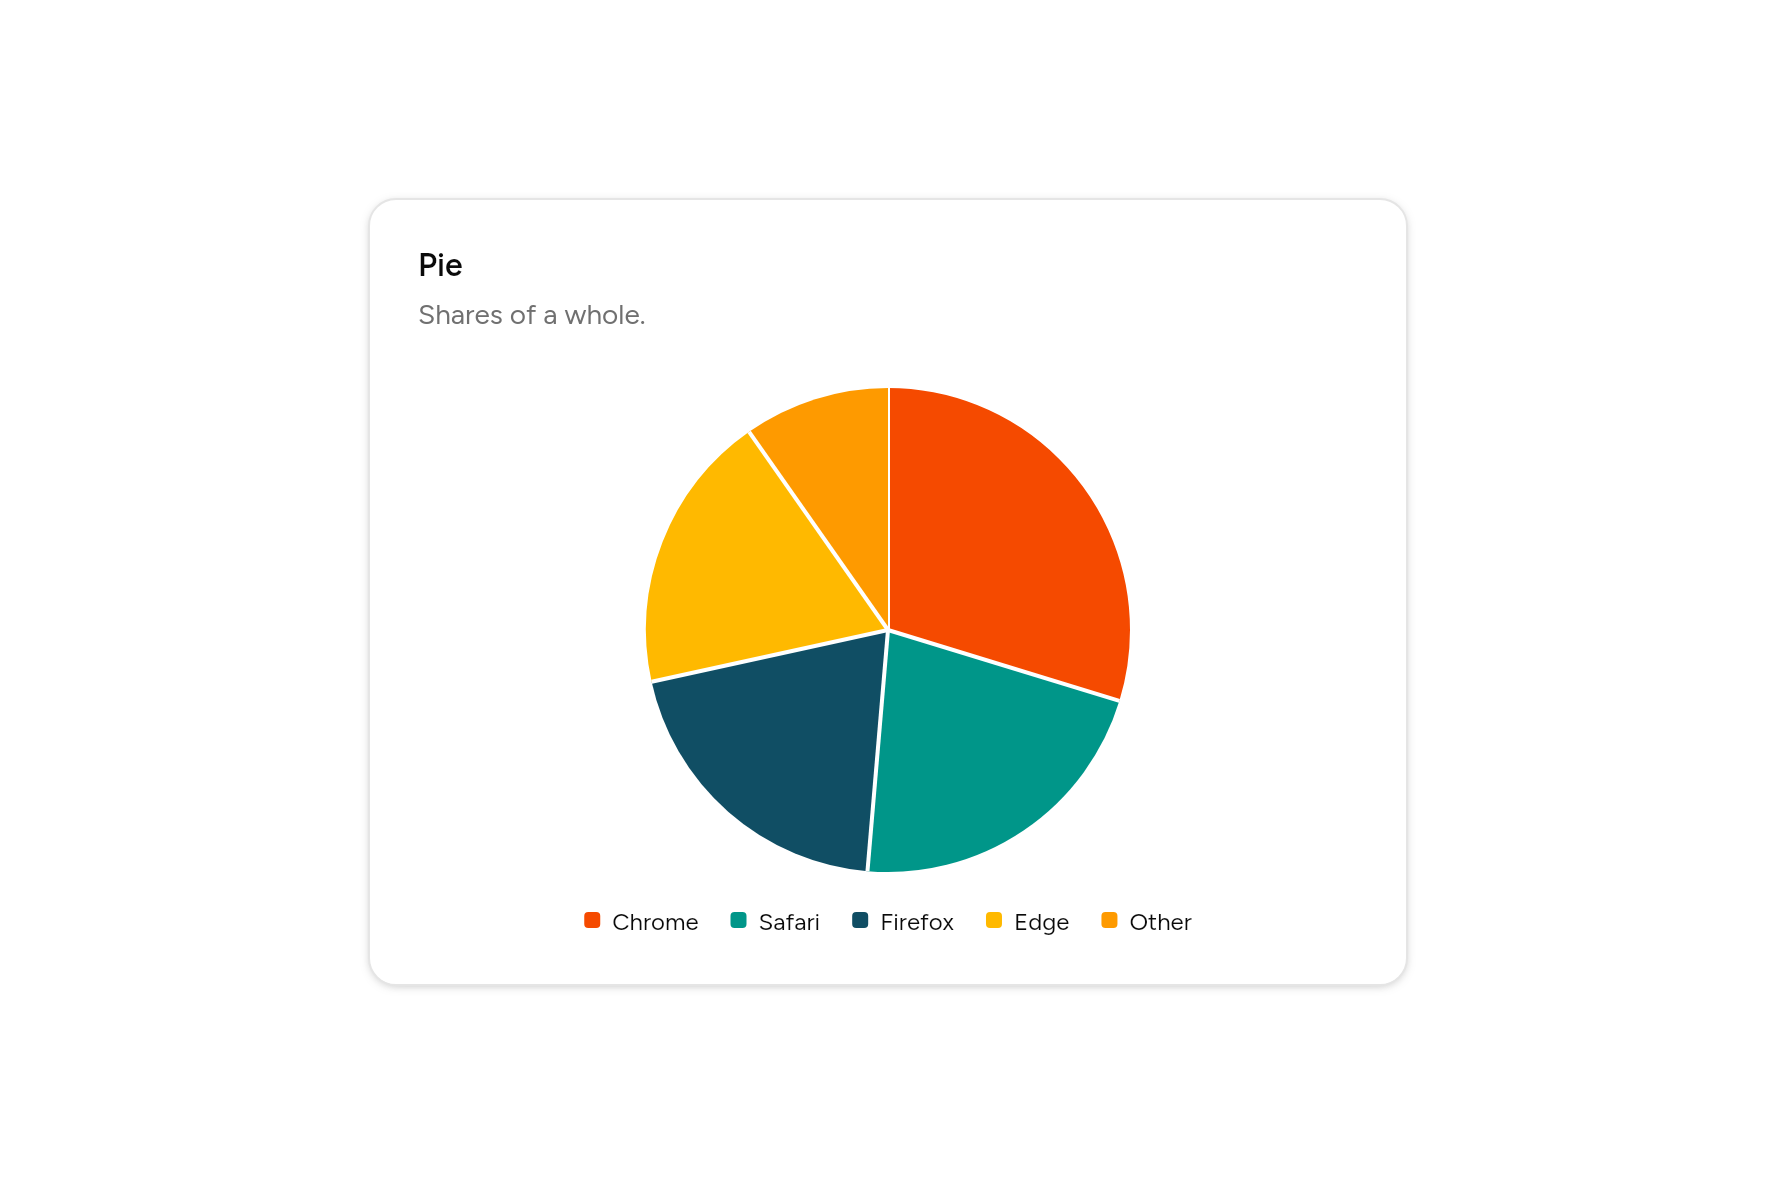
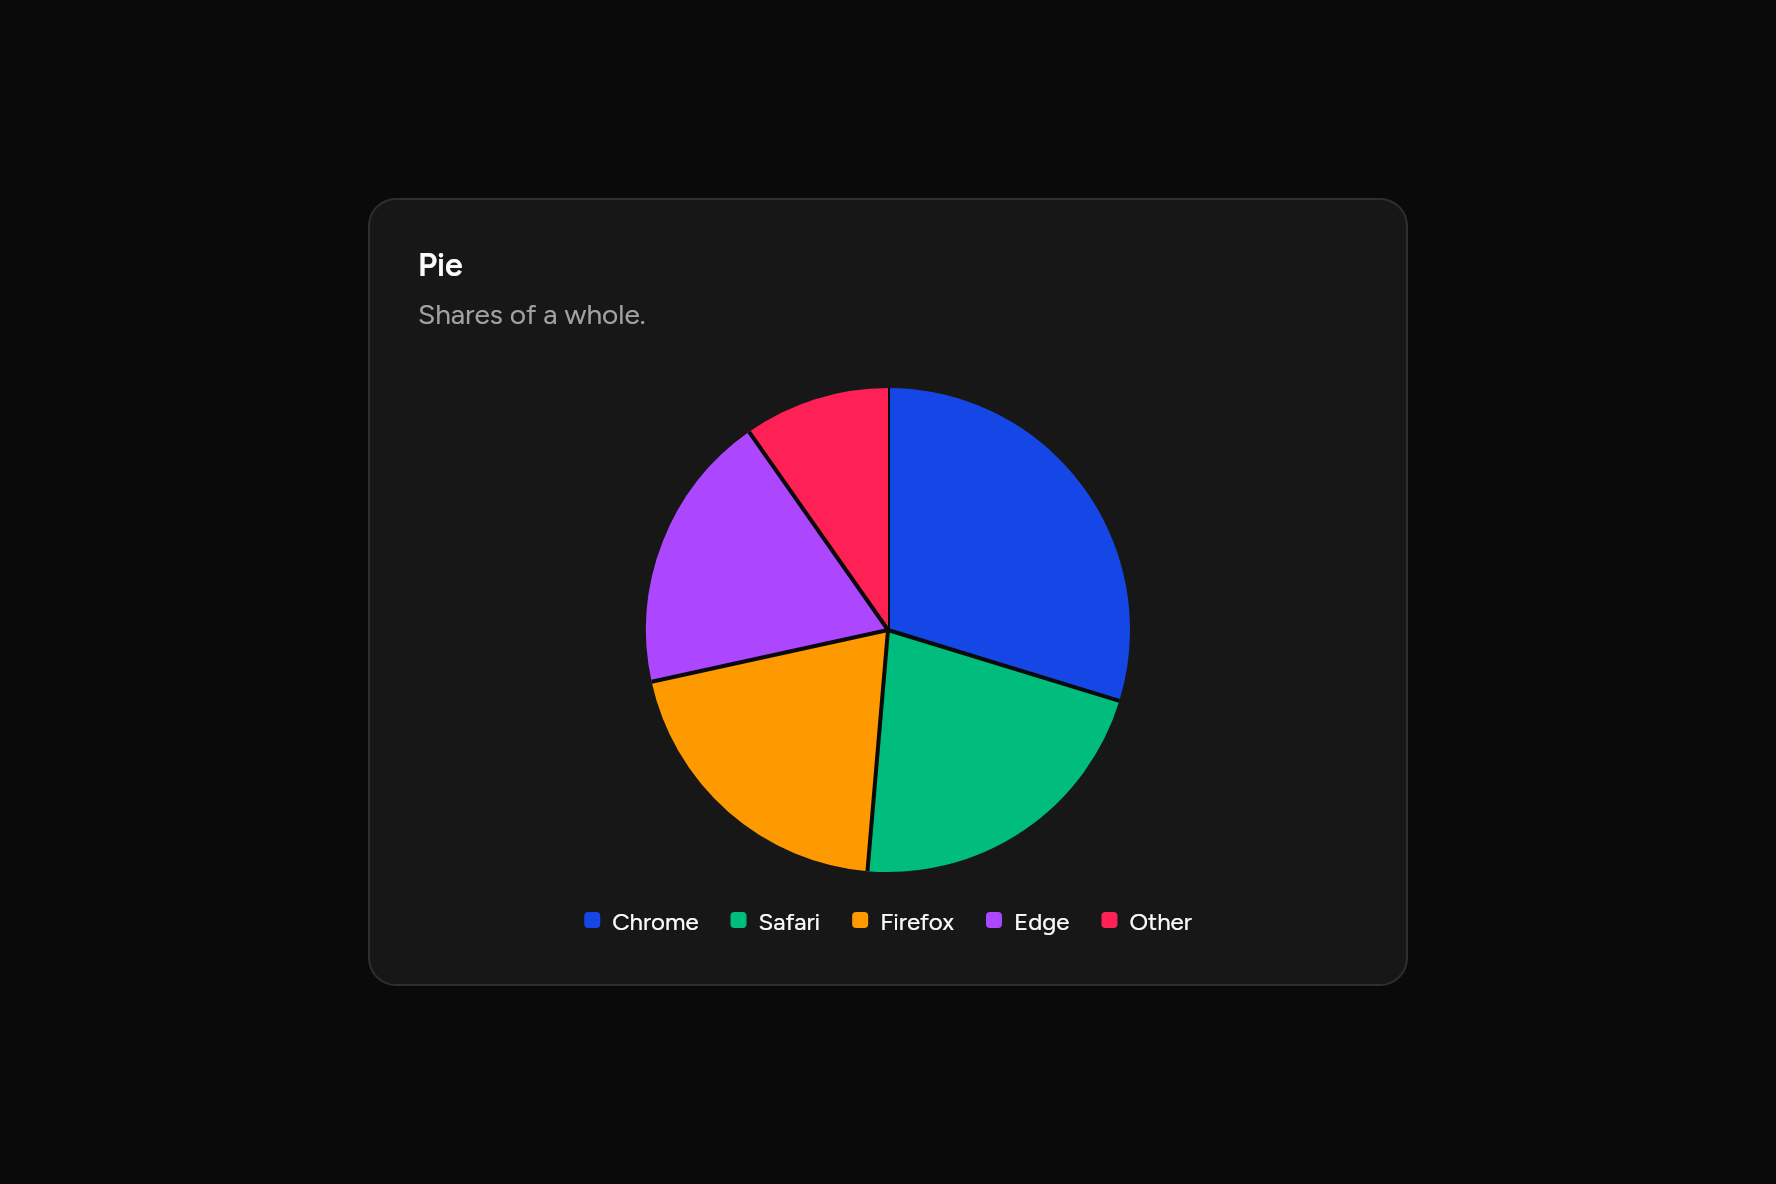
Shares of a whole.
Code
// Pie: Shares of a whole. Sample data.
import 'package:flutter/widgets.dart';

import 'ui/card.dart';
import 'ui/chart.dart';

class PieSimpleChart extends StatelessWidget {
  const PieSimpleChart({super.key});

  @override
  Widget build(BuildContext context) => SizedBox(
    width: 520,
    child: Card(
      children: [
        const CardHeader(
          title: Text("Pie"),
          description: Text("Shares of a whole."),
        ),
        CardContent(
          child: PieChart(
            slices: const [
              ChartSlice('Chrome', 275),
              ChartSlice('Safari', 200),
              ChartSlice('Firefox', 187),
              ChartSlice('Edge', 173),
              ChartSlice('Other', 90),
            ],
            donut: false,
          ),
        ),
      ],
    ),
  );
}
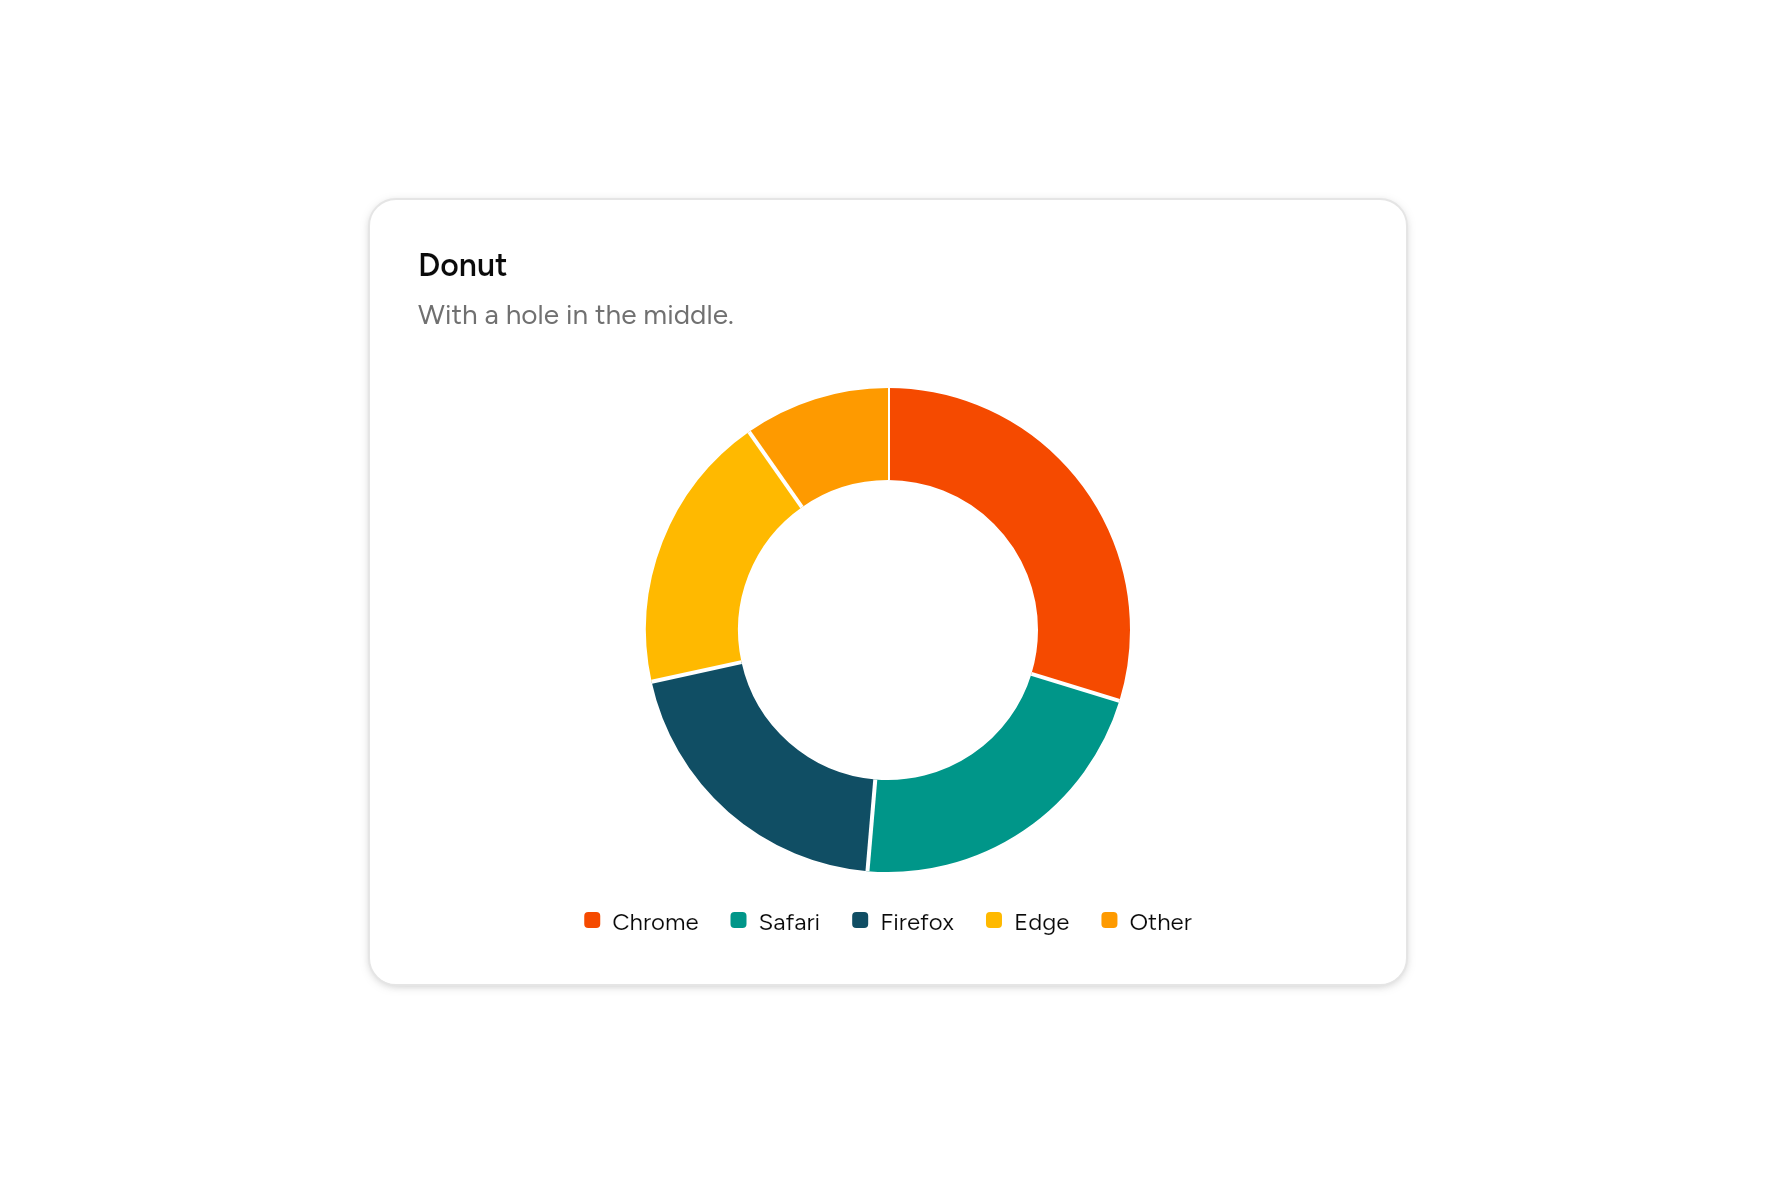
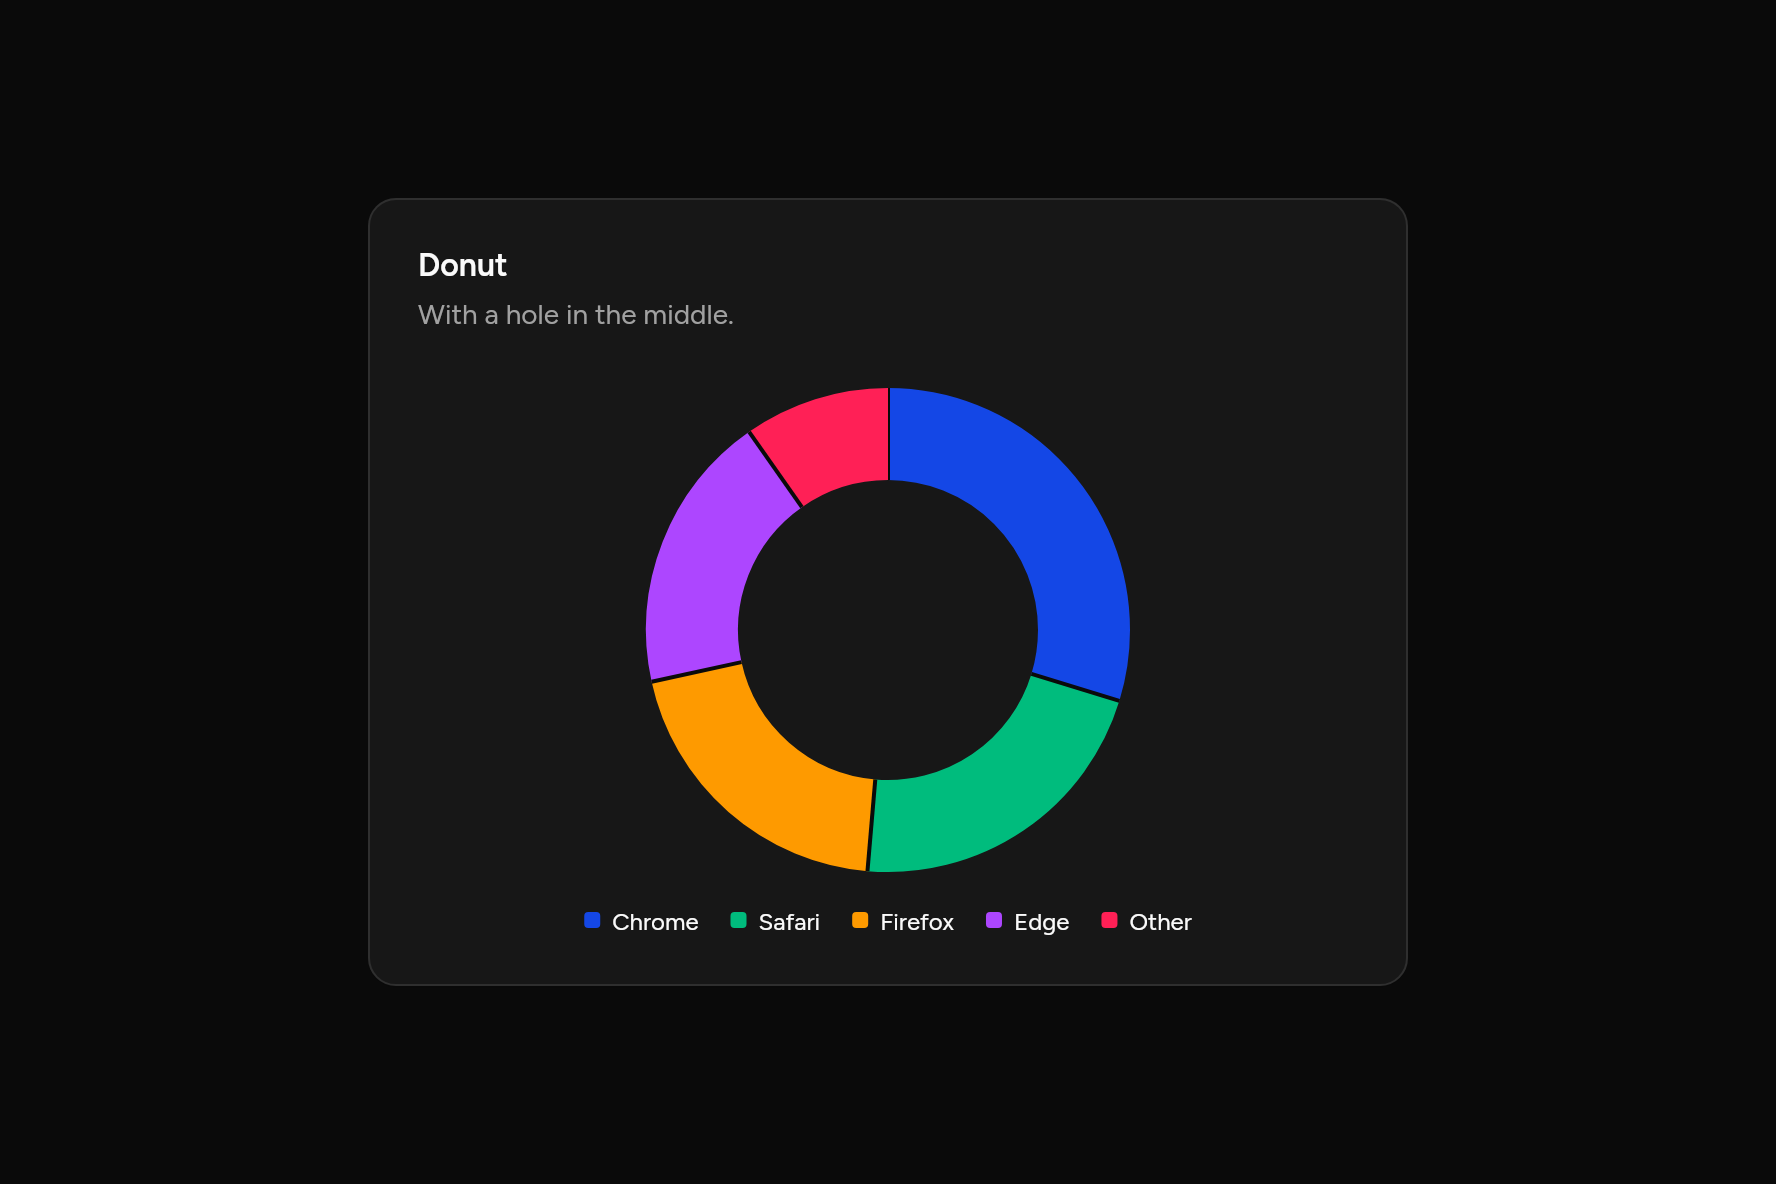
Donut
With a hole in the middle.
Code
// Donut: With a hole in the middle. Sample data.
import 'package:flutter/widgets.dart';

import 'ui/card.dart';
import 'ui/chart.dart';

class PieDonutChart extends StatelessWidget {
  const PieDonutChart({super.key});

  @override
  Widget build(BuildContext context) => SizedBox(
    width: 520,
    child: Card(
      children: [
        const CardHeader(
          title: Text("Donut"),
          description: Text("With a hole in the middle."),
        ),
        CardContent(
          child: PieChart(
            slices: const [
              ChartSlice('Chrome', 275),
              ChartSlice('Safari', 200),
              ChartSlice('Firefox', 187),
              ChartSlice('Edge', 173),
              ChartSlice('Other', 90),
            ],
          ),
        ),
      ],
    ),
  );
}
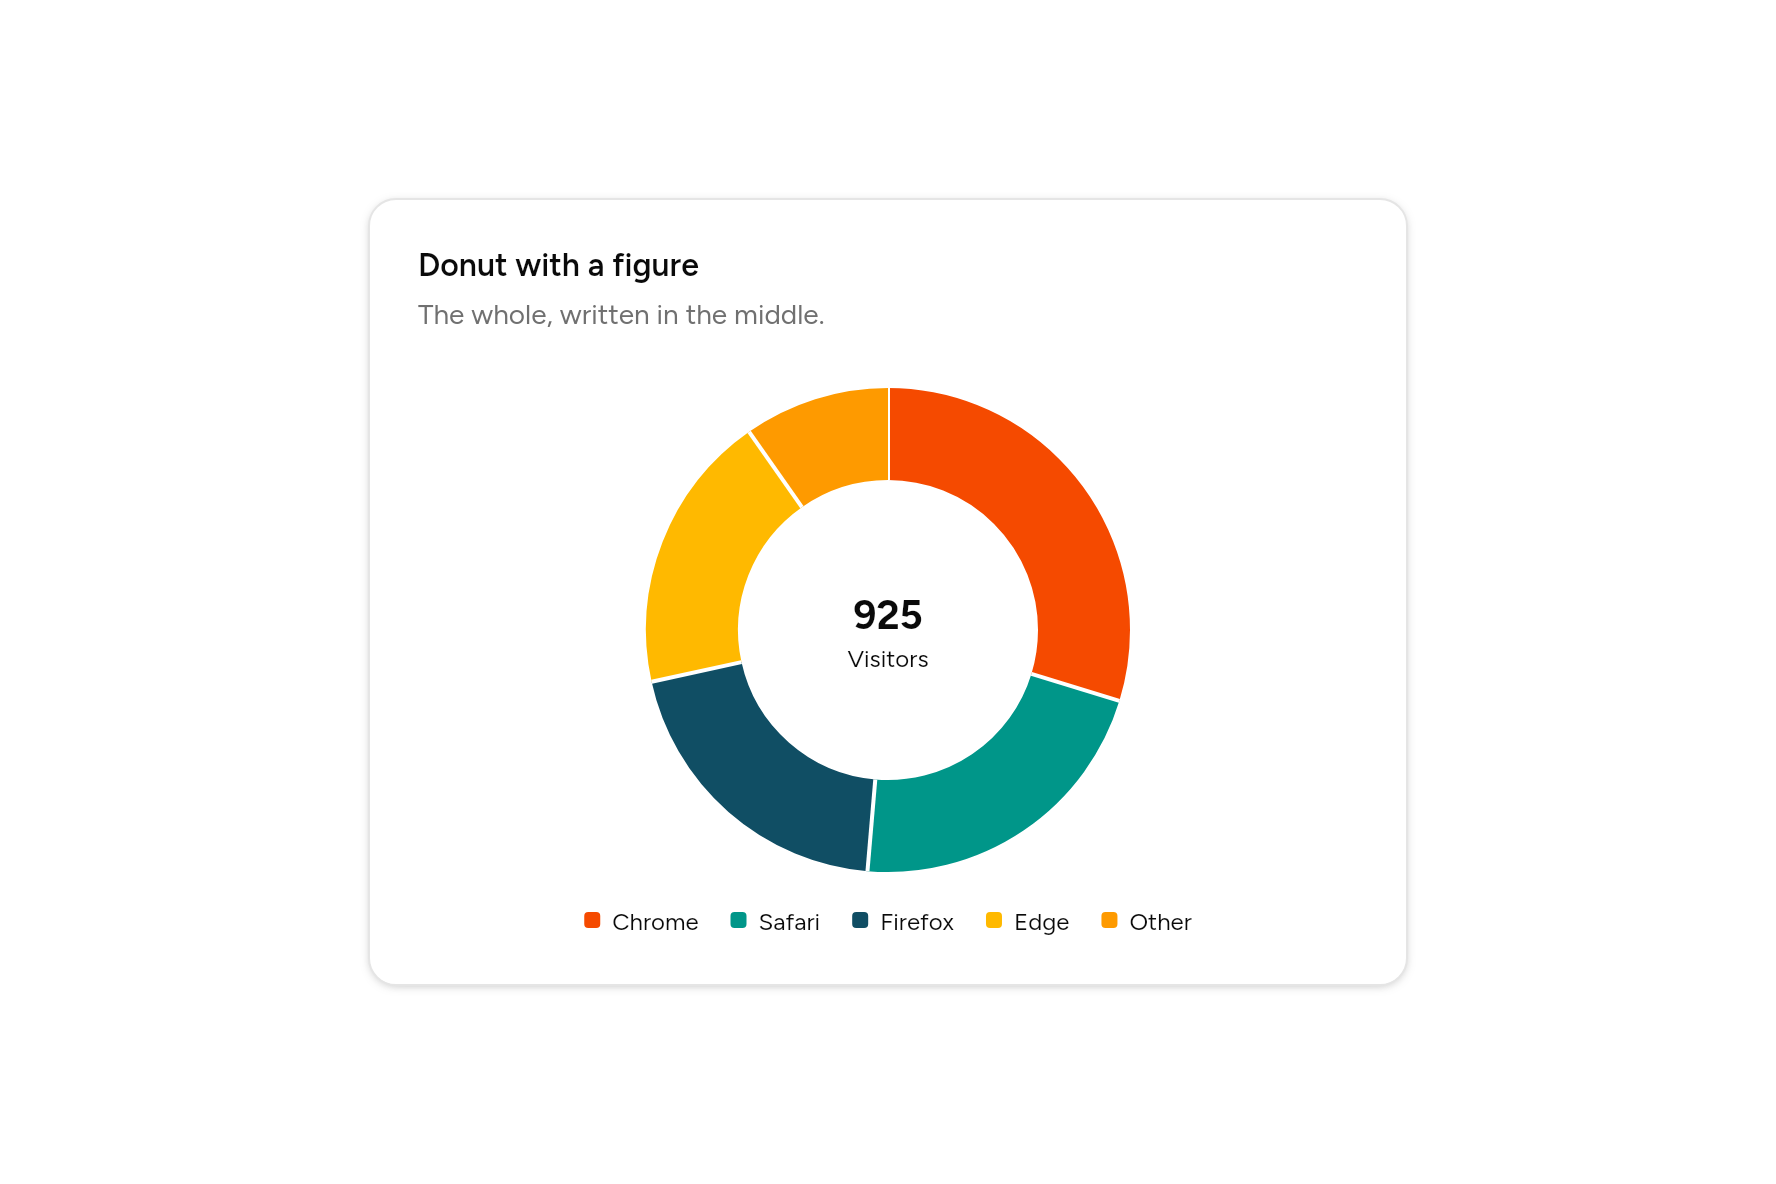
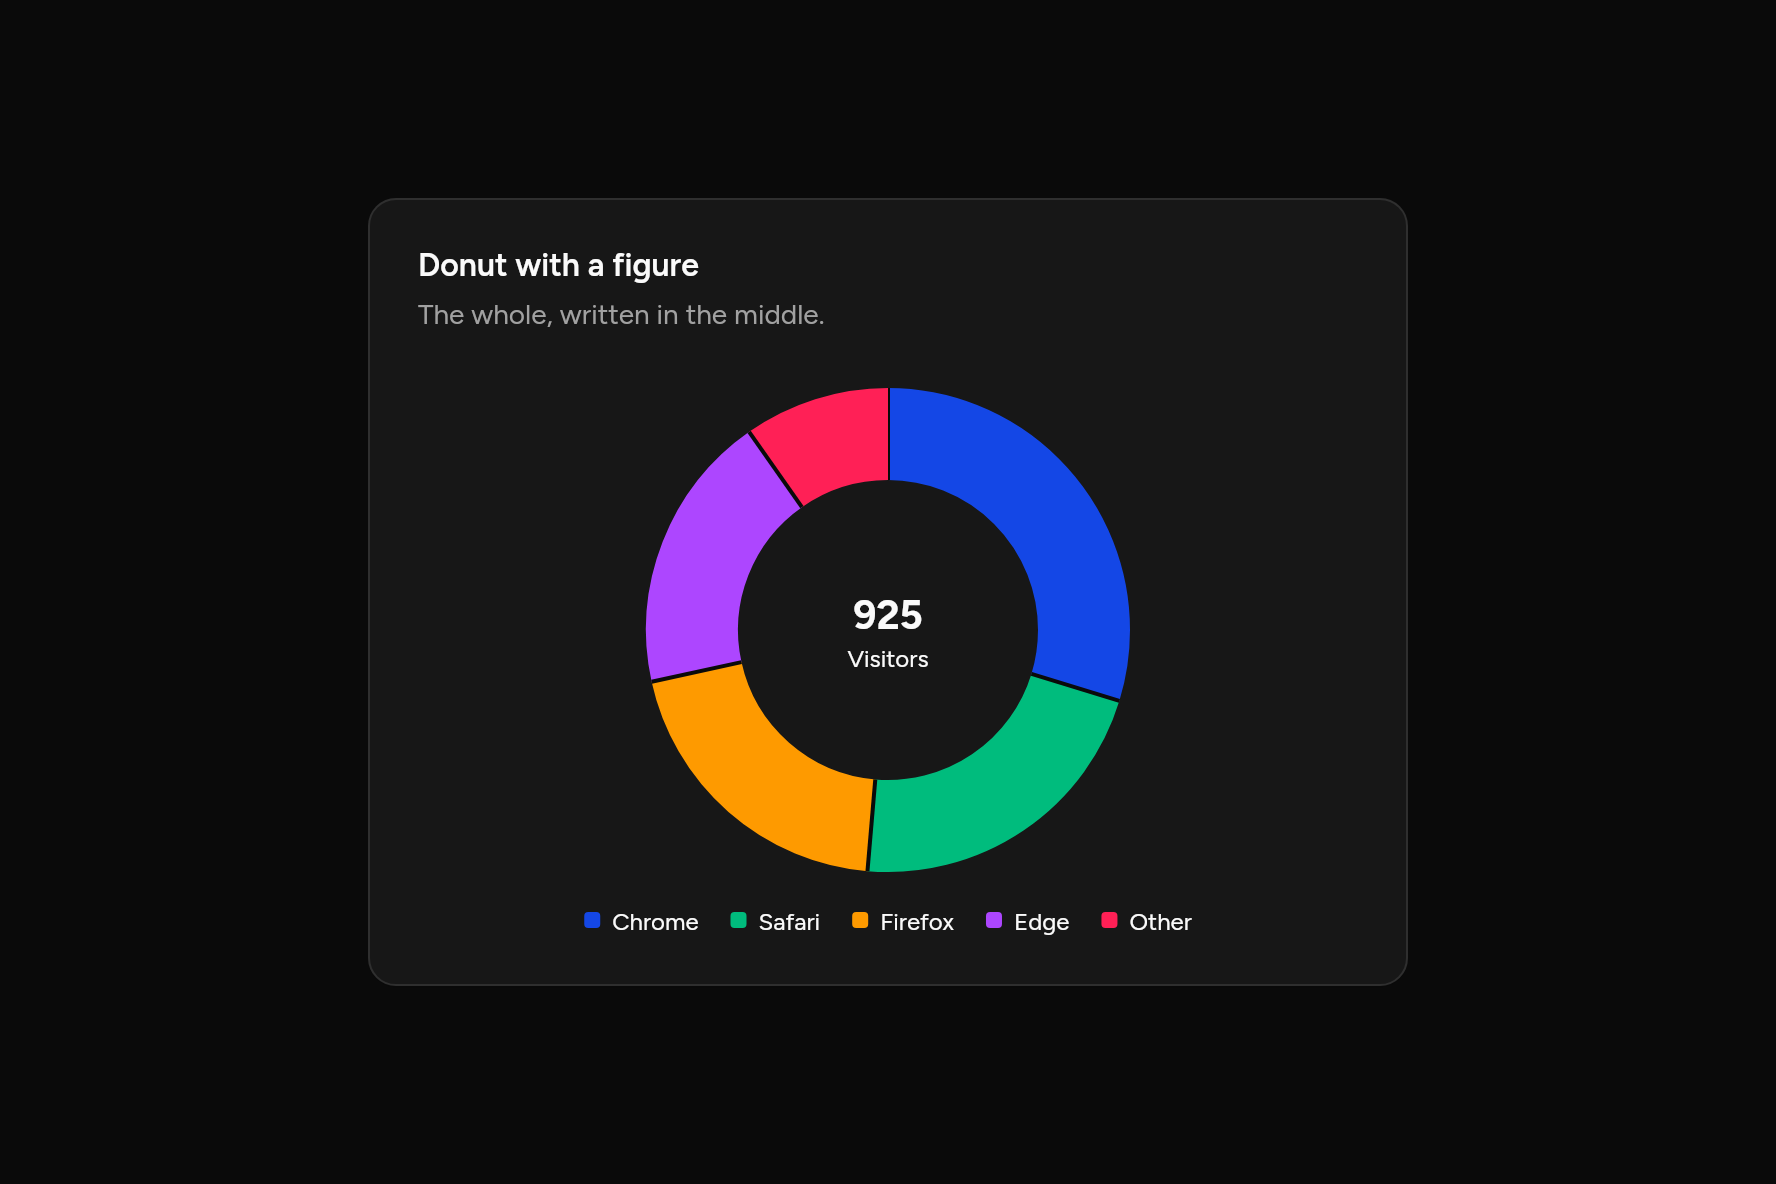
Donut with a figure
The whole, written in the middle.
Code
// Donut with a figure: The whole, written in the middle. Sample data.
import 'package:flutter/widgets.dart';

import 'ui/card.dart';
import 'ui/chart.dart';

class PieDonutTextChart extends StatelessWidget {
  const PieDonutTextChart({super.key});

  @override
  Widget build(BuildContext context) => SizedBox(
    width: 520,
    child: Card(
      children: [
        const CardHeader(
          title: Text("Donut with a figure"),
          description: Text("The whole, written in the middle."),
        ),
        CardContent(
          child: PieChart(
            slices: const [
              ChartSlice('Chrome', 275),
              ChartSlice('Safari', 200),
              ChartSlice('Firefox', 187),
              ChartSlice('Edge', 173),
              ChartSlice('Other', 90),
            ],
            center: const Column(
              mainAxisSize: MainAxisSize.min,
              children: [
                Text('925'),
                Text('Visitors', style: TextStyle(fontSize: 12, fontWeight: FontWeight.w400)),
              ],
            ),
          ),
        ),
      ],
    ),
  );
}
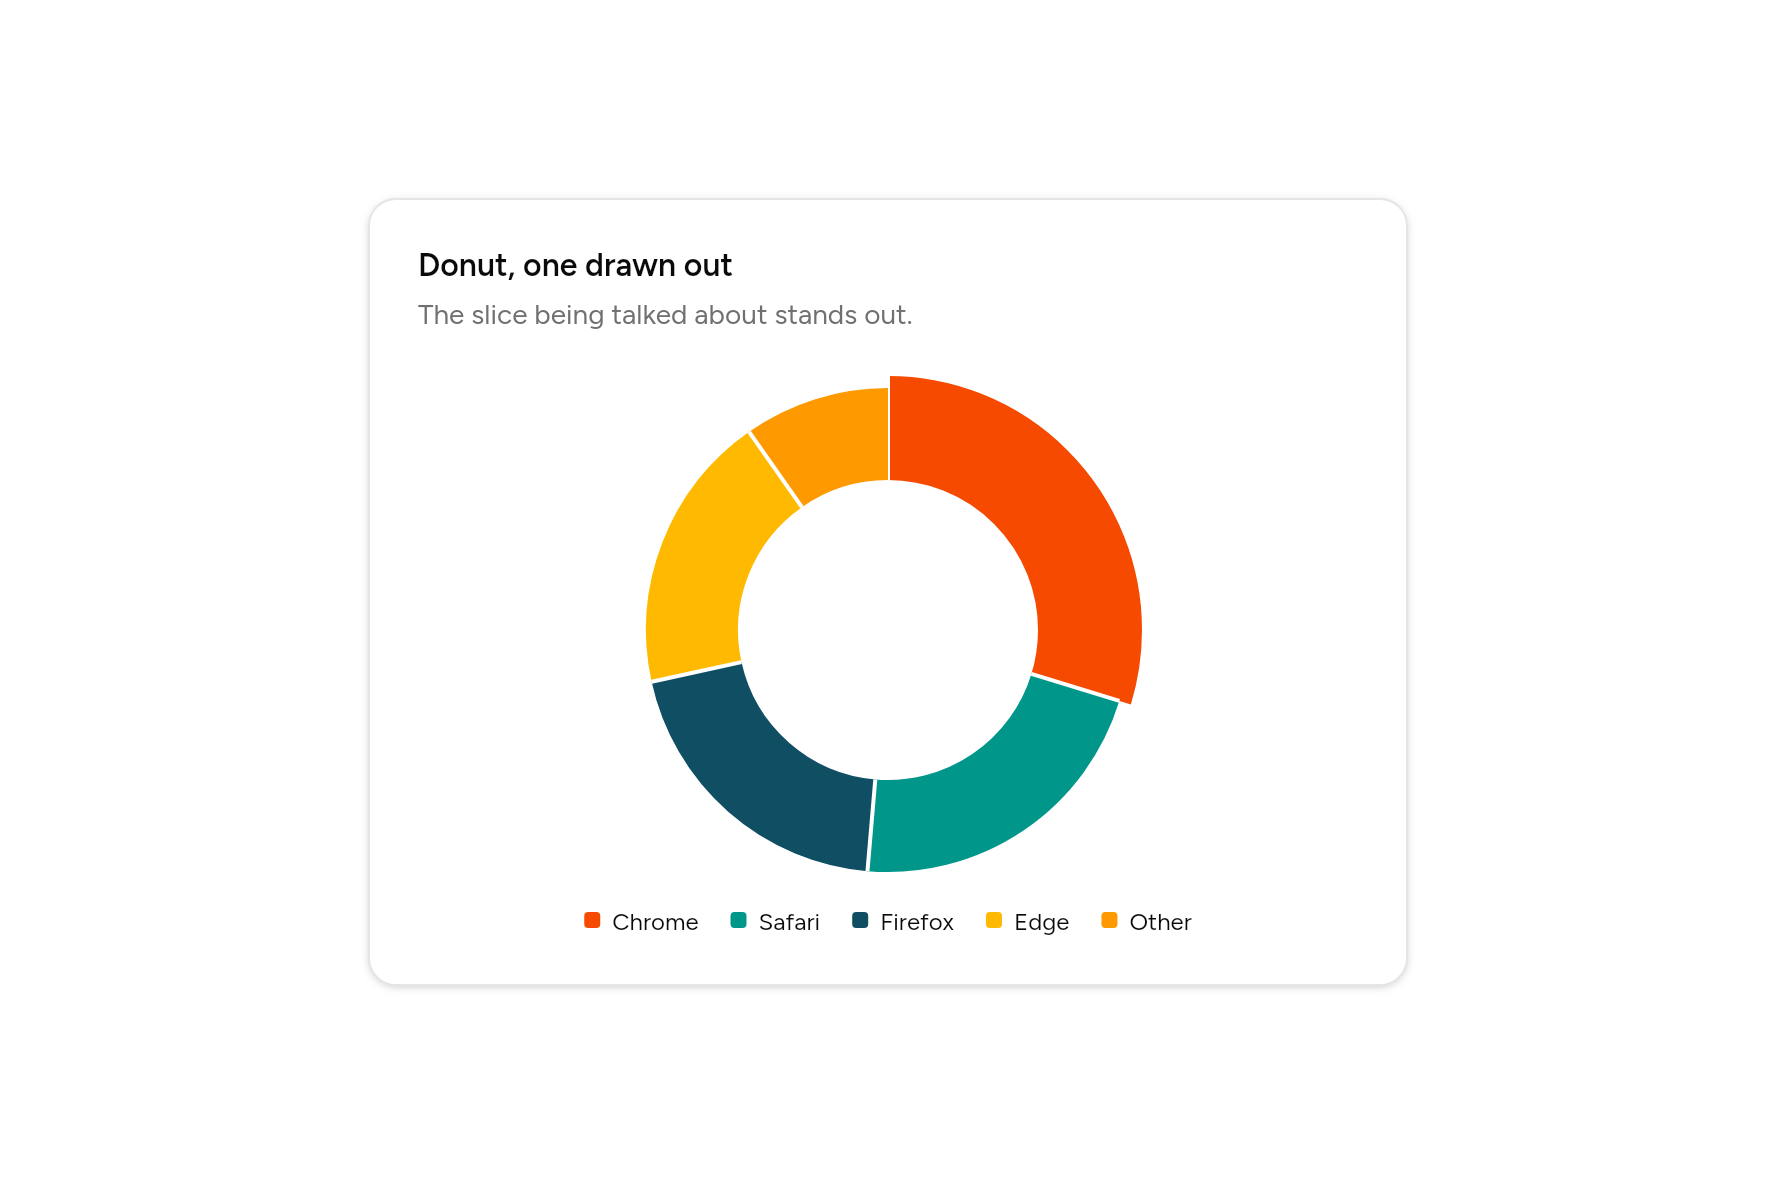
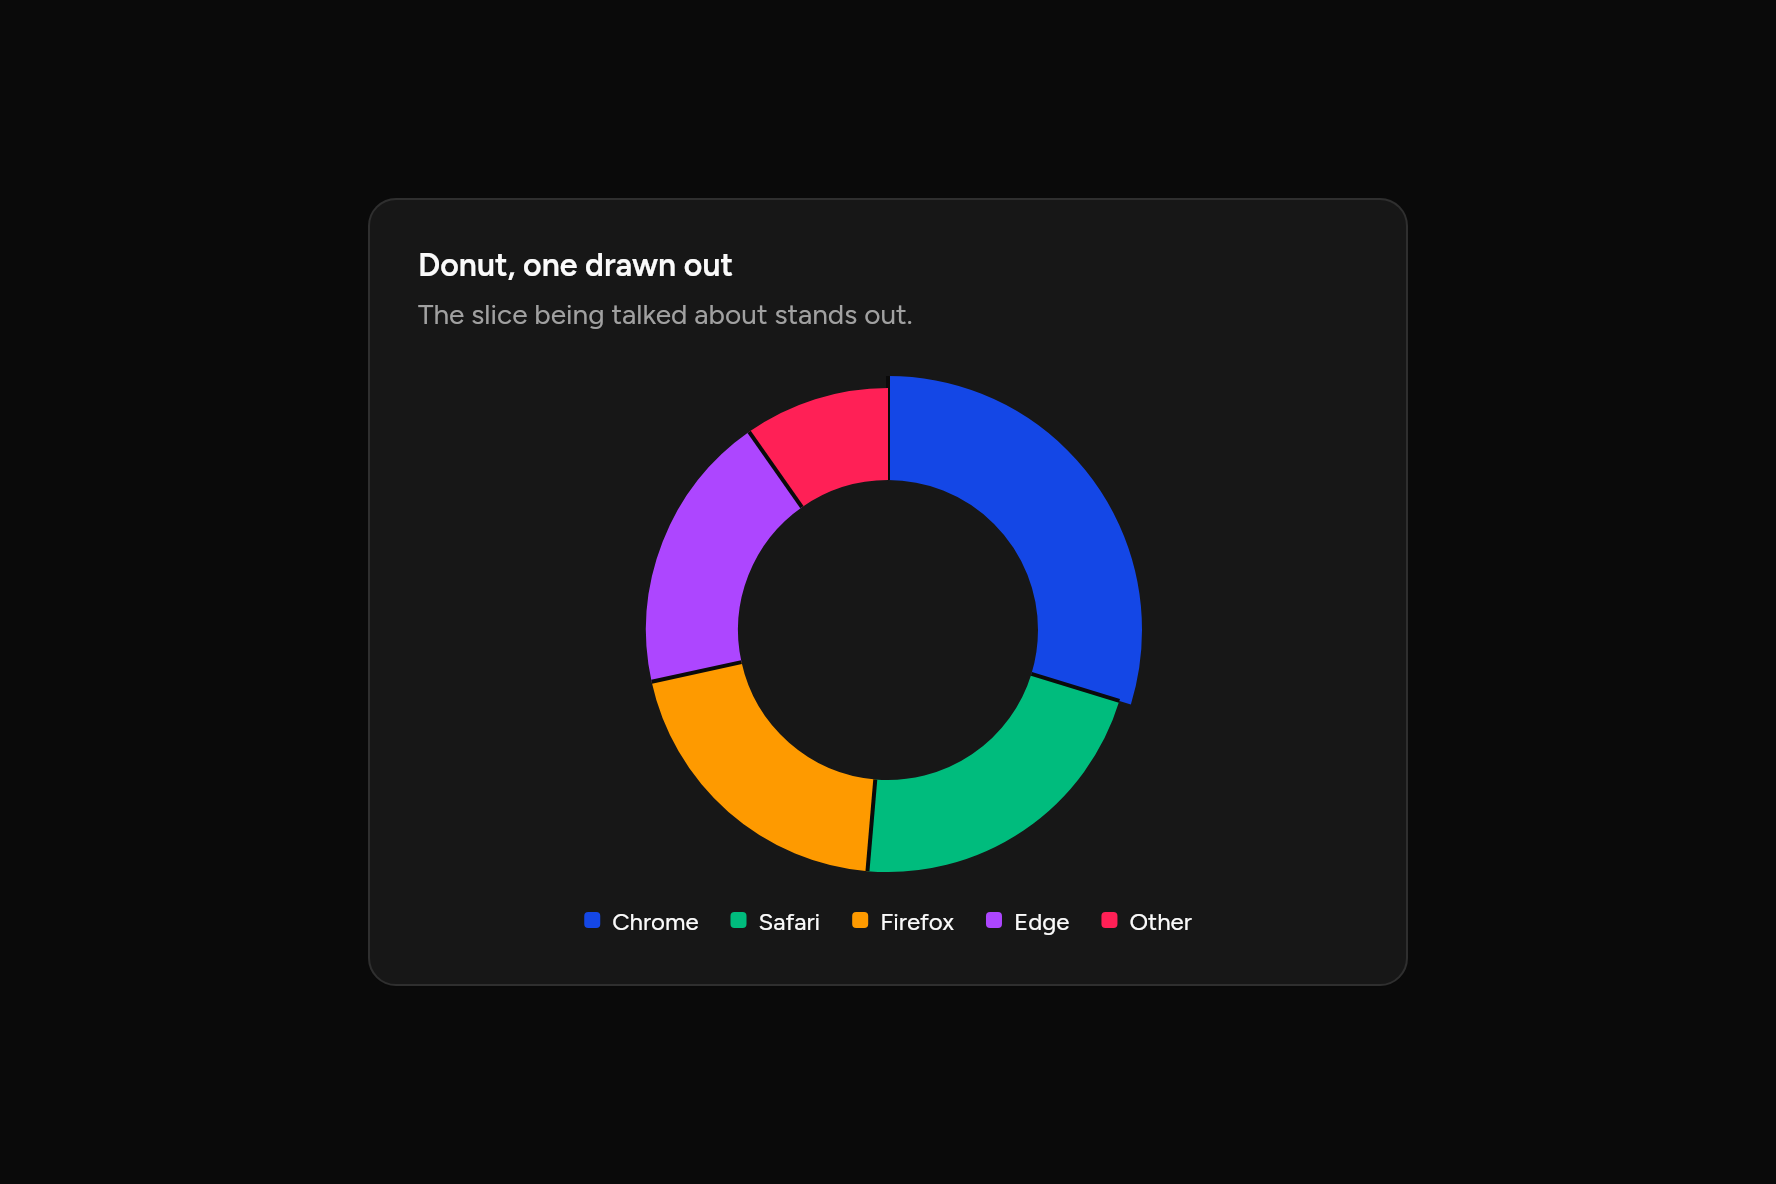
Donut, one drawn out
The slice being talked about stands out.
Code
// Donut, one drawn out: The slice being talked about stands out. Sample data.
import 'package:flutter/widgets.dart';

import 'ui/card.dart';
import 'ui/chart.dart';

class PieActiveChart extends StatelessWidget {
  const PieActiveChart({super.key});

  @override
  Widget build(BuildContext context) => SizedBox(
    width: 520,
    child: Card(
      children: [
        const CardHeader(
          title: Text("Donut, one drawn out"),
          description: Text("The slice being talked about stands out."),
        ),
        CardContent(
          child: PieChart(
            slices: const [
              ChartSlice('Chrome', 275),
              ChartSlice('Safari', 200),
              ChartSlice('Firefox', 187),
              ChartSlice('Edge', 173),
              ChartSlice('Other', 90),
            ],
            active: 0,
          ),
        ),
      ],
    ),
  );
}
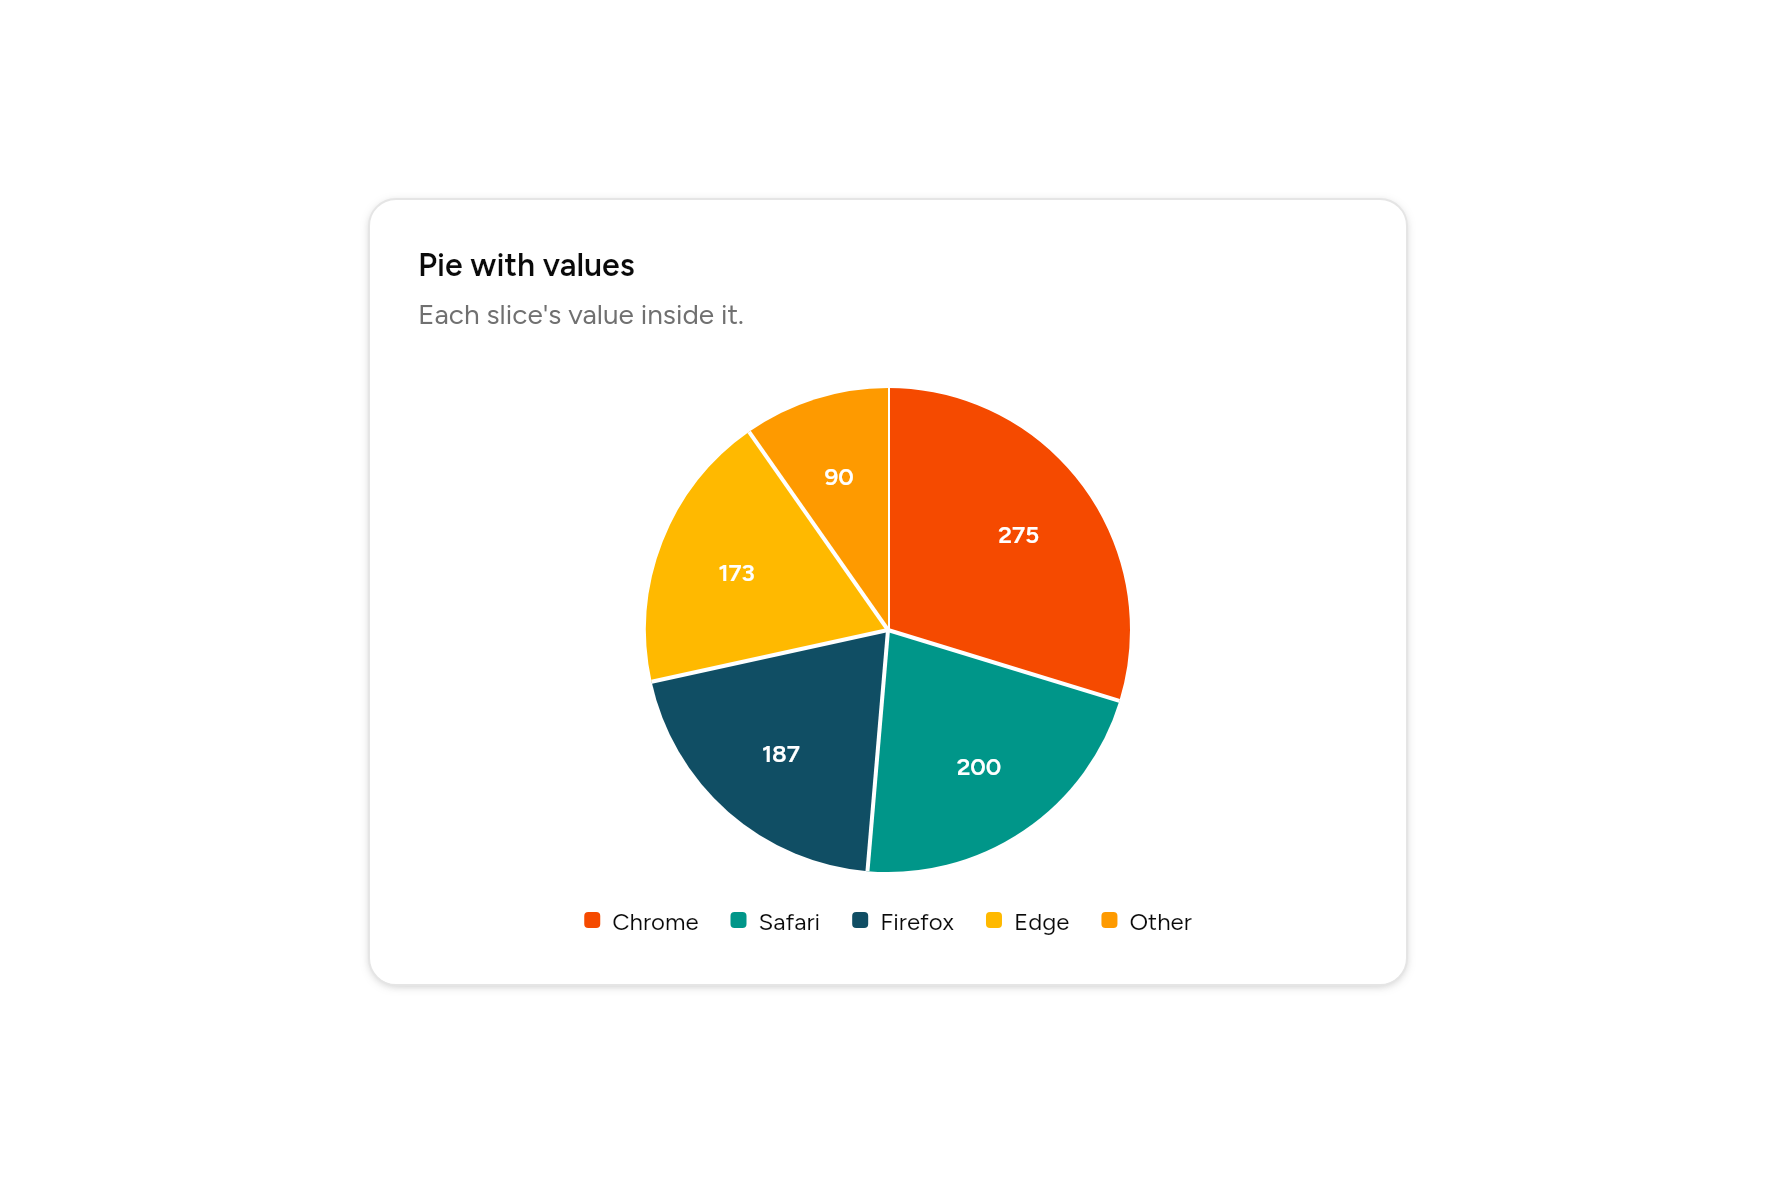
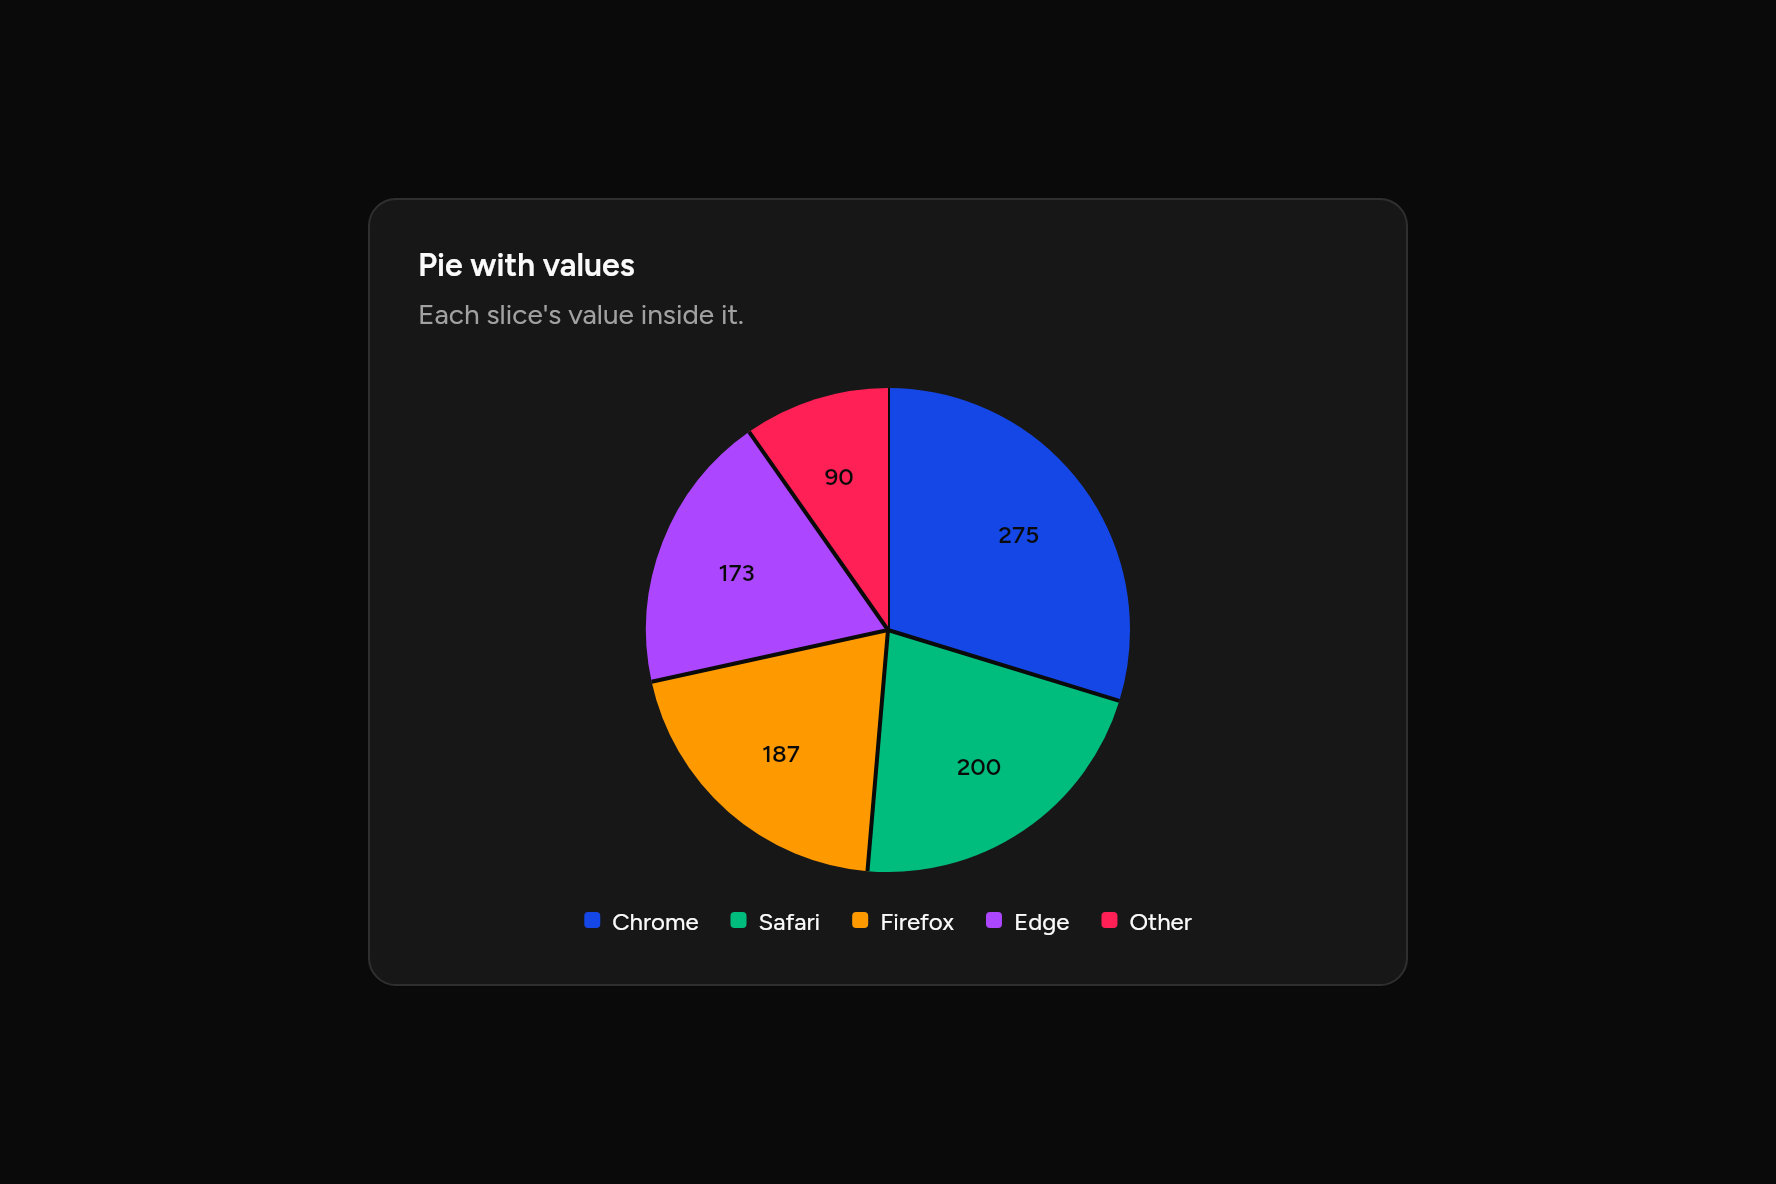
Pie with values
Each slice's value inside it.
Code
// Pie with values: Each slice's value inside it. Sample data.
import 'package:flutter/widgets.dart';

import 'ui/card.dart';
import 'ui/chart.dart';

class PieLabelChart extends StatelessWidget {
  const PieLabelChart({super.key});

  @override
  Widget build(BuildContext context) => SizedBox(
    width: 520,
    child: Card(
      children: [
        const CardHeader(
          title: Text("Pie with values"),
          description: Text("Each slice's value inside it."),
        ),
        CardContent(
          child: PieChart(
            slices: const [
              ChartSlice('Chrome', 275),
              ChartSlice('Safari', 200),
              ChartSlice('Firefox', 187),
              ChartSlice('Edge', 173),
              ChartSlice('Other', 90),
            ],
            donut: false,
            labels: PieLabels.amounts,
          ),
        ),
      ],
    ),
  );
}
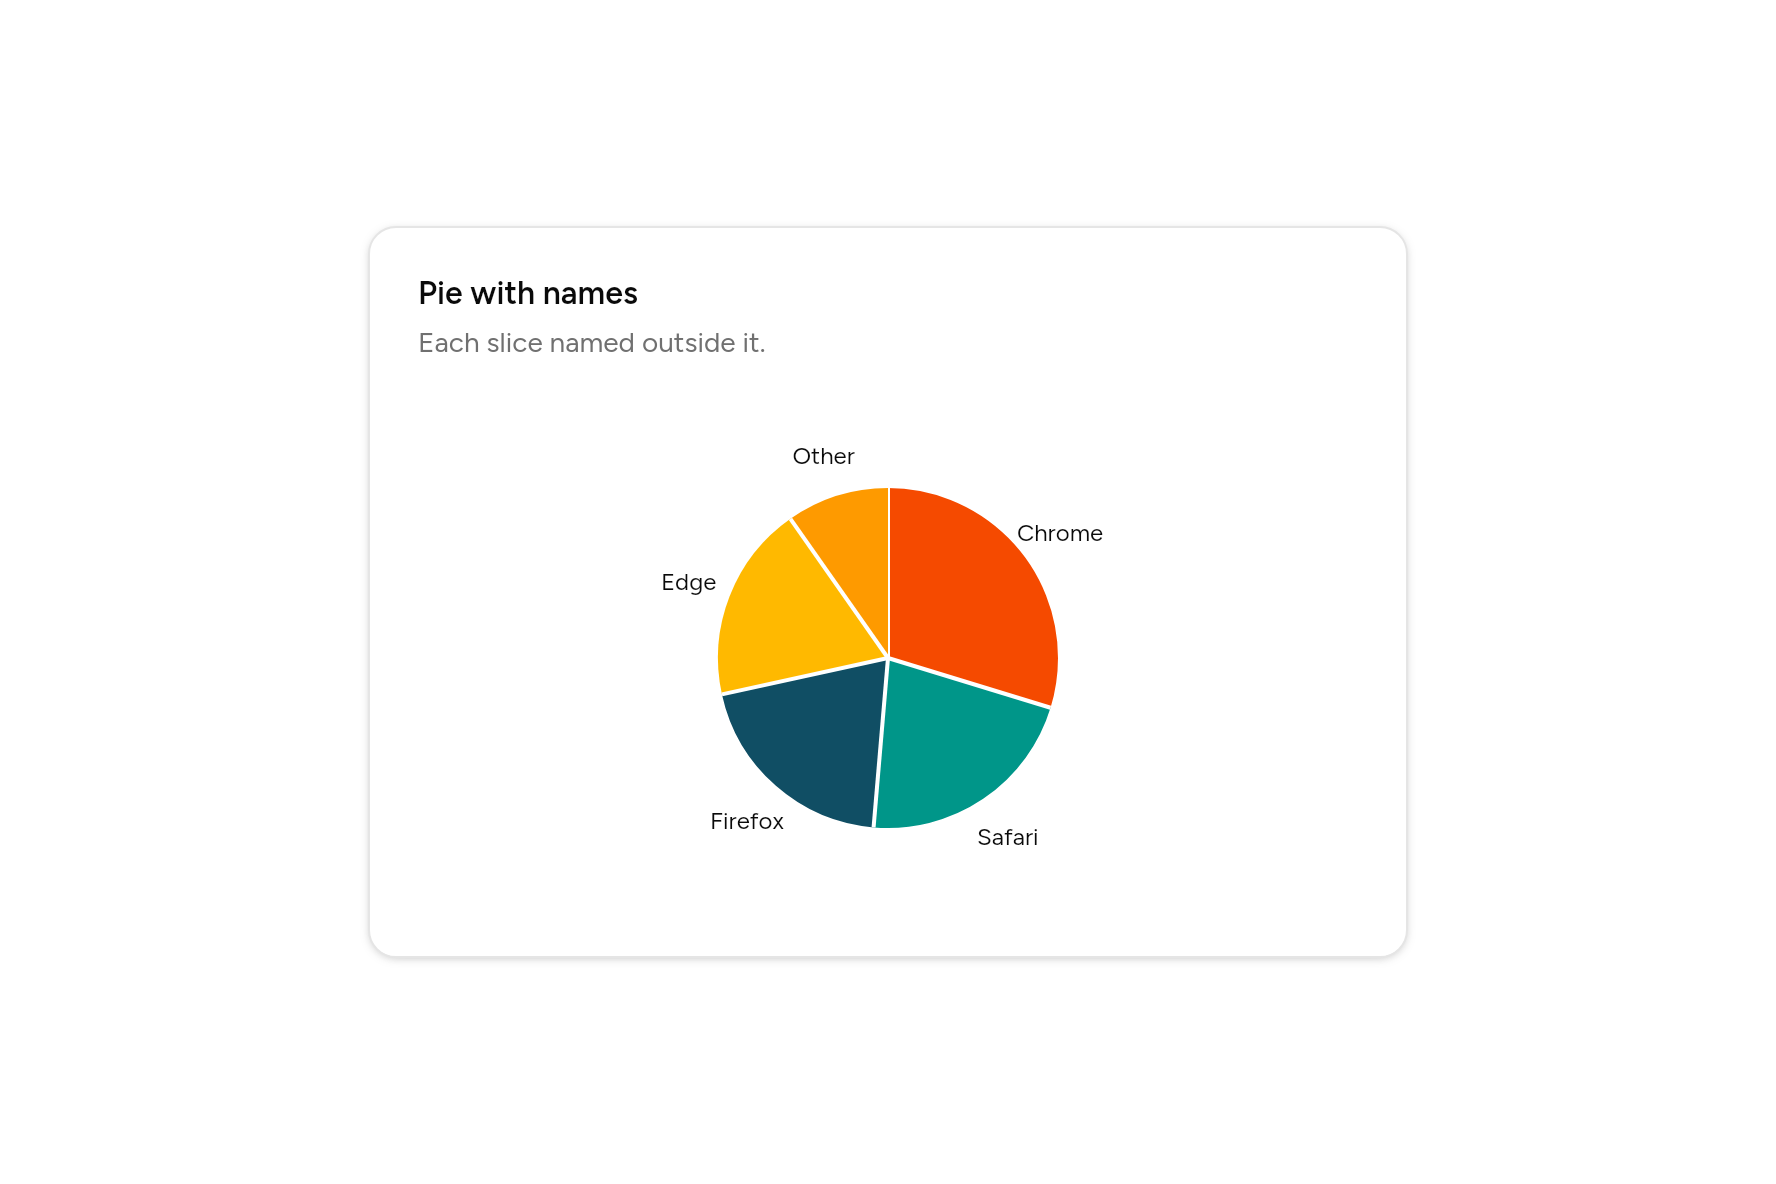
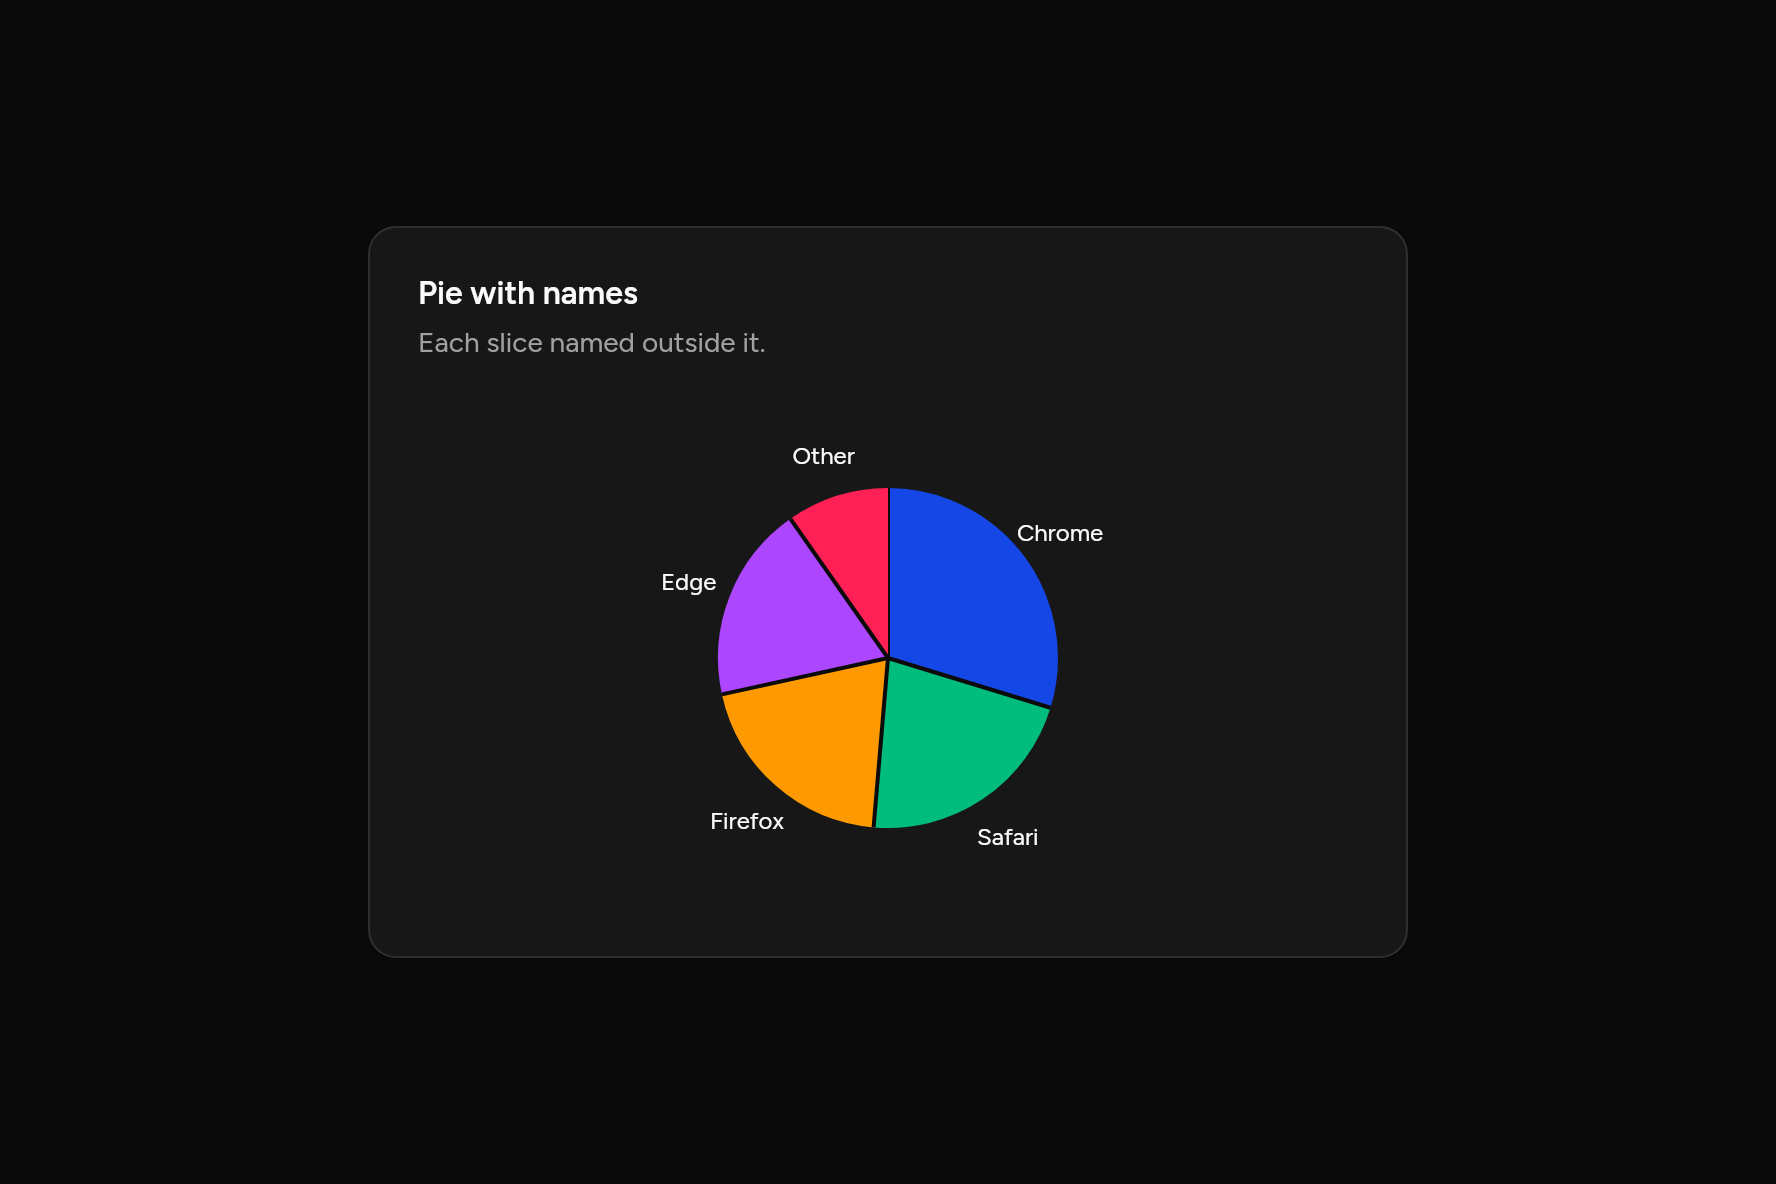
Pie with names
Each slice named outside it.
Code
// Pie with names: Each slice named outside it. Sample data.
import 'package:flutter/widgets.dart';

import 'ui/card.dart';
import 'ui/chart.dart';

class PieLabelListChart extends StatelessWidget {
  const PieLabelListChart({super.key});

  @override
  Widget build(BuildContext context) => SizedBox(
    width: 520,
    child: Card(
      children: [
        const CardHeader(
          title: Text("Pie with names"),
          description: Text("Each slice named outside it."),
        ),
        CardContent(
          child: PieChart(
            slices: const [
              ChartSlice('Chrome', 275),
              ChartSlice('Safari', 200),
              ChartSlice('Firefox', 187),
              ChartSlice('Edge', 173),
              ChartSlice('Other', 90),
            ],
            donut: false,
            labels: PieLabels.titles,
            legend: ChartLegend.none,
          ),
        ),
      ],
    ),
  );
}
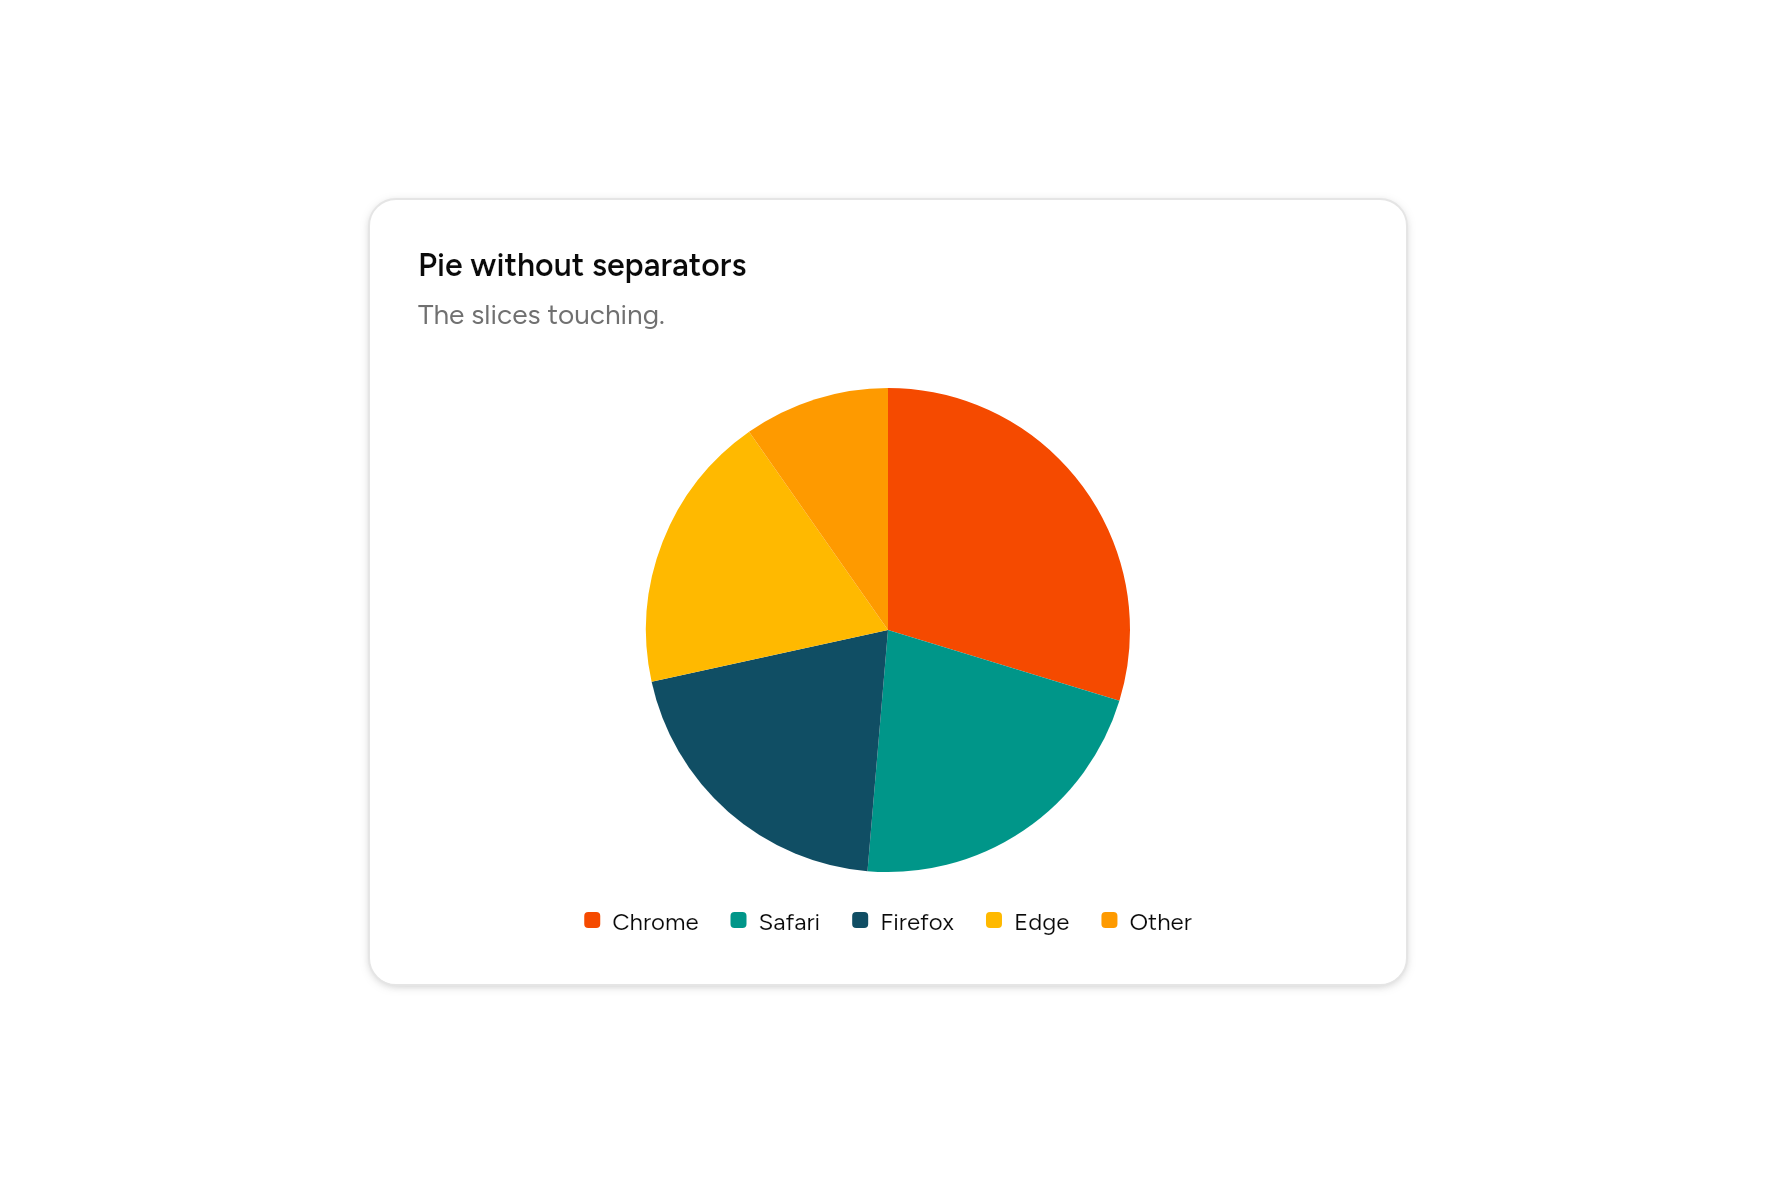
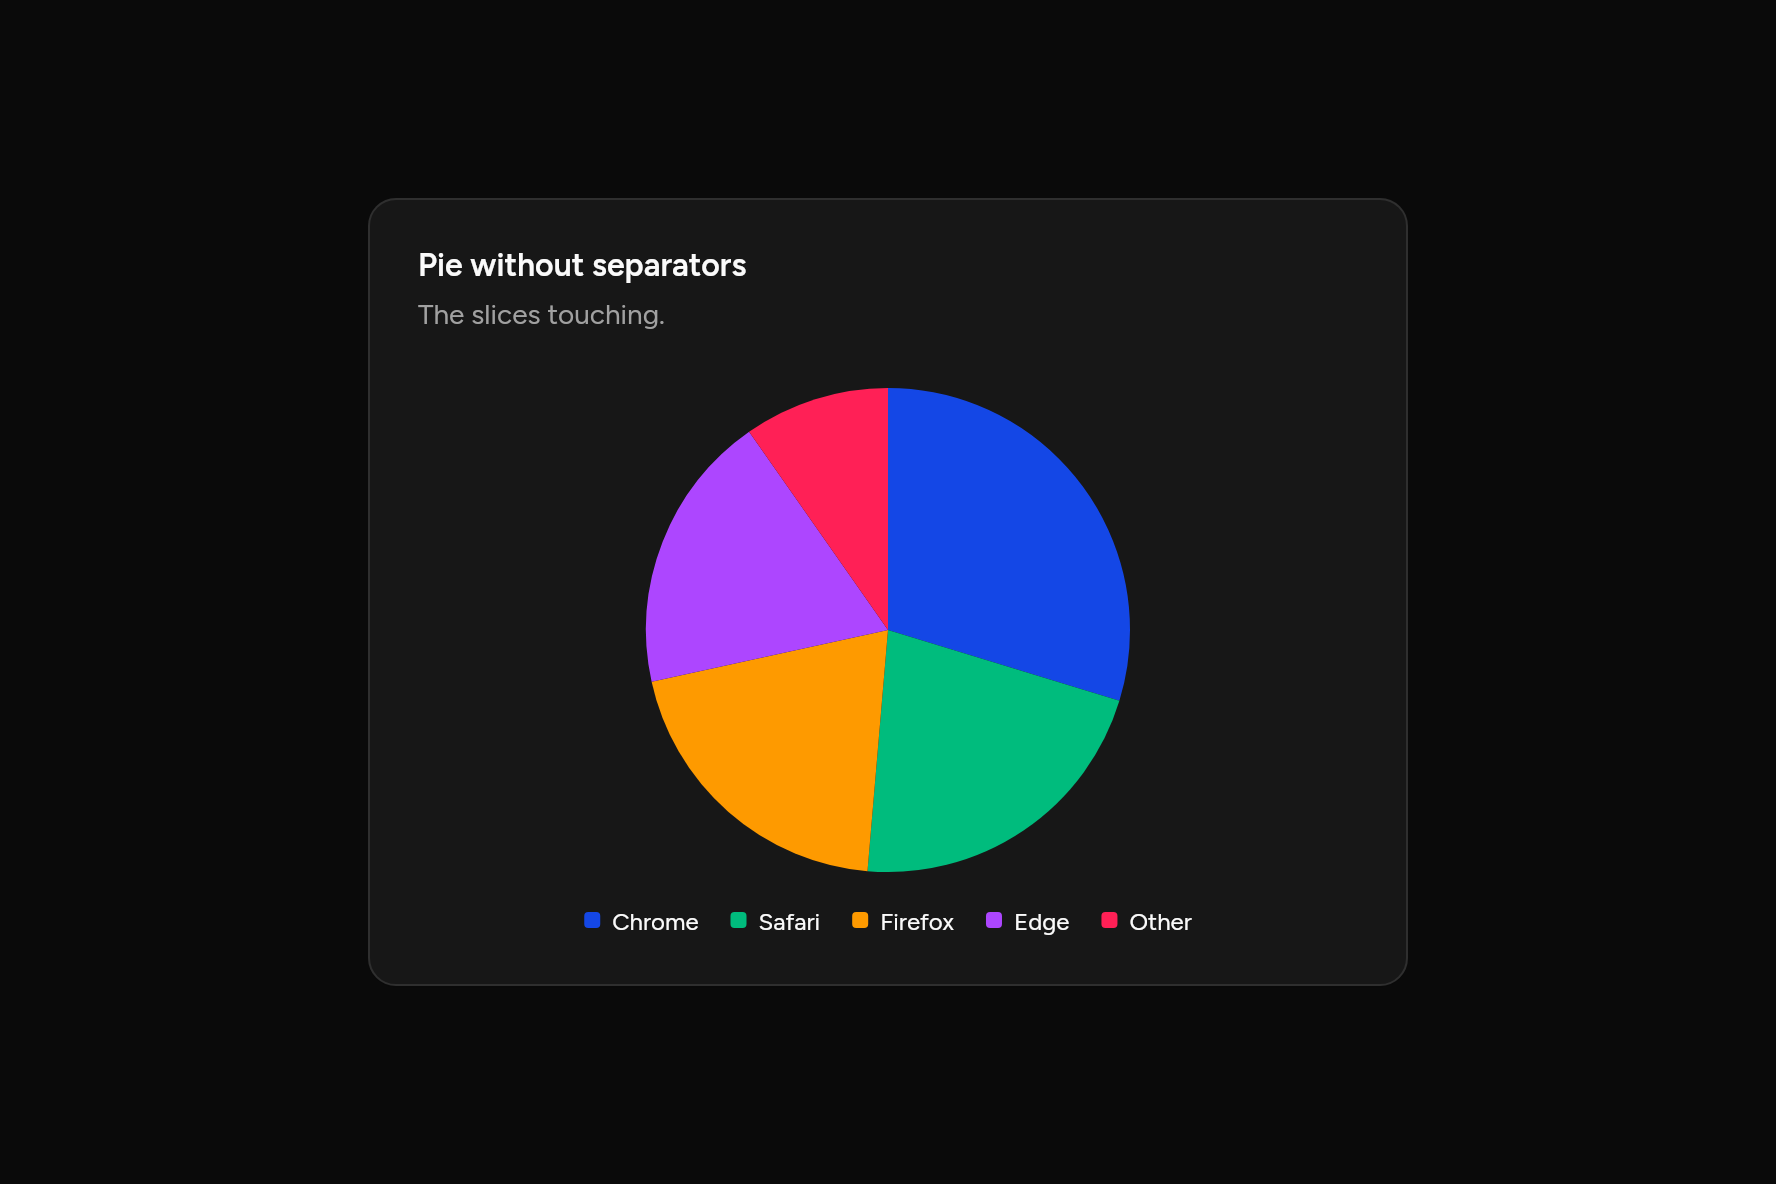
Pie without separators
The slices touching.
Code
// Pie without separators: The slices touching. Sample data.
import 'package:flutter/widgets.dart';

import 'ui/card.dart';
import 'ui/chart.dart';

class PieSeparatorNoneChart extends StatelessWidget {
  const PieSeparatorNoneChart({super.key});

  @override
  Widget build(BuildContext context) => SizedBox(
    width: 520,
    child: Card(
      children: [
        const CardHeader(
          title: Text("Pie without separators"),
          description: Text("The slices touching."),
        ),
        CardContent(
          child: PieChart(
            slices: const [
              ChartSlice('Chrome', 275),
              ChartSlice('Safari', 200),
              ChartSlice('Firefox', 187),
              ChartSlice('Edge', 173),
              ChartSlice('Other', 90),
            ],
            donut: false,
            separators: false,
          ),
        ),
      ],
    ),
  );
}
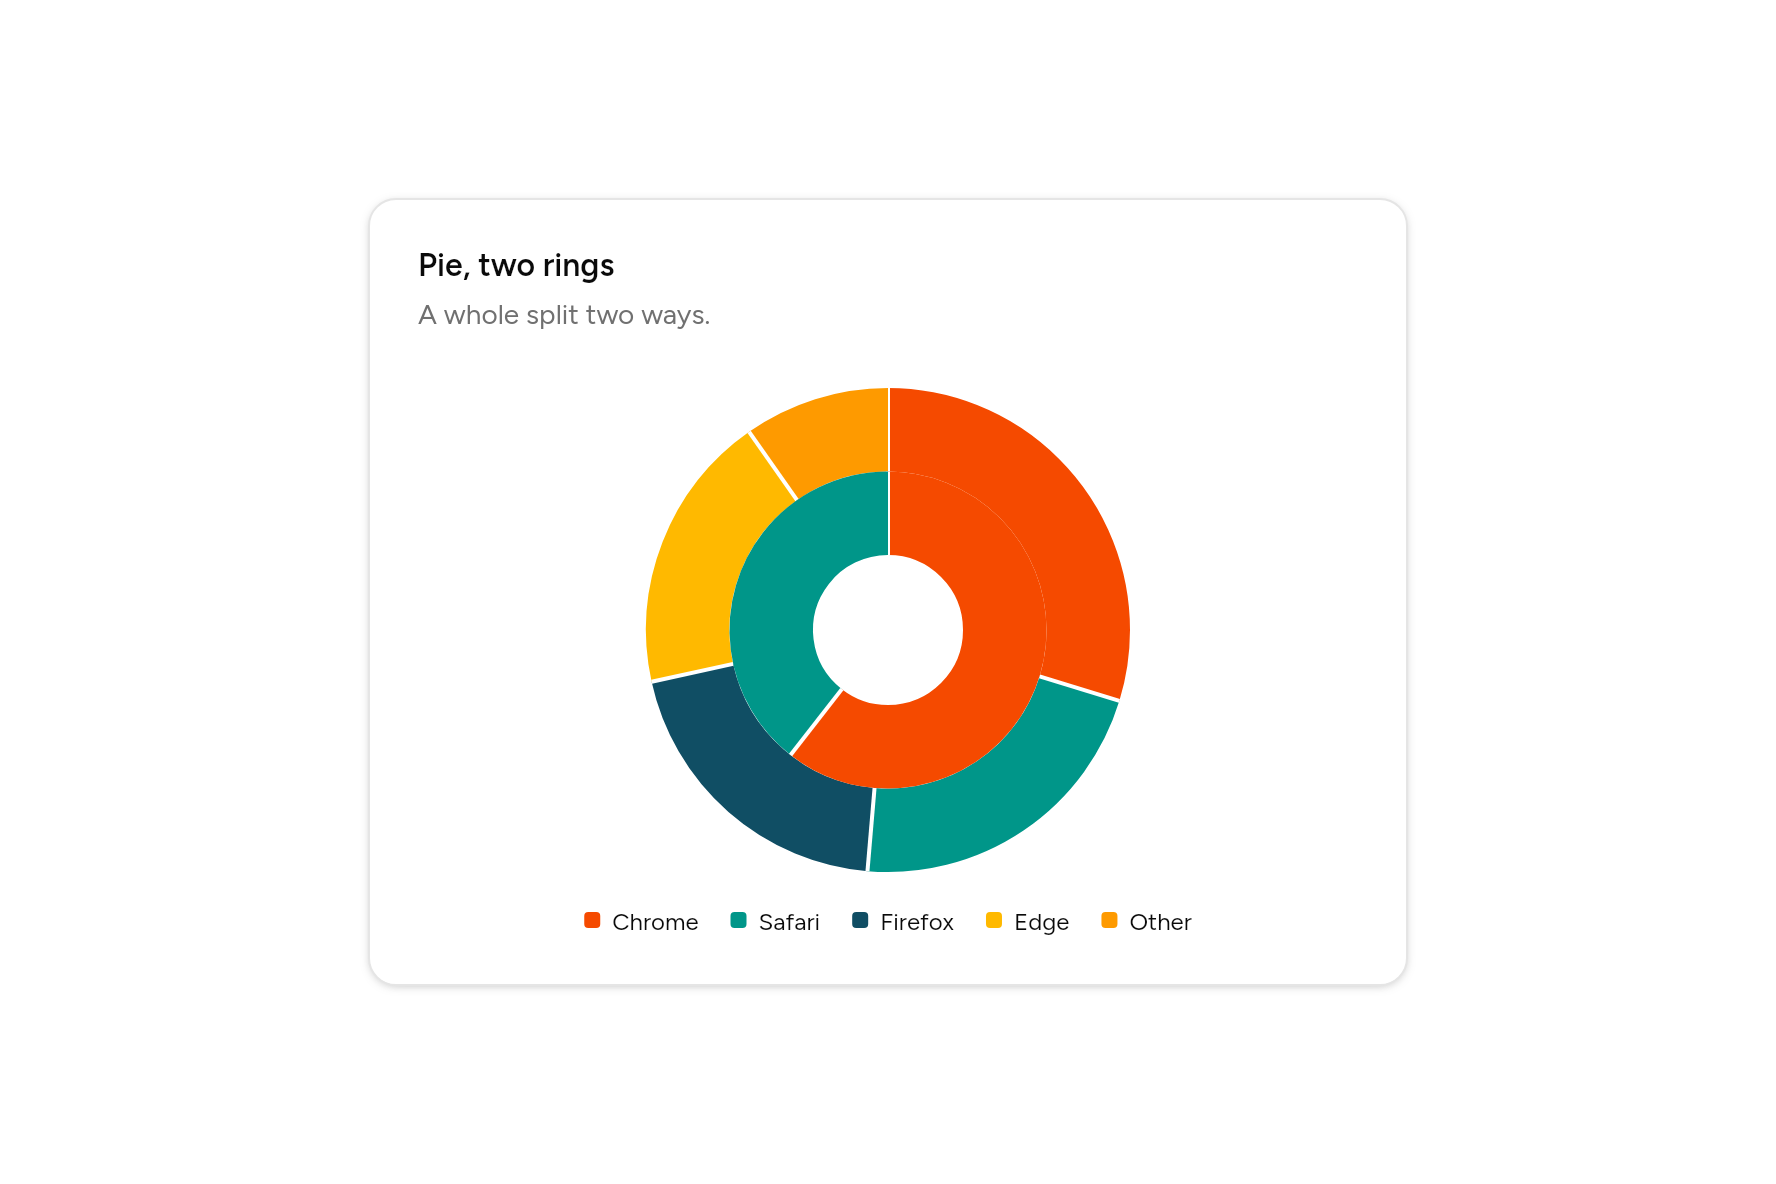
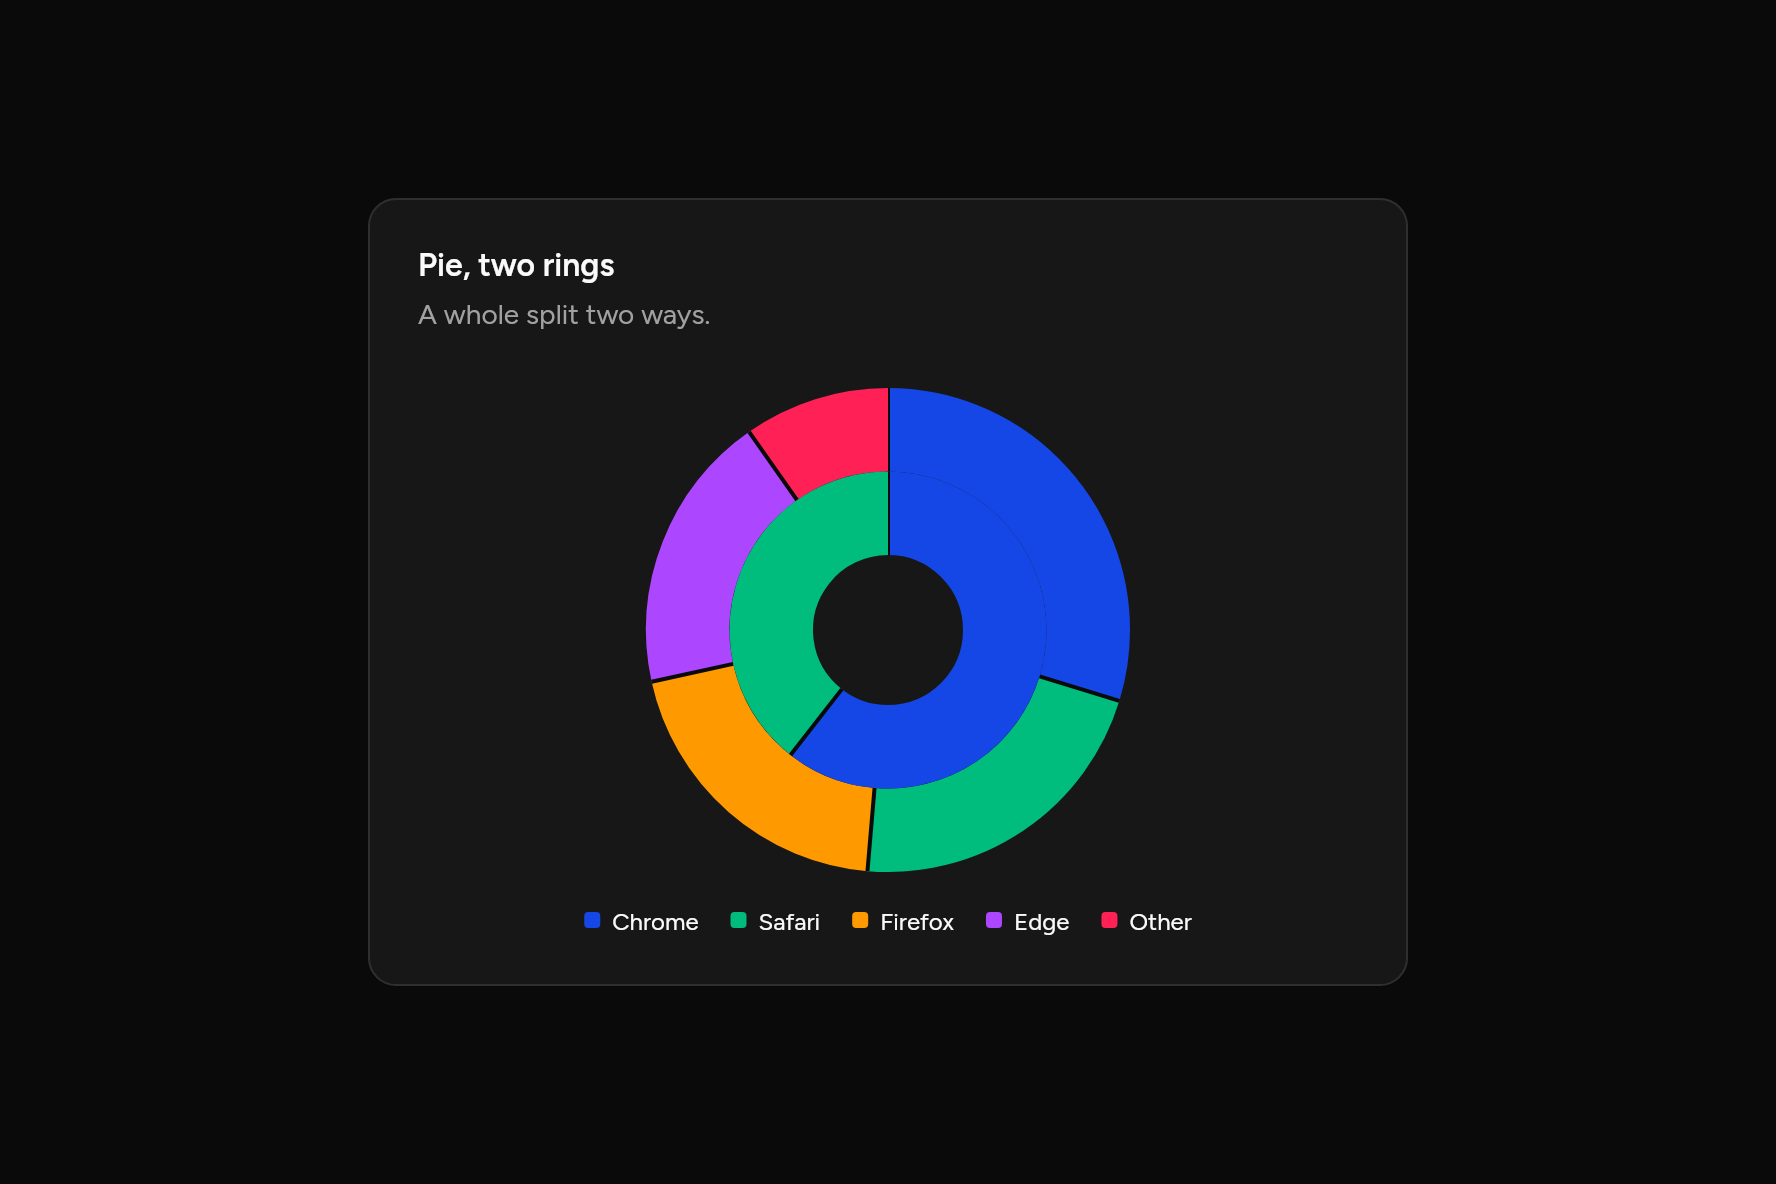
Pie, two rings
A whole split two ways.
Code
// Pie, two rings: A whole split two ways. Sample data.
import 'package:flutter/widgets.dart';

import 'ui/card.dart';
import 'ui/chart.dart';

class PieStackedChart extends StatelessWidget {
  const PieStackedChart({super.key});

  @override
  Widget build(BuildContext context) => SizedBox(
    width: 520,
    child: Card(
      children: [
        const CardHeader(
          title: Text("Pie, two rings"),
          description: Text("A whole split two ways."),
        ),
        CardContent(
          child: PieChart(
            slices: const [
              ChartSlice('Chrome', 275),
              ChartSlice('Safari', 200),
              ChartSlice('Firefox', 187),
              ChartSlice('Edge', 173),
              ChartSlice('Other', 90),
            ],
            donut: false,
            inner: const [ChartSlice('Desktop', 560), ChartSlice('Mobile', 365)],
          ),
        ),
      ],
    ),
  );
}
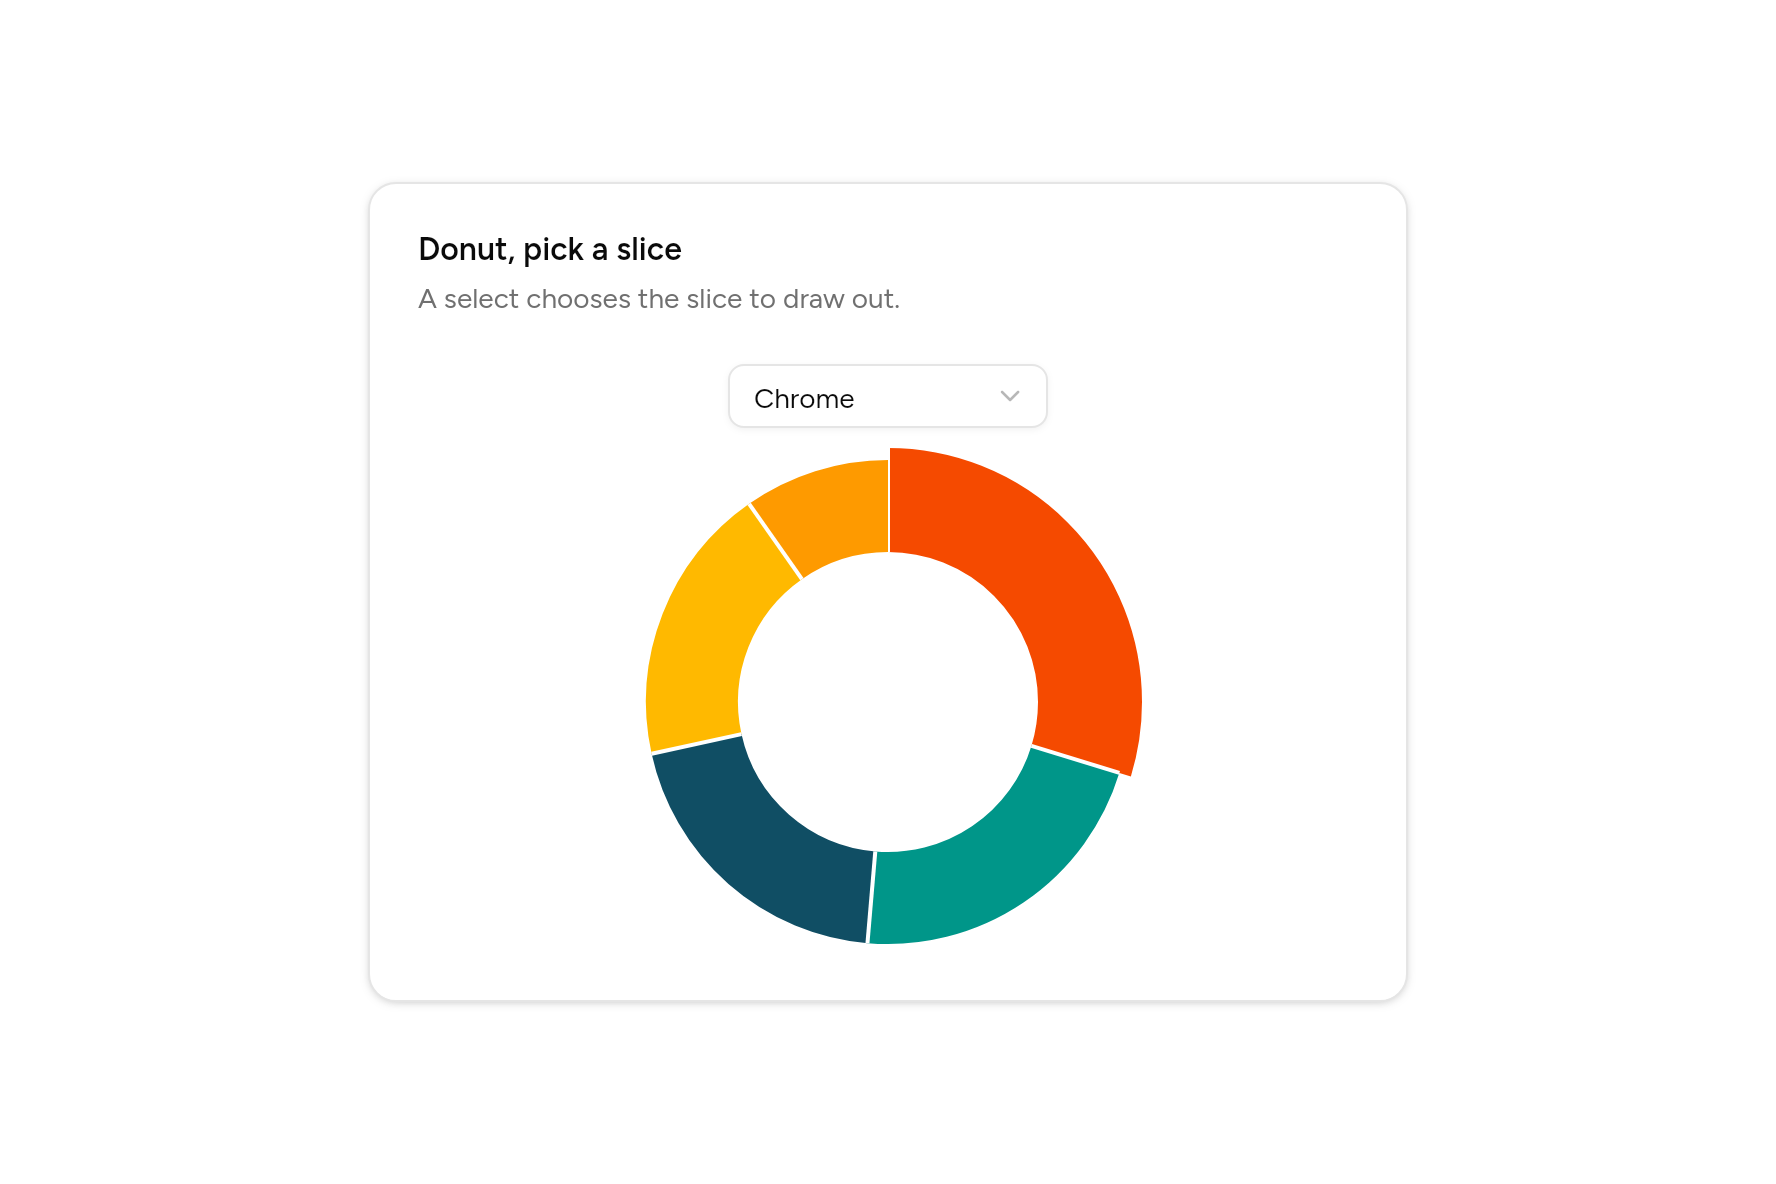
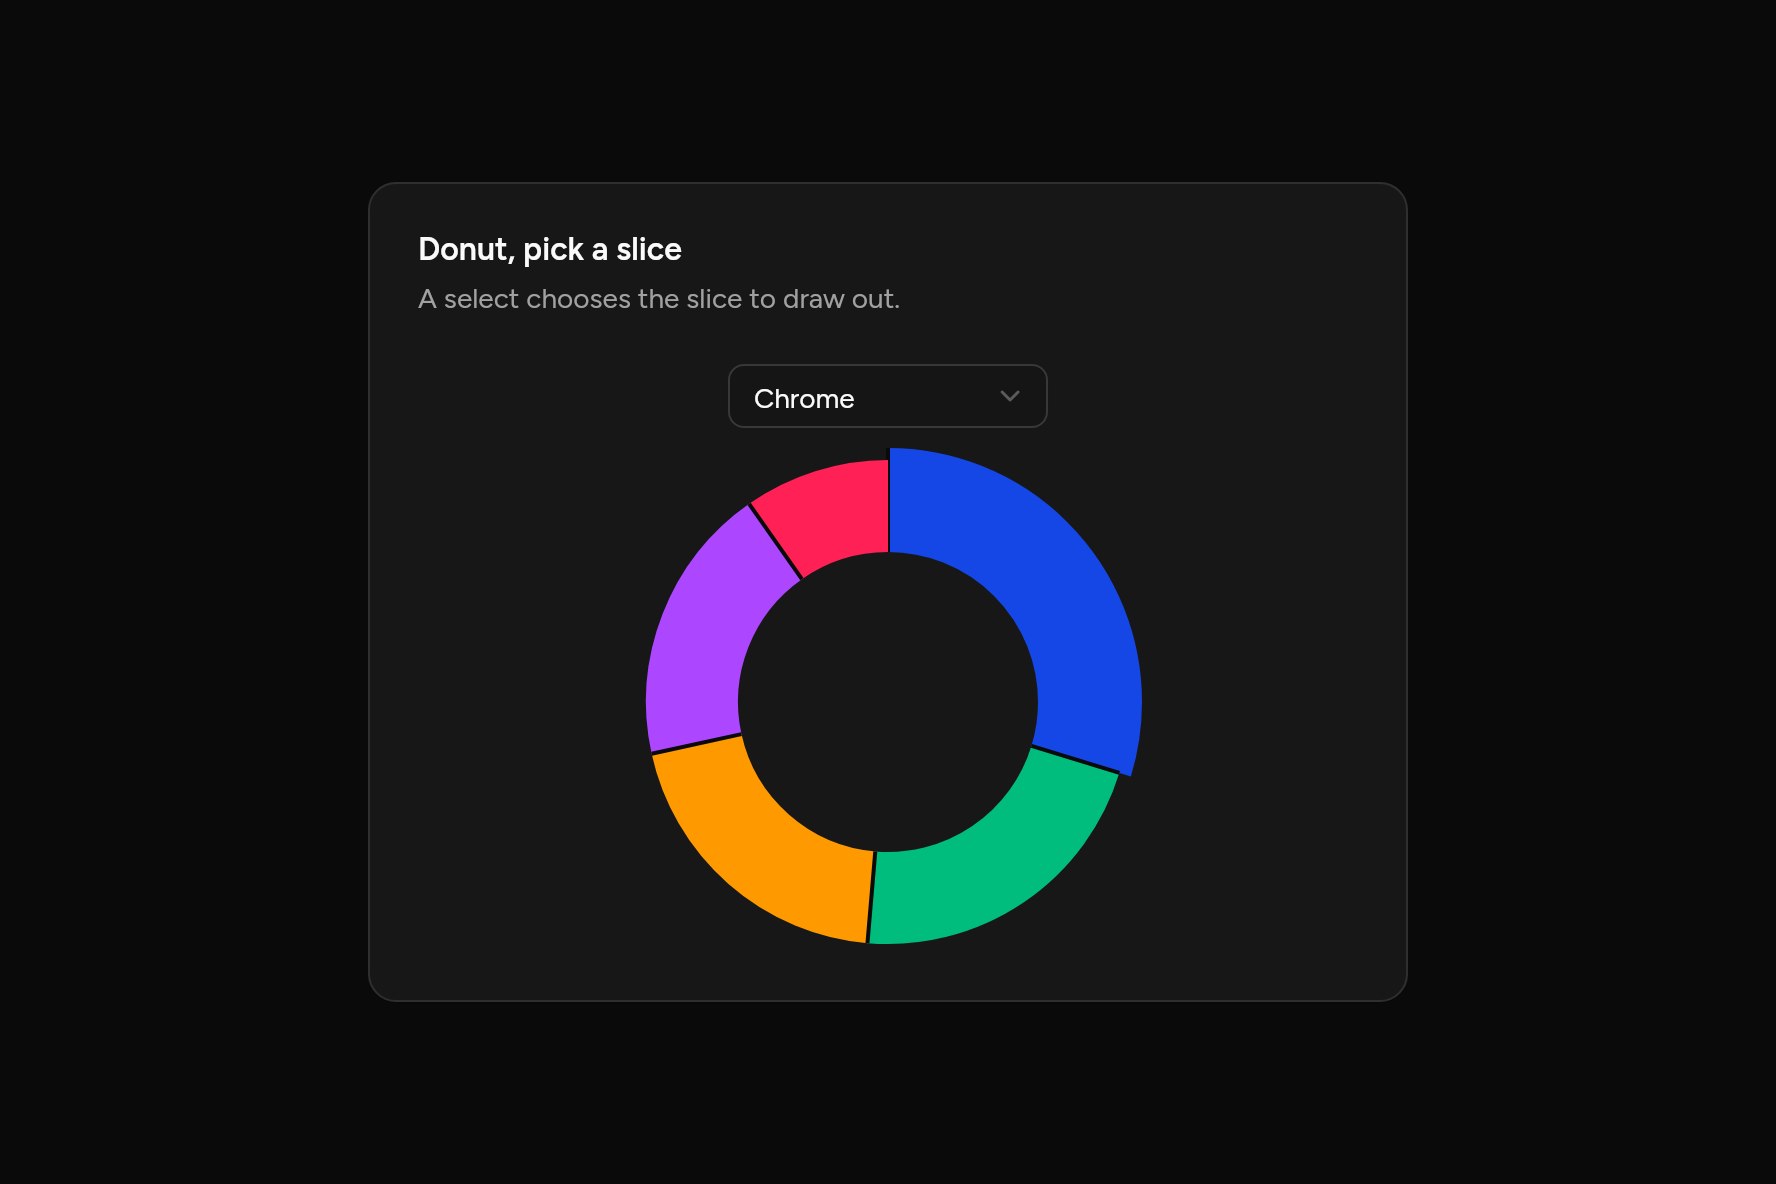
Donut, pick a slice
A select chooses the slice to draw out.
Code
// Donut, pick a slice: A select chooses the slice to draw out. Sample data.
import 'package:flutter/widgets.dart';

import 'ui/card.dart';
import 'ui/chart.dart';
import 'ui/select.dart';

class PieInteractiveChart extends StatefulWidget {
  const PieInteractiveChart({super.key});

  @override
  State<PieInteractiveChart> createState() => _PieInteractiveChartState();
}

class _PieInteractiveChartState extends State<PieInteractiveChart> {
  var picked = 0;

  @override
  Widget build(BuildContext context) => SizedBox(
    width: 520,
    child: Card(
      children: [
        const CardHeader(
          title: Text("Donut, pick a slice"),
          description: Text("A select chooses the slice to draw out."),
        ),
        CardContent(
          child: Column(
            mainAxisSize: MainAxisSize.min,
            children: [
              SizedBox(
                width: 160,
                child: Select<int>(
                  value: picked,
                  size: SelectSize.sm,
                  semanticLabel: 'Browser',
                  options: [
                    for (final (i, name) in ['Chrome', 'Safari', 'Firefox', 'Edge', 'Other'].indexed)
                      SelectOption(i, name),
                  ],
                  onChanged: (v) => setState(() => picked = v),
                ),
              ),
              const SizedBox(height: 12),
              PieChart(
                slices: const [
                  ChartSlice('Chrome', 275),
                  ChartSlice('Safari', 200),
                  ChartSlice('Firefox', 187),
                  ChartSlice('Edge', 173),
                  ChartSlice('Other', 90),
                ],
                active: picked,
                legend: ChartLegend.none,
              ),
            ],
          ),
        ),
      ],
    ),
  );
}
Radar
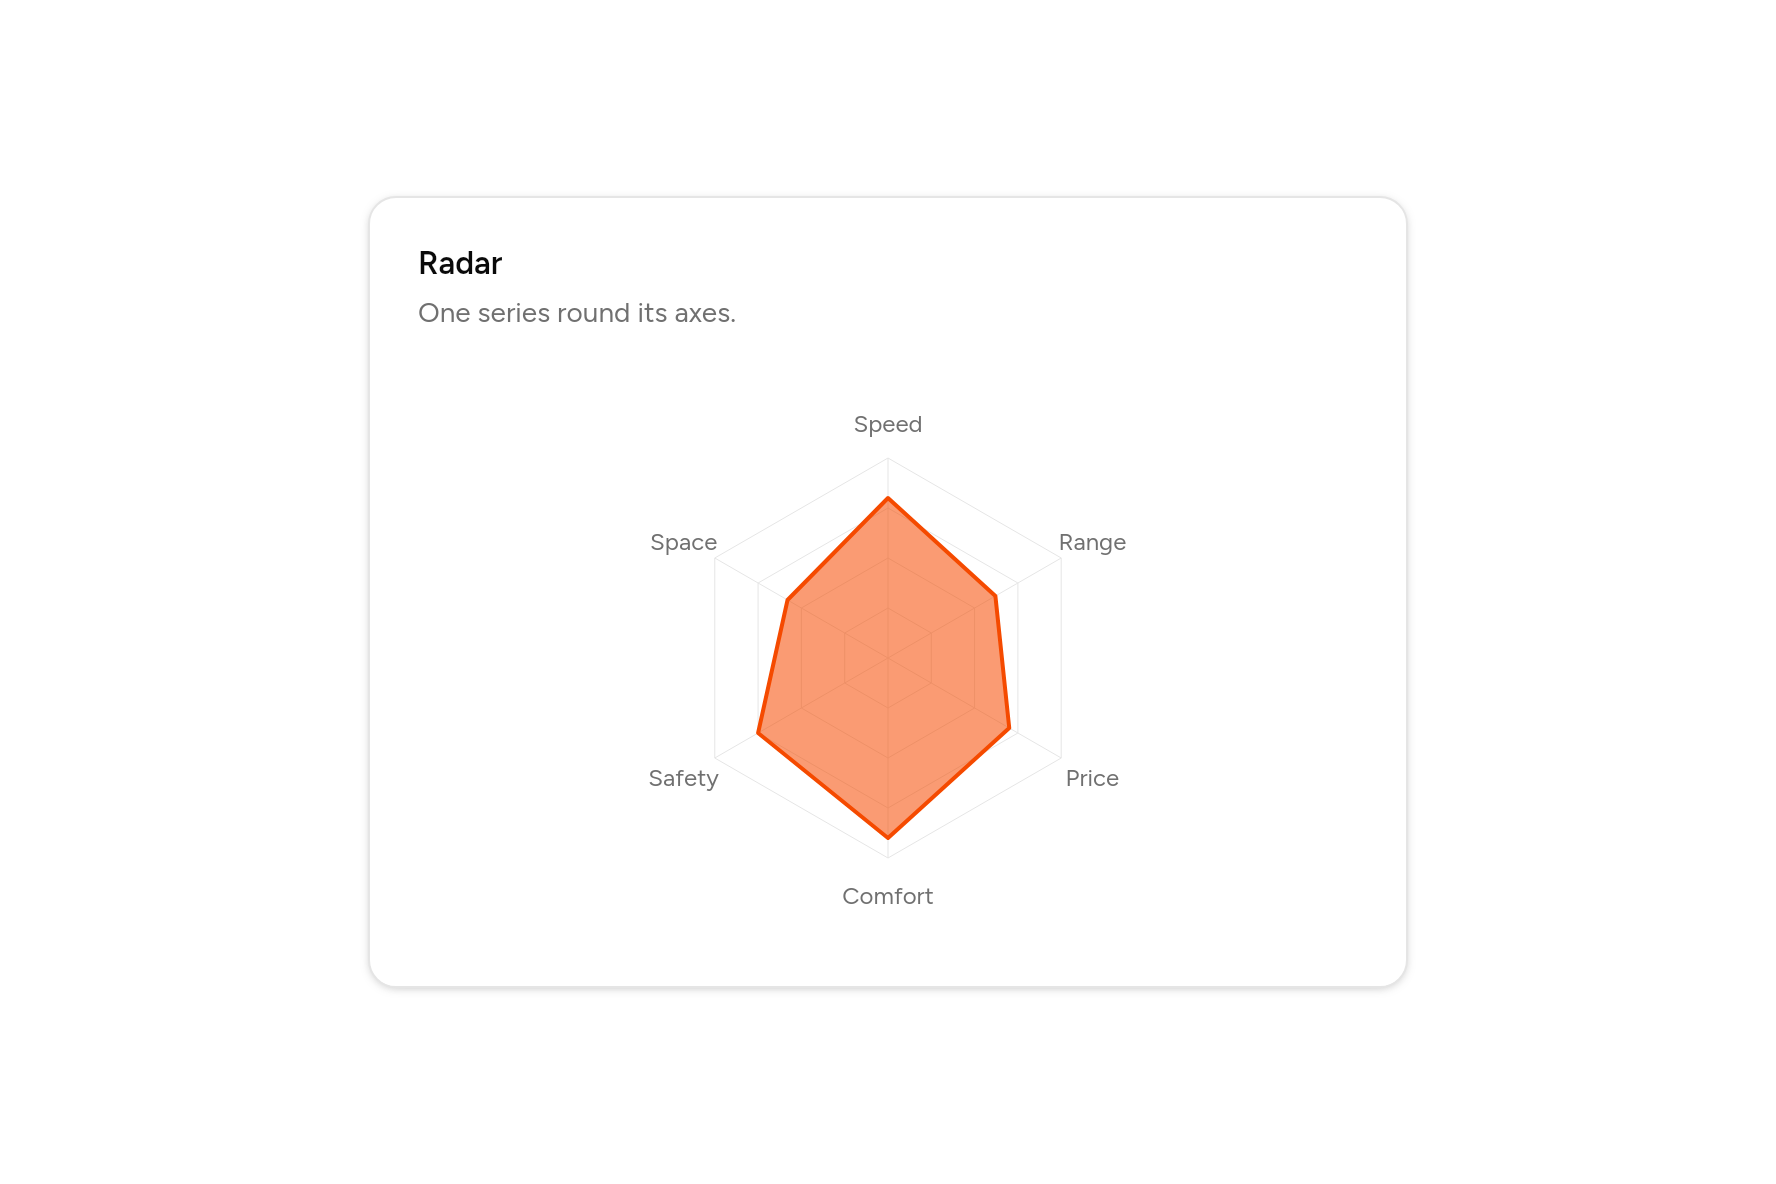
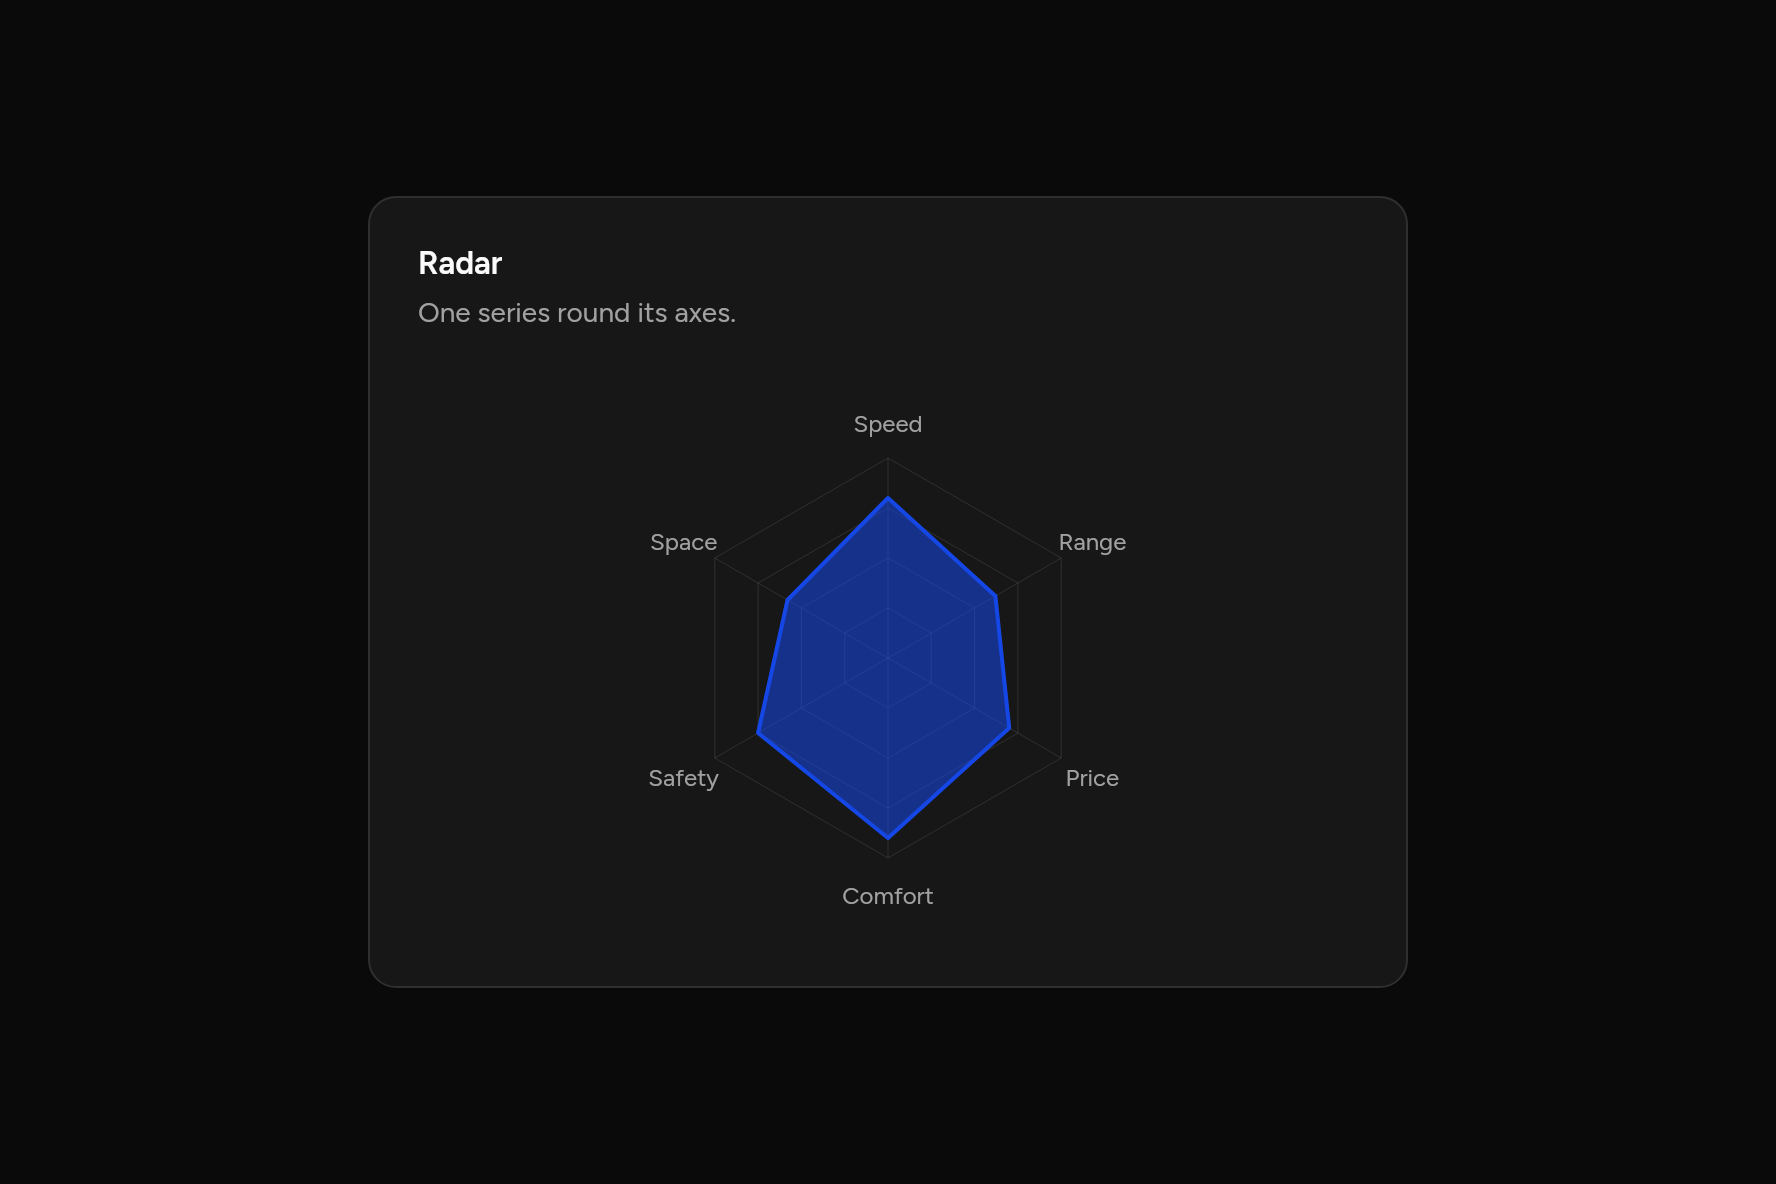
Radar
One series round its axes.
Code
// Radar: One series round its axes. Sample data.
import 'package:flutter/widgets.dart';

import 'ui/card.dart';
import 'ui/chart.dart';

class RadarDefaultChart extends StatelessWidget {
  const RadarDefaultChart({super.key});

  @override
  Widget build(BuildContext context) => SizedBox(
    width: 520,
    child: Card(
      children: [
        const CardHeader(
          title: Text("Radar"),
          description: Text("One series round its axes."),
        ),
        CardContent(
          child: RadarChart(
            labels: ['Speed', 'Range', 'Price', 'Comfort', 'Safety', 'Space'],
            series: const [
              ChartSeries('This year', [80, 62, 70, 90, 75, 58]),
            ],
          ),
        ),
      ],
    ),
  );
}
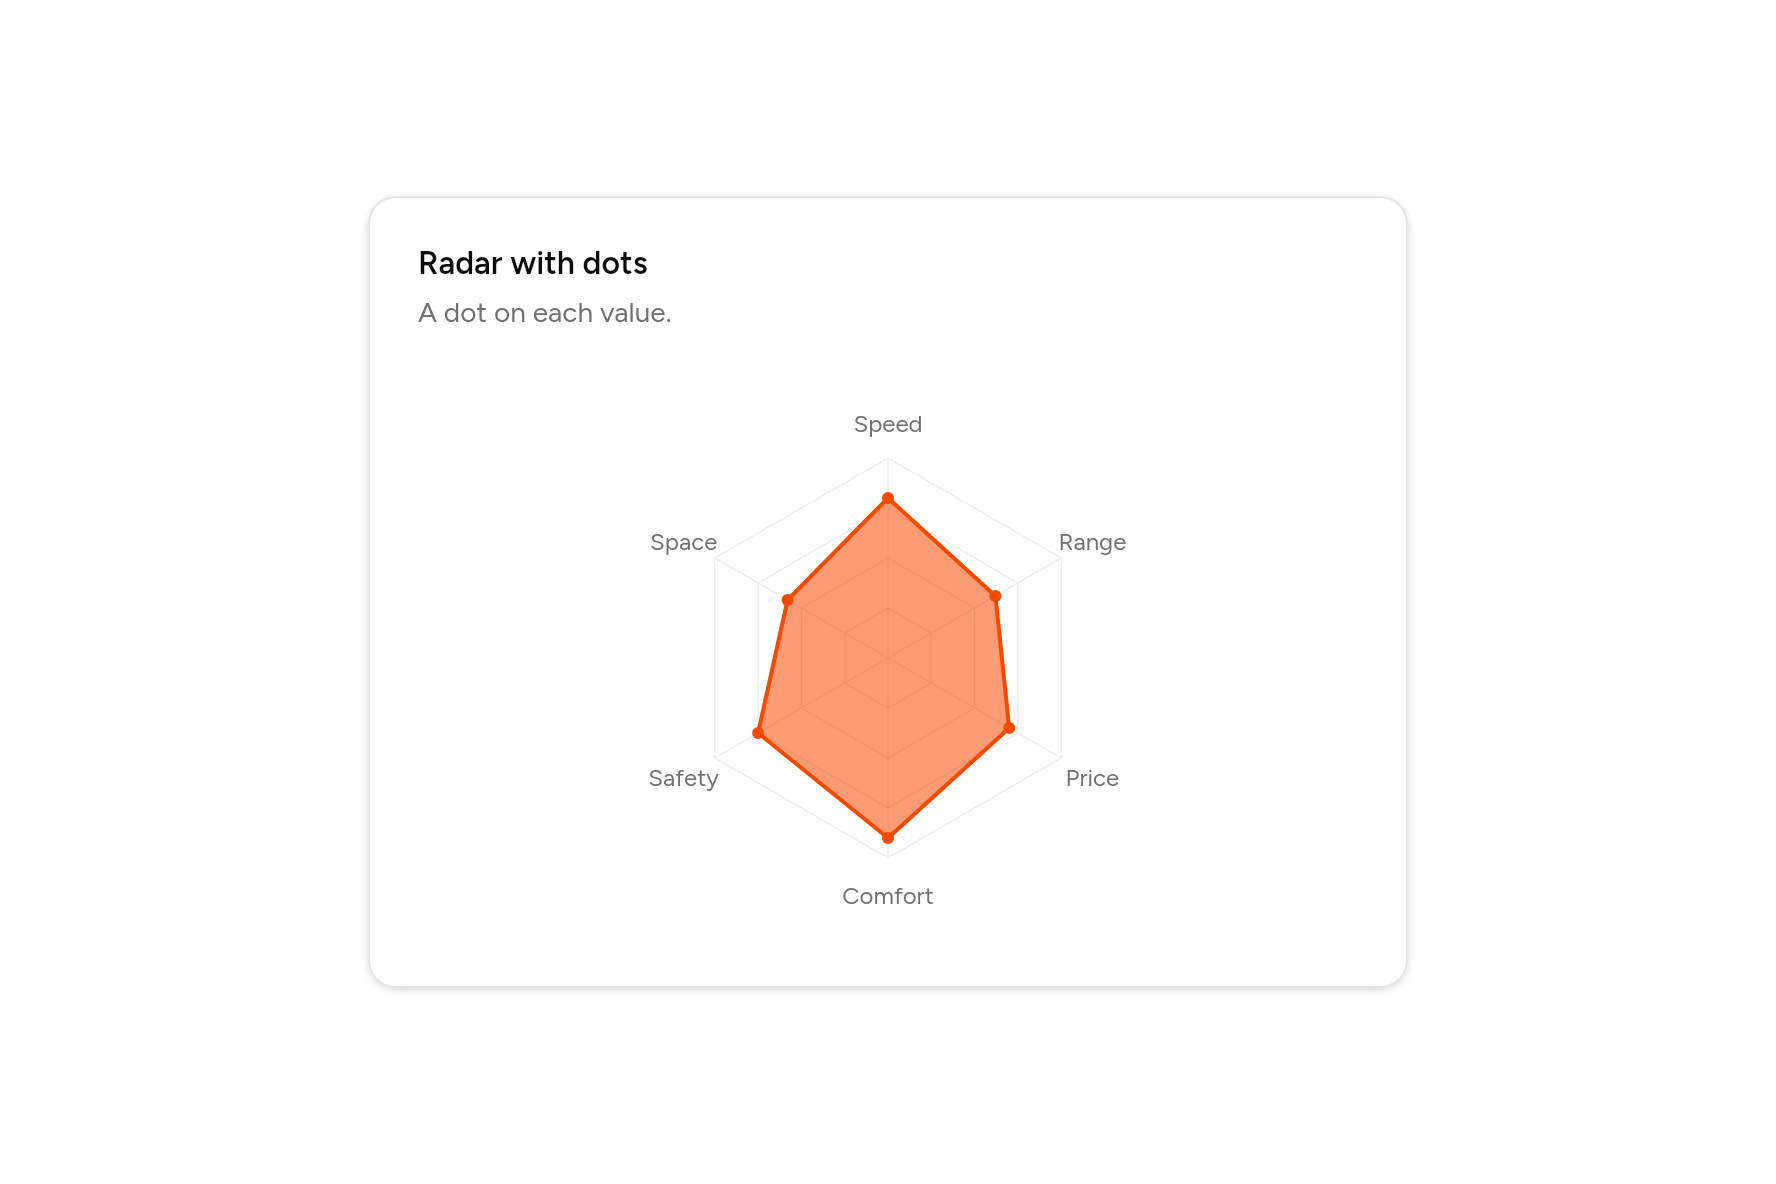
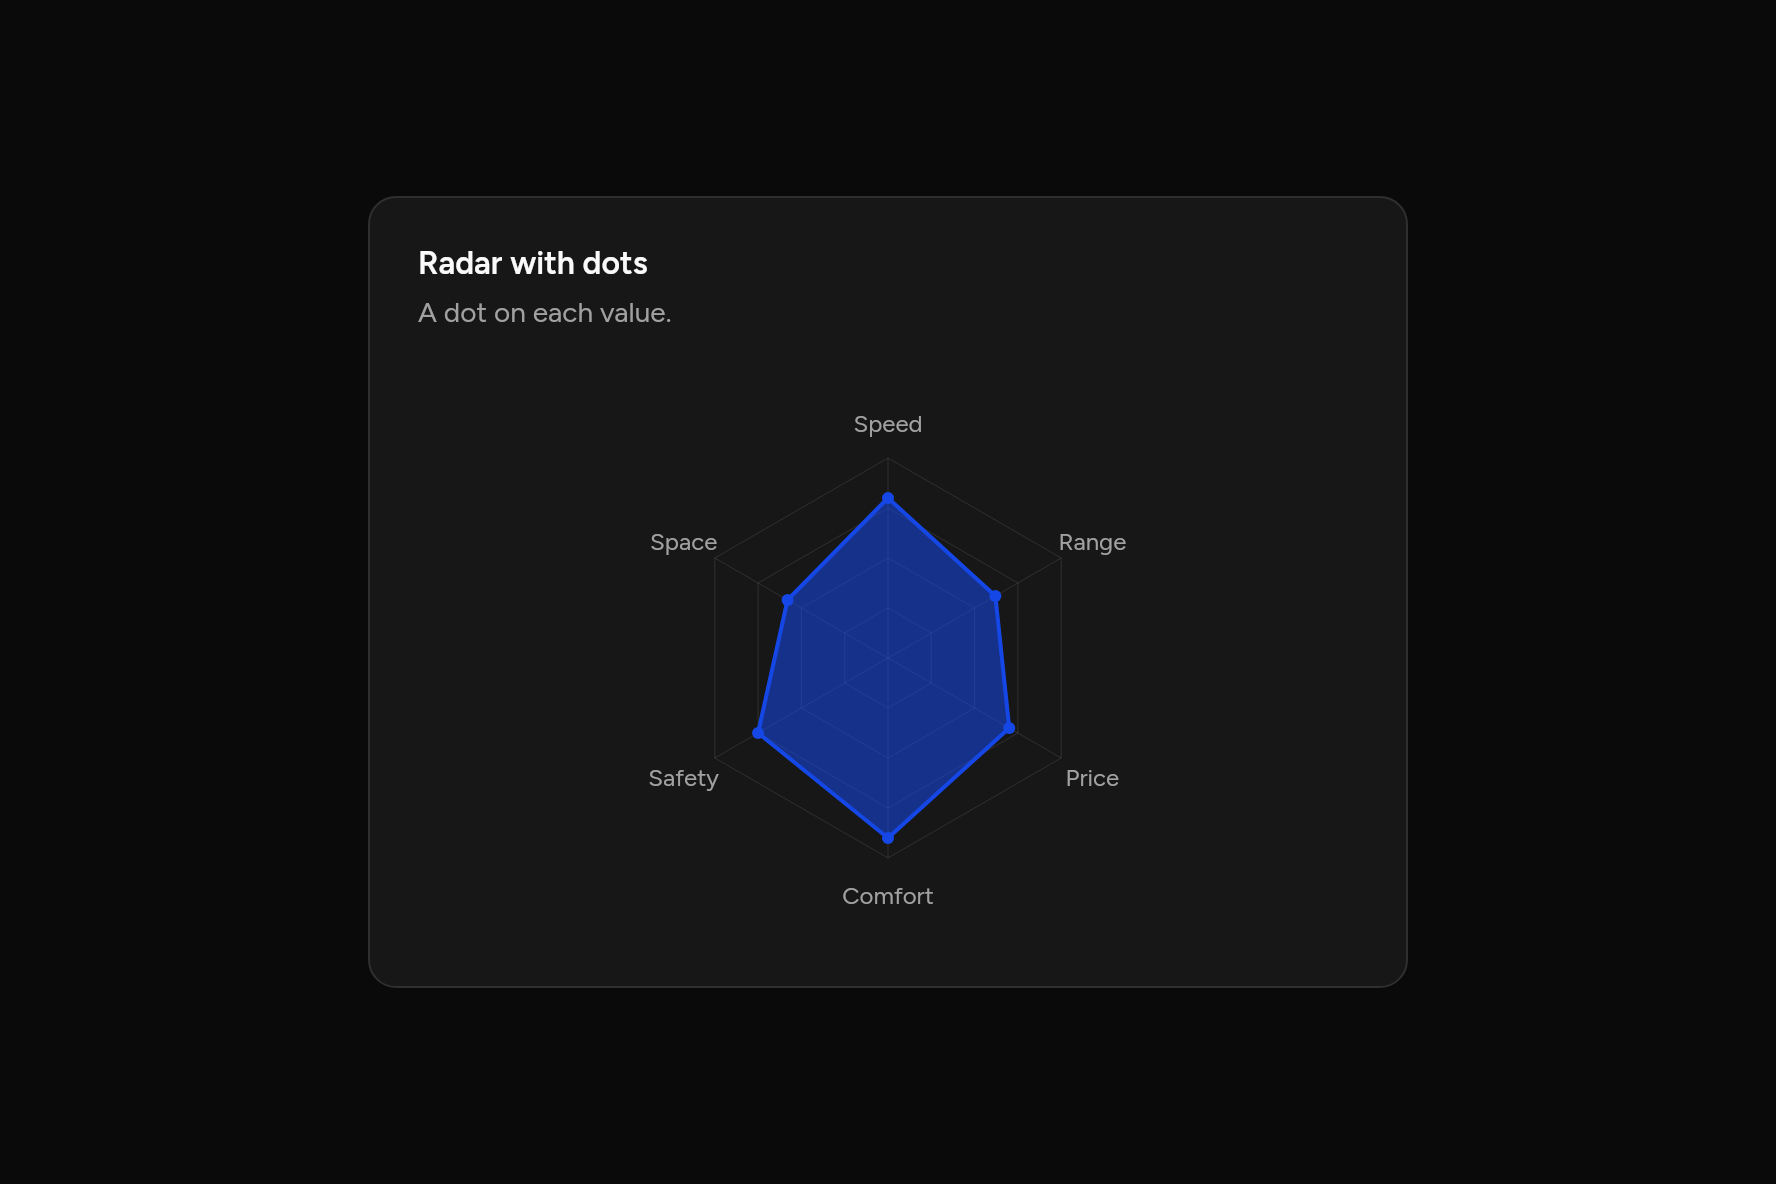
Radar with dots
A dot on each value.
Code
// Radar with dots: A dot on each value. Sample data.
import 'package:flutter/widgets.dart';

import 'ui/card.dart';
import 'ui/chart.dart';

class RadarDotsChart extends StatelessWidget {
  const RadarDotsChart({super.key});

  @override
  Widget build(BuildContext context) => SizedBox(
    width: 520,
    child: Card(
      children: [
        const CardHeader(
          title: Text("Radar with dots"),
          description: Text("A dot on each value."),
        ),
        CardContent(
          child: RadarChart(
            labels: ['Speed', 'Range', 'Price', 'Comfort', 'Safety', 'Space'],
            series: const [
              ChartSeries('This year', [80, 62, 70, 90, 75, 58]),
            ],
            dots: true,
          ),
        ),
      ],
    ),
  );
}
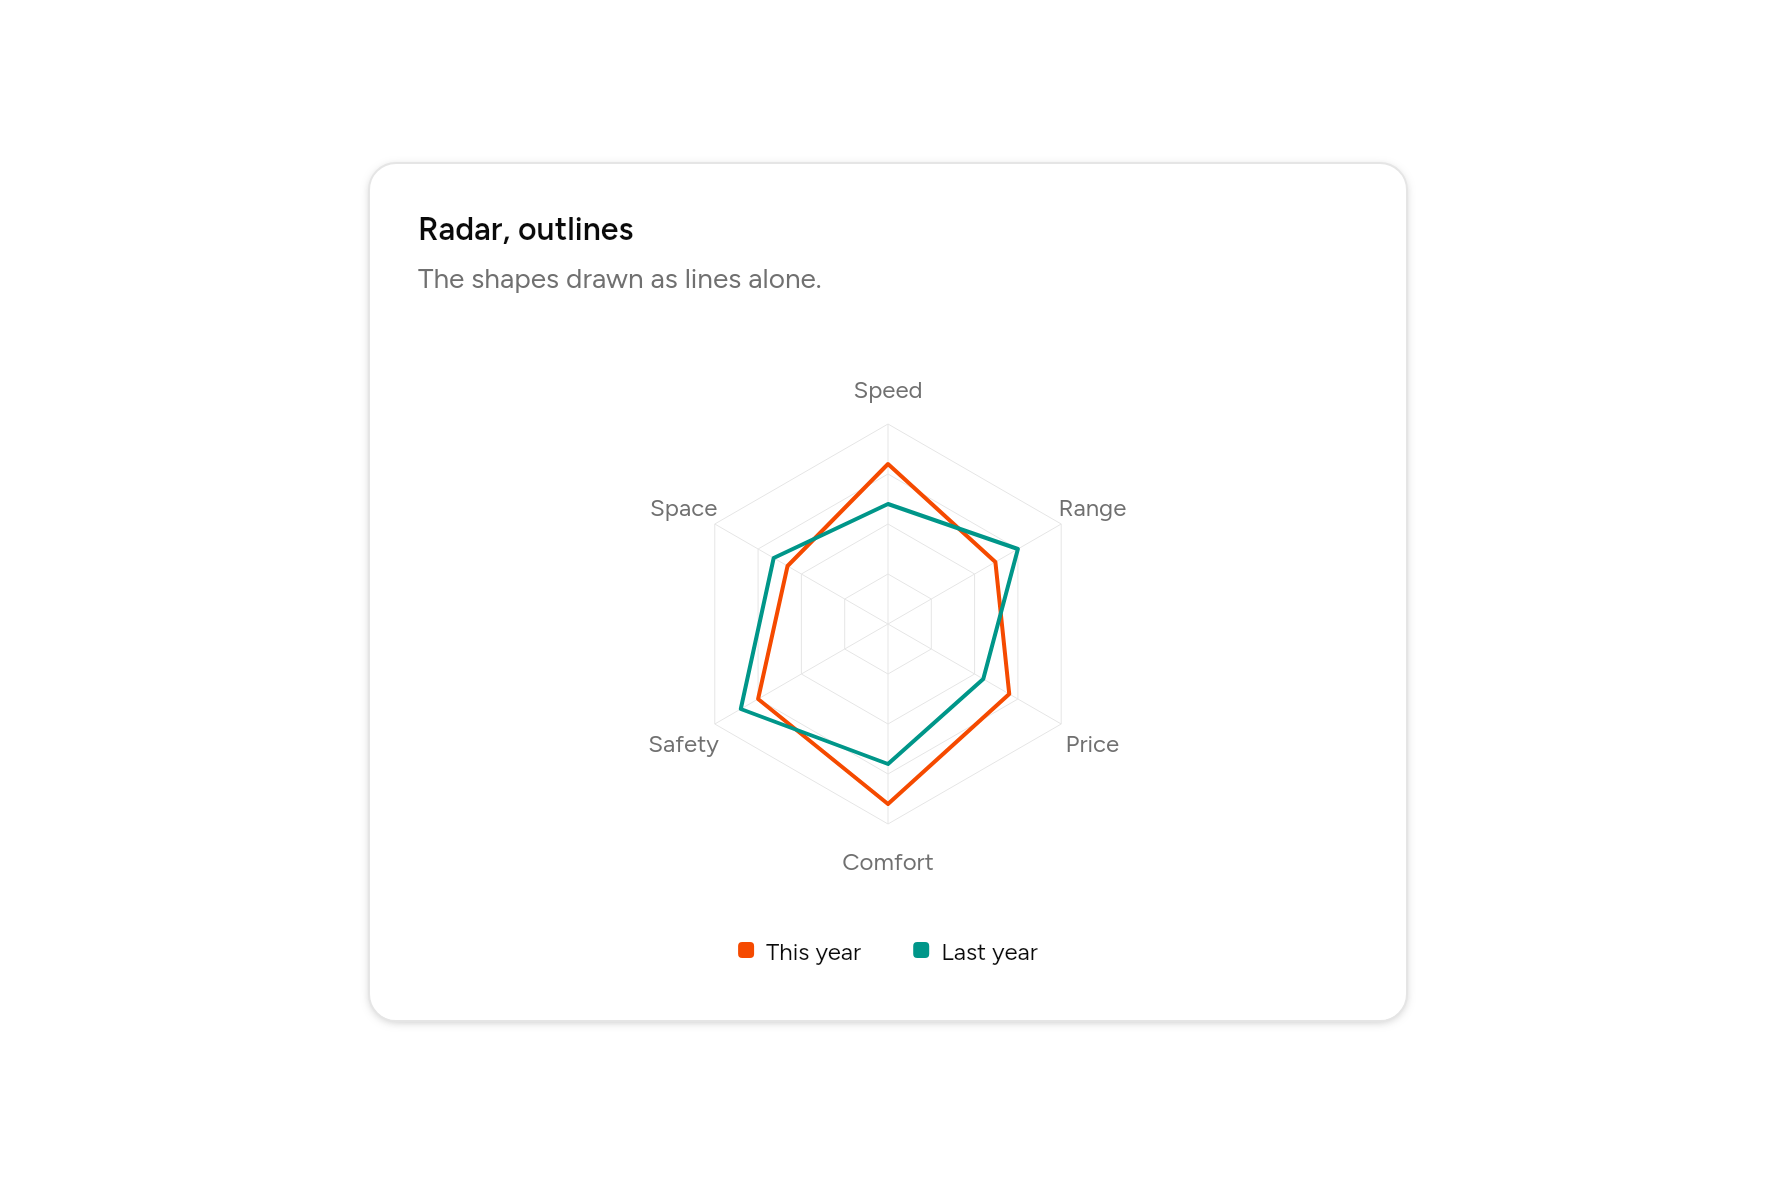
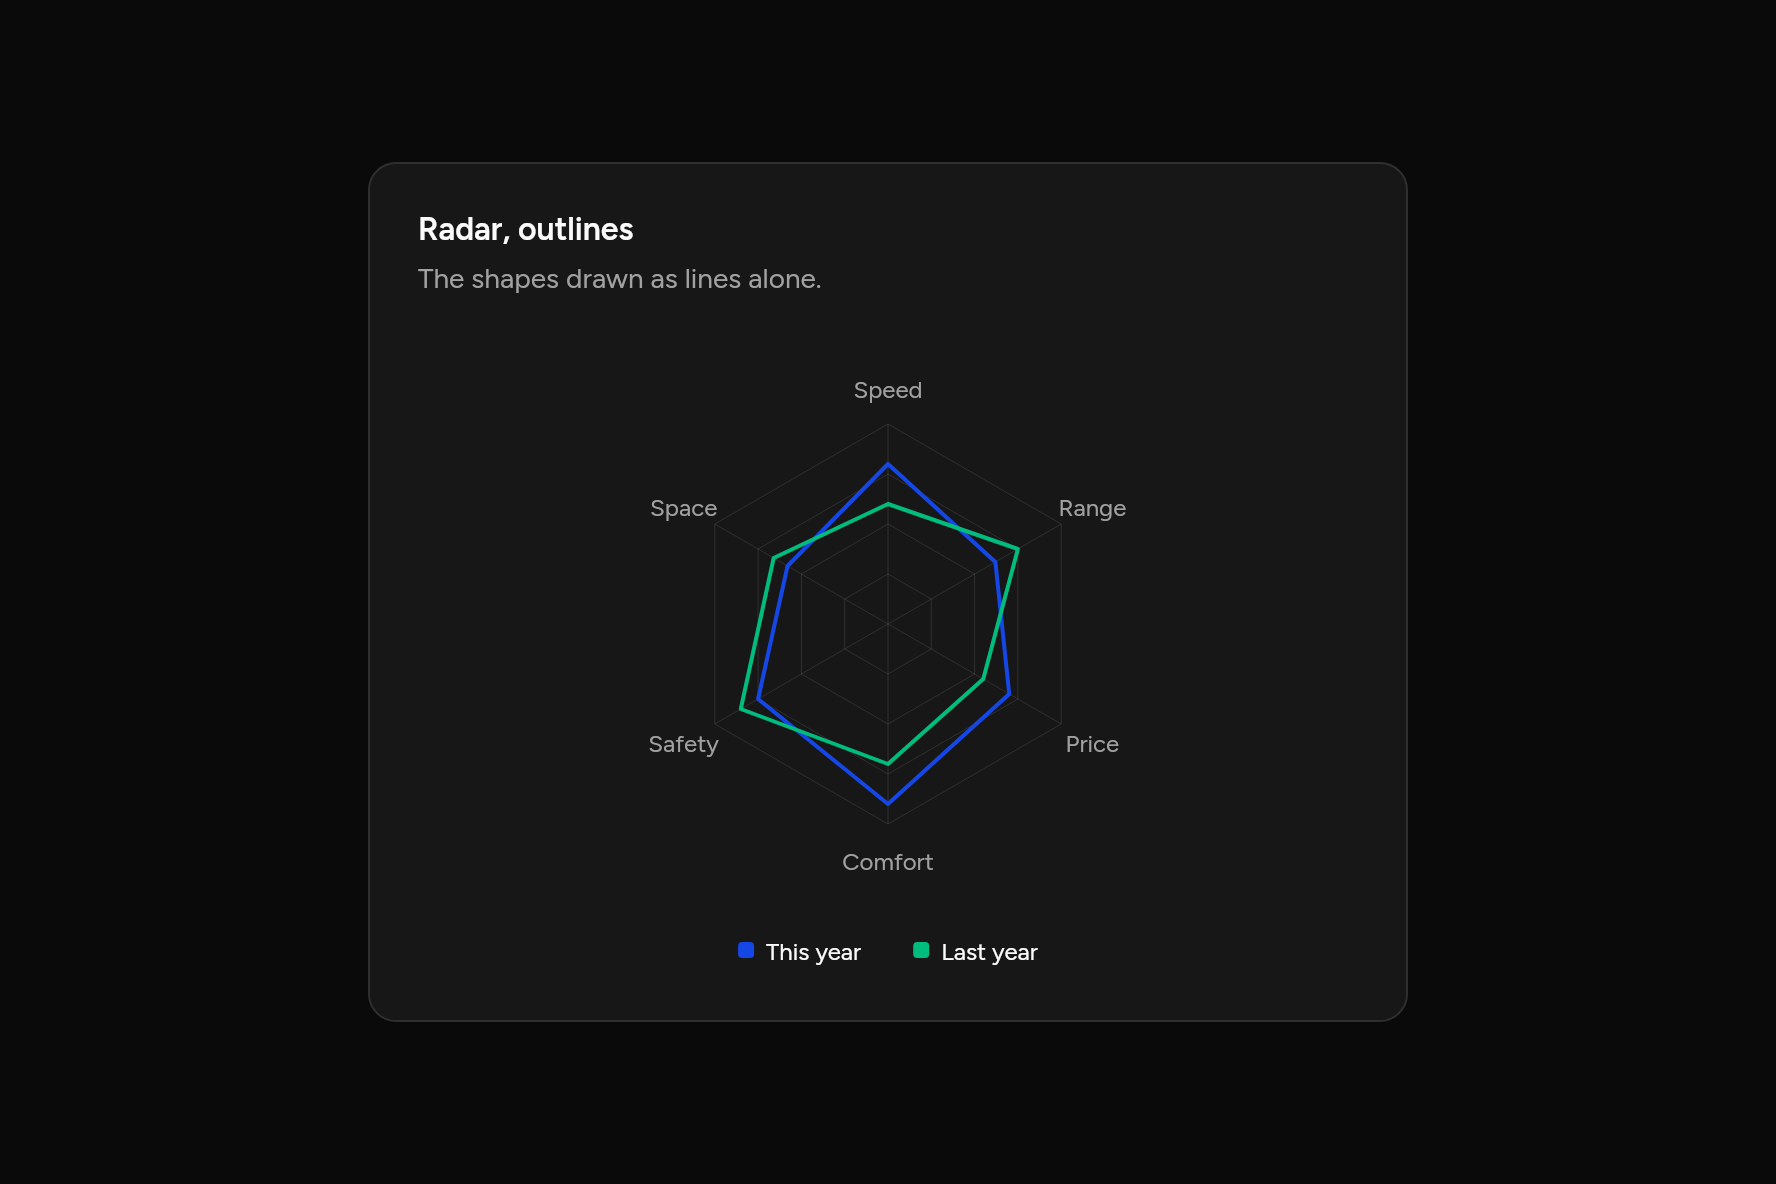
Radar, outlines
The shapes drawn as lines alone.
Code
// Radar, outlines: The shapes drawn as lines alone. Sample data.
import 'package:flutter/widgets.dart';

import 'ui/card.dart';
import 'ui/chart.dart';

class RadarLinesOnlyChart extends StatelessWidget {
  const RadarLinesOnlyChart({super.key});

  @override
  Widget build(BuildContext context) => SizedBox(
    width: 520,
    child: Card(
      children: [
        const CardHeader(
          title: Text("Radar, outlines"),
          description: Text("The shapes drawn as lines alone."),
        ),
        CardContent(
          child: RadarChart(
            labels: ['Speed', 'Range', 'Price', 'Comfort', 'Safety', 'Space'],
            series: const [
              ChartSeries('This year', [80, 62, 70, 90, 75, 58]),
              ChartSeries('Last year', [60, 75, 55, 70, 85, 66]),
            ],
            fill: false,
          ),
        ),
      ],
    ),
  );
}
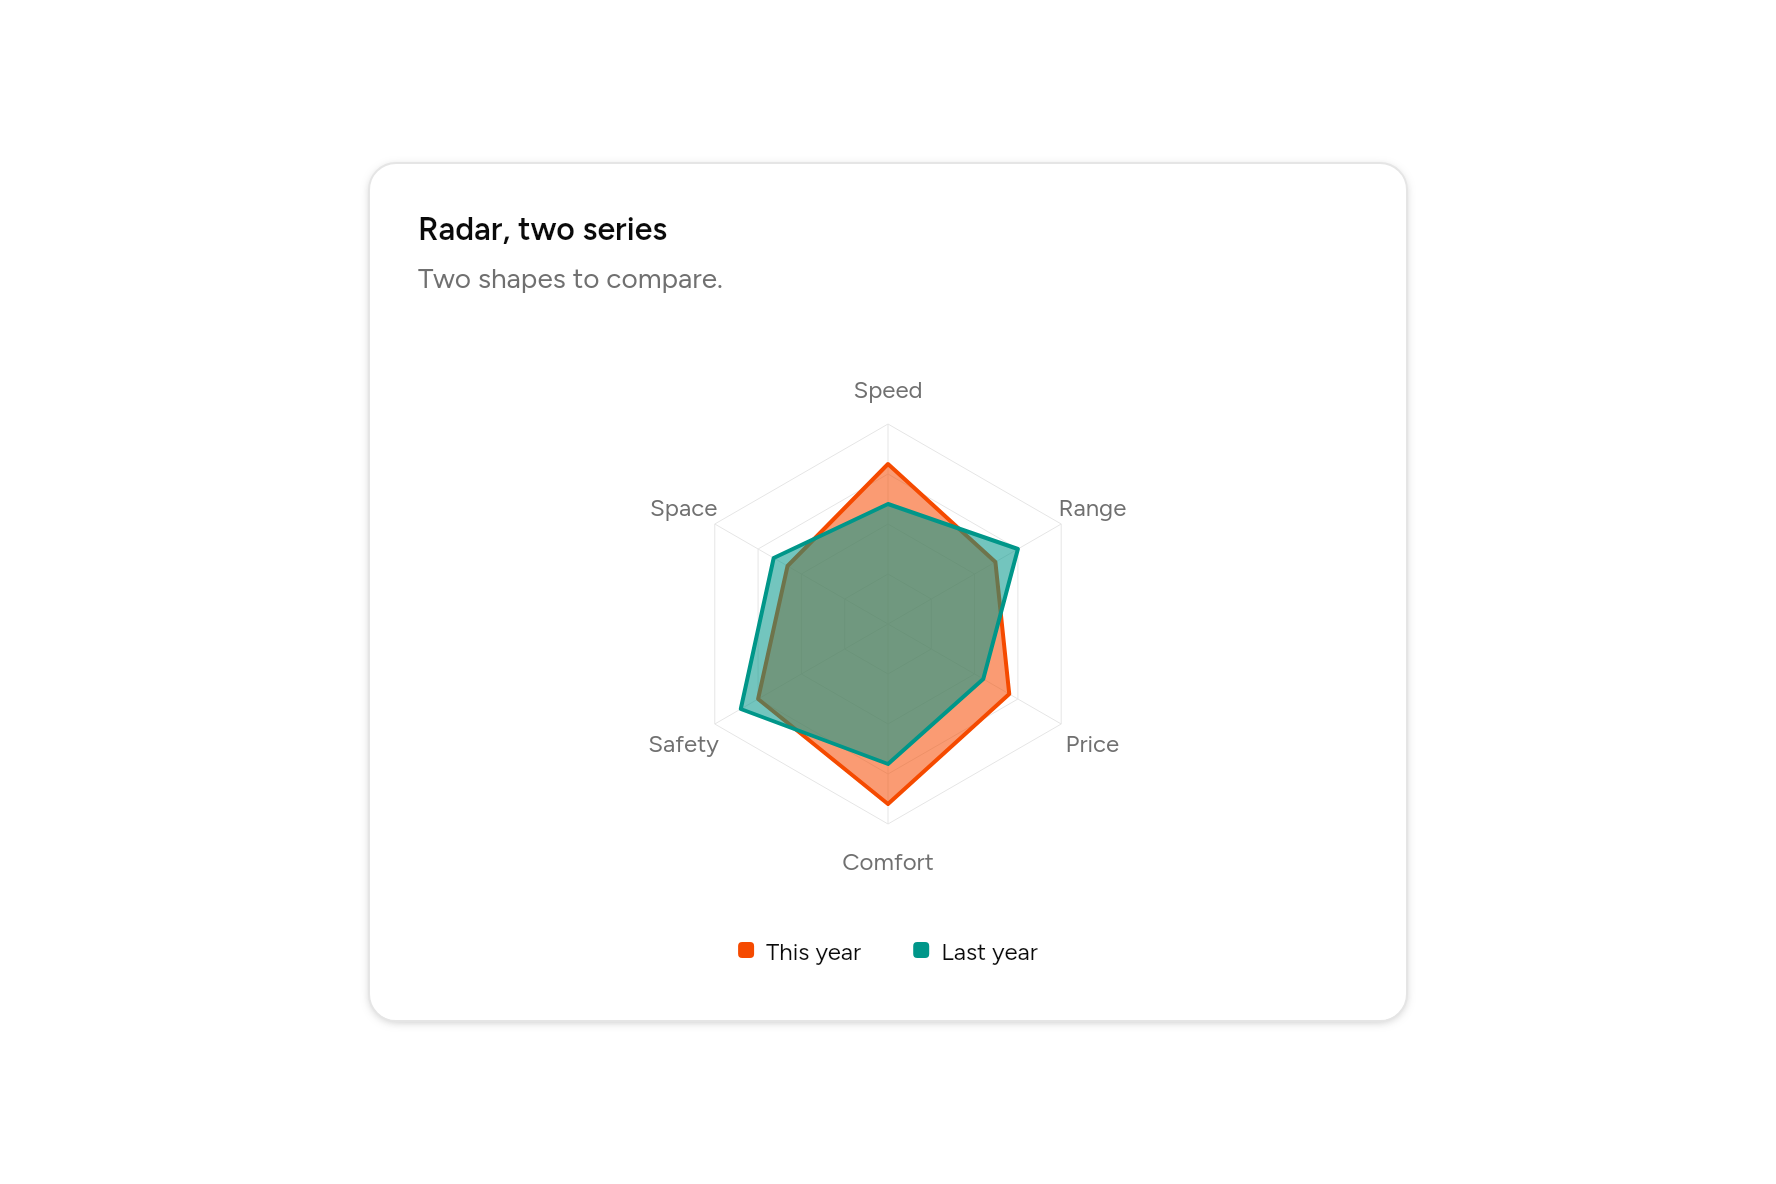
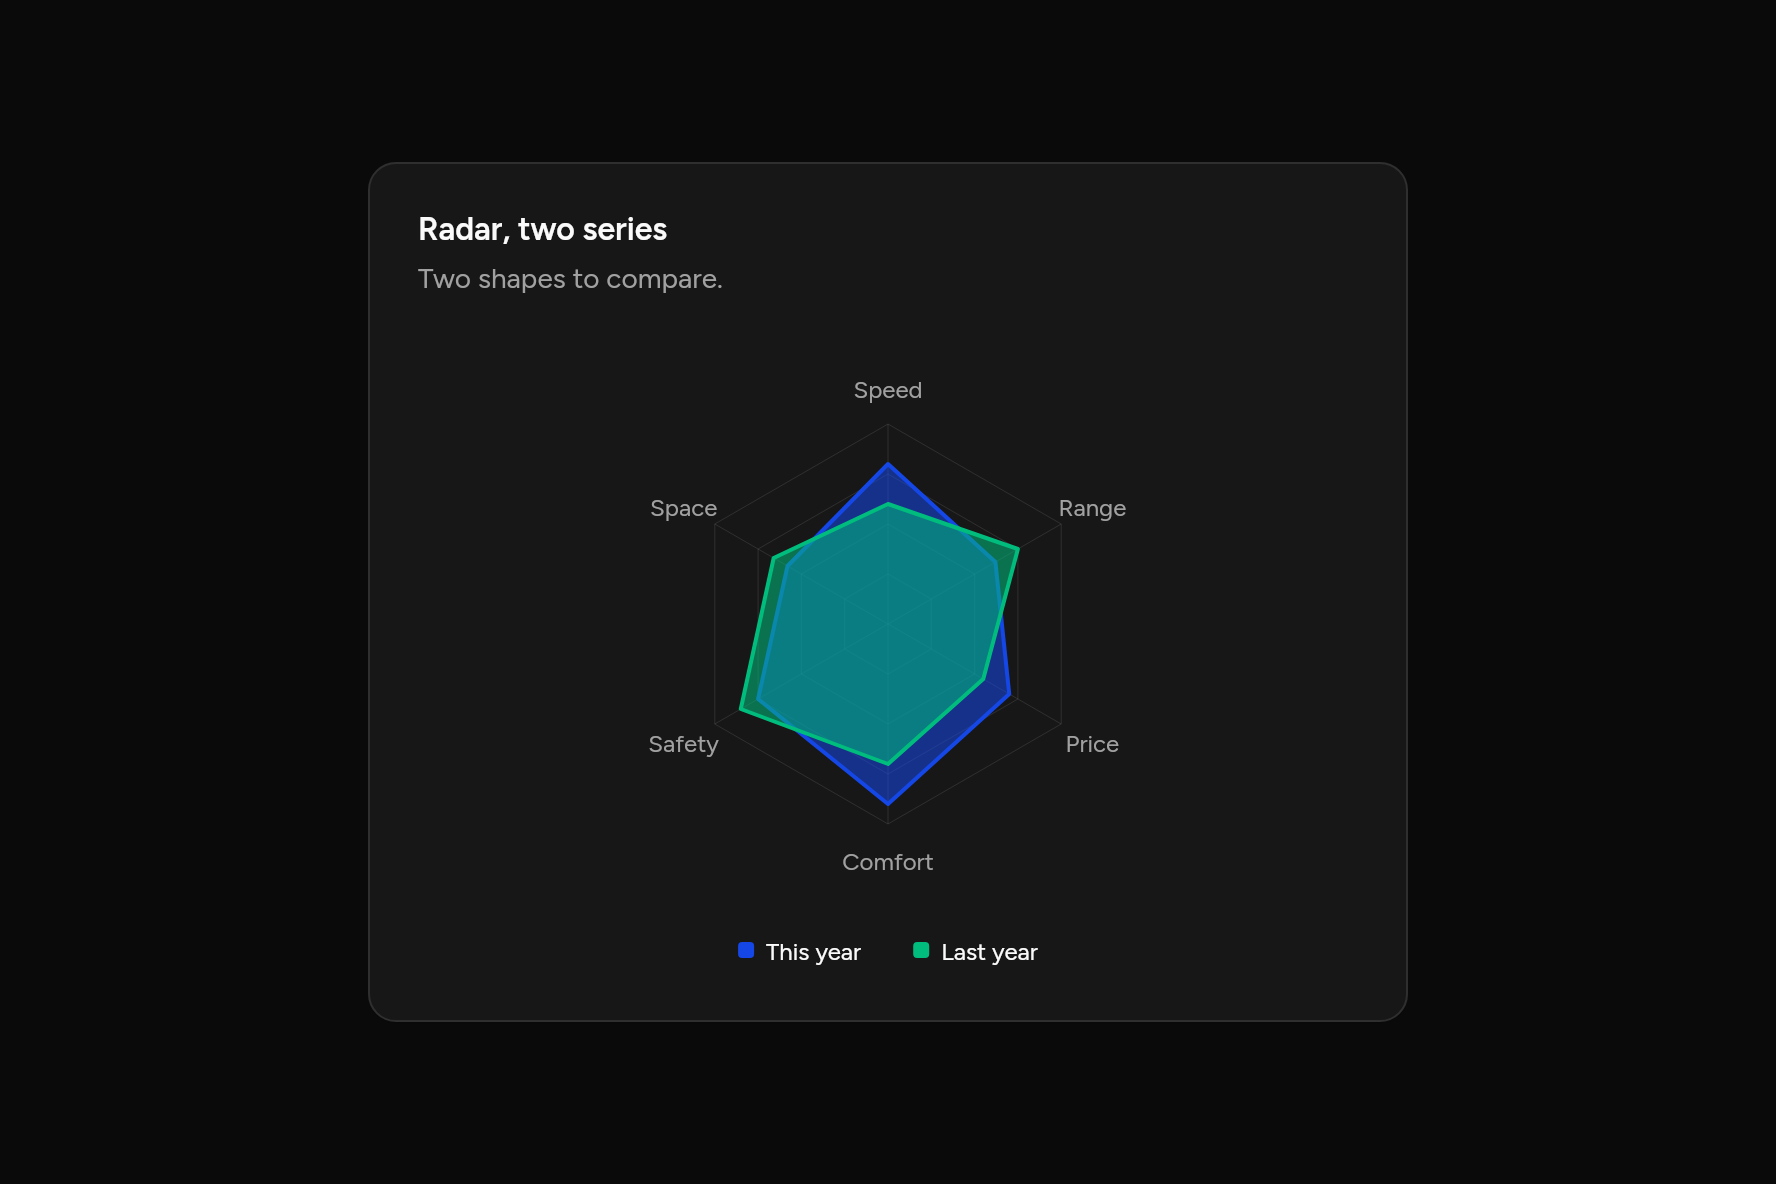
Radar, two series
Two shapes to compare.
Code
// Radar, two series: Two shapes to compare. Sample data.
import 'package:flutter/widgets.dart';

import 'ui/card.dart';
import 'ui/chart.dart';

class RadarMultipleChart extends StatelessWidget {
  const RadarMultipleChart({super.key});

  @override
  Widget build(BuildContext context) => SizedBox(
    width: 520,
    child: Card(
      children: [
        const CardHeader(
          title: Text("Radar, two series"),
          description: Text("Two shapes to compare."),
        ),
        CardContent(
          child: RadarChart(
            labels: ['Speed', 'Range', 'Price', 'Comfort', 'Safety', 'Space'],
            series: const [
              ChartSeries('This year', [80, 62, 70, 90, 75, 58]),
              ChartSeries('Last year', [60, 75, 55, 70, 85, 66]),
            ],
          ),
        ),
      ],
    ),
  );
}
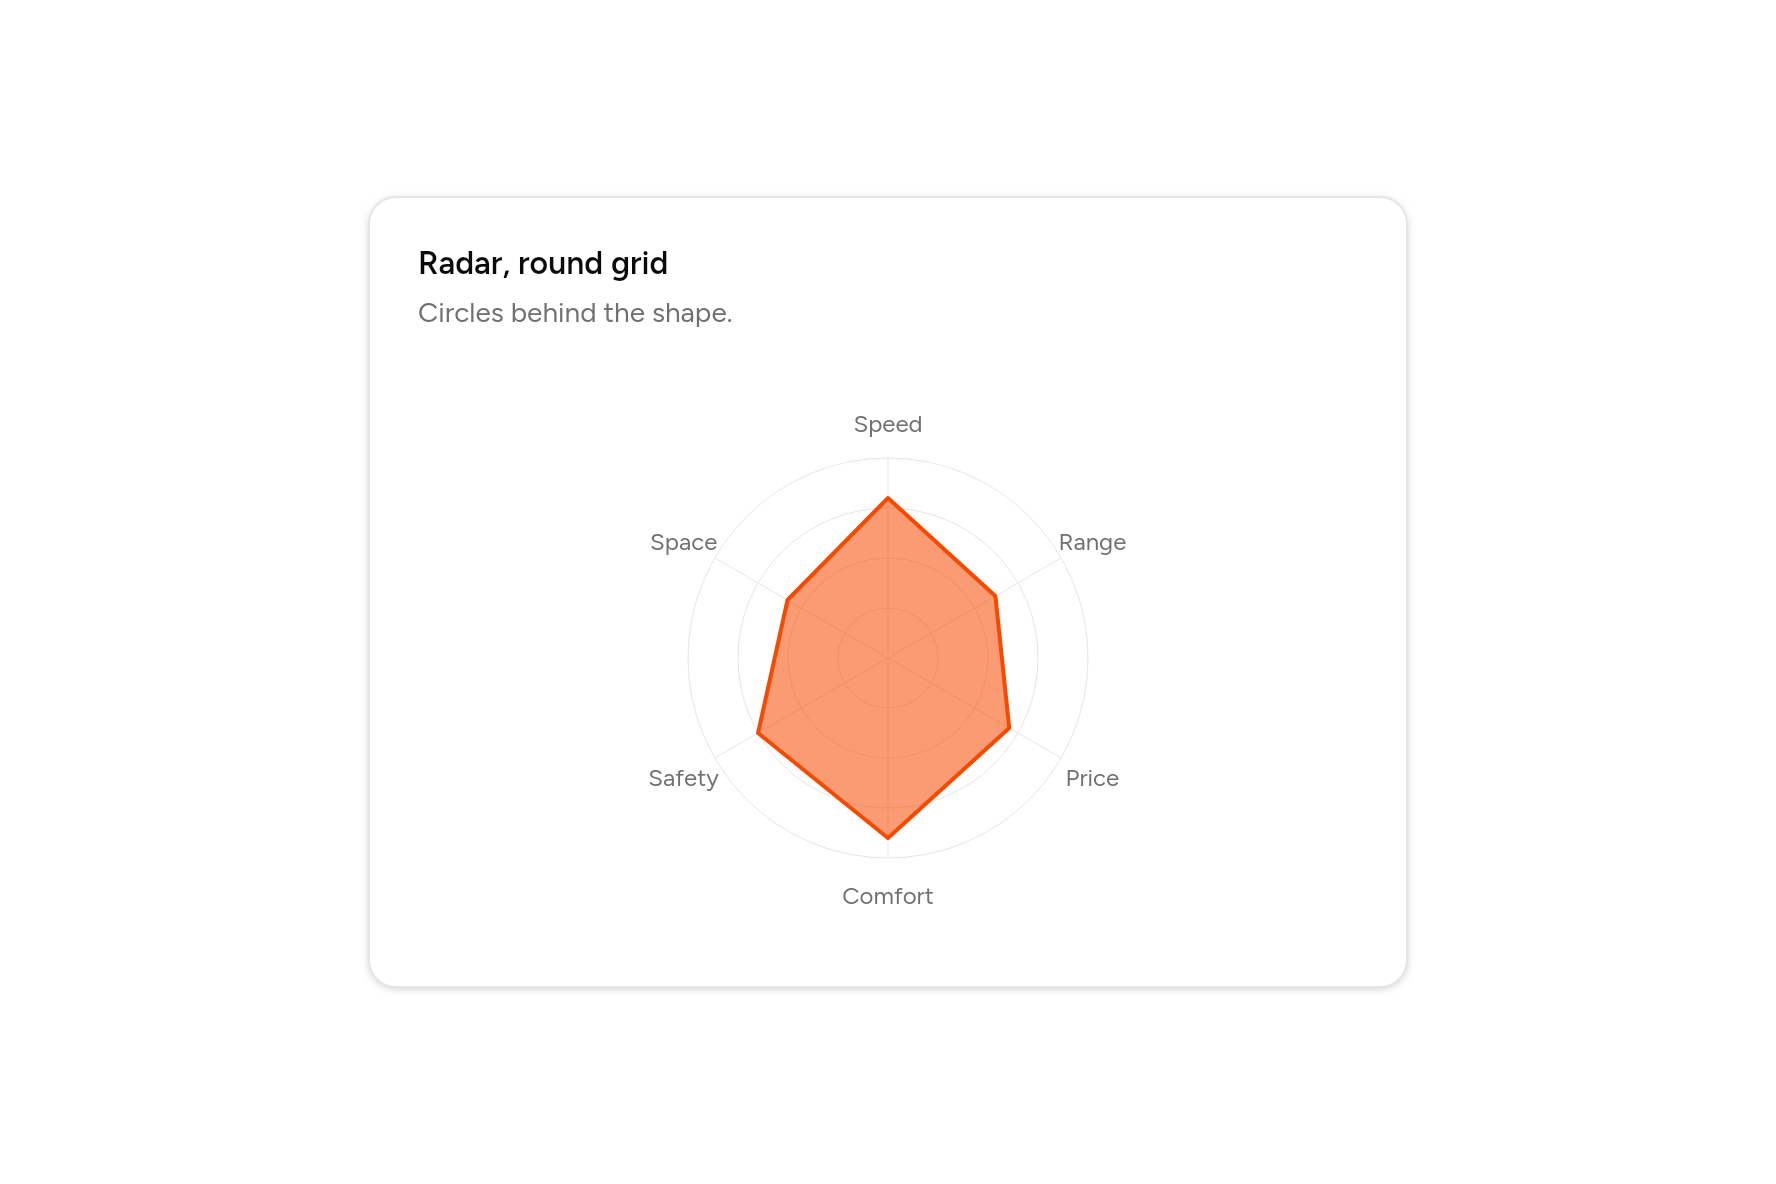
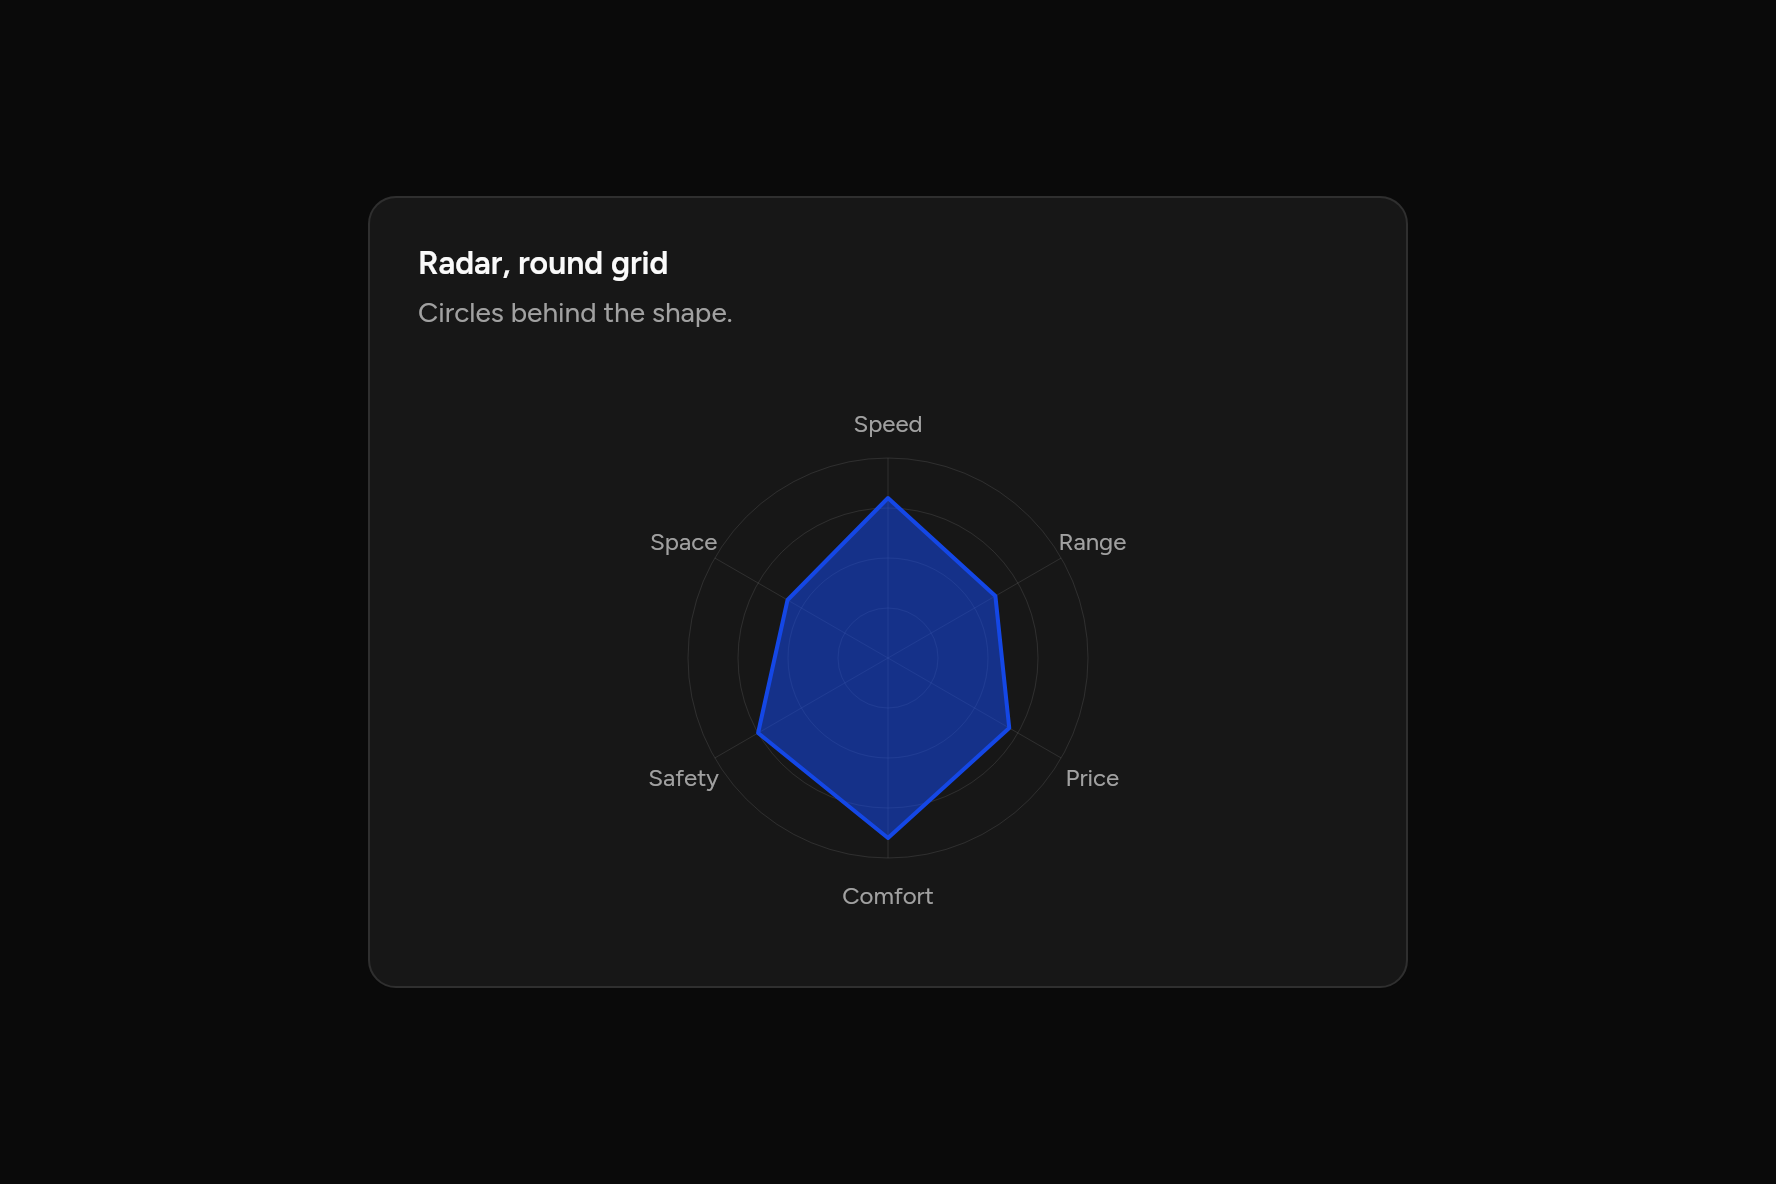
Radar, round grid
Circles behind the shape.
Code
// Radar, round grid: Circles behind the shape. Sample data.
import 'package:flutter/widgets.dart';

import 'ui/card.dart';
import 'ui/chart.dart';

class RadarGridCircleChart extends StatelessWidget {
  const RadarGridCircleChart({super.key});

  @override
  Widget build(BuildContext context) => SizedBox(
    width: 520,
    child: Card(
      children: [
        const CardHeader(
          title: Text("Radar, round grid"),
          description: Text("Circles behind the shape."),
        ),
        CardContent(
          child: RadarChart(
            labels: ['Speed', 'Range', 'Price', 'Comfort', 'Safety', 'Space'],
            series: const [
              ChartSeries('This year', [80, 62, 70, 90, 75, 58]),
            ],
            grid: RadarGrid.circle,
          ),
        ),
      ],
    ),
  );
}
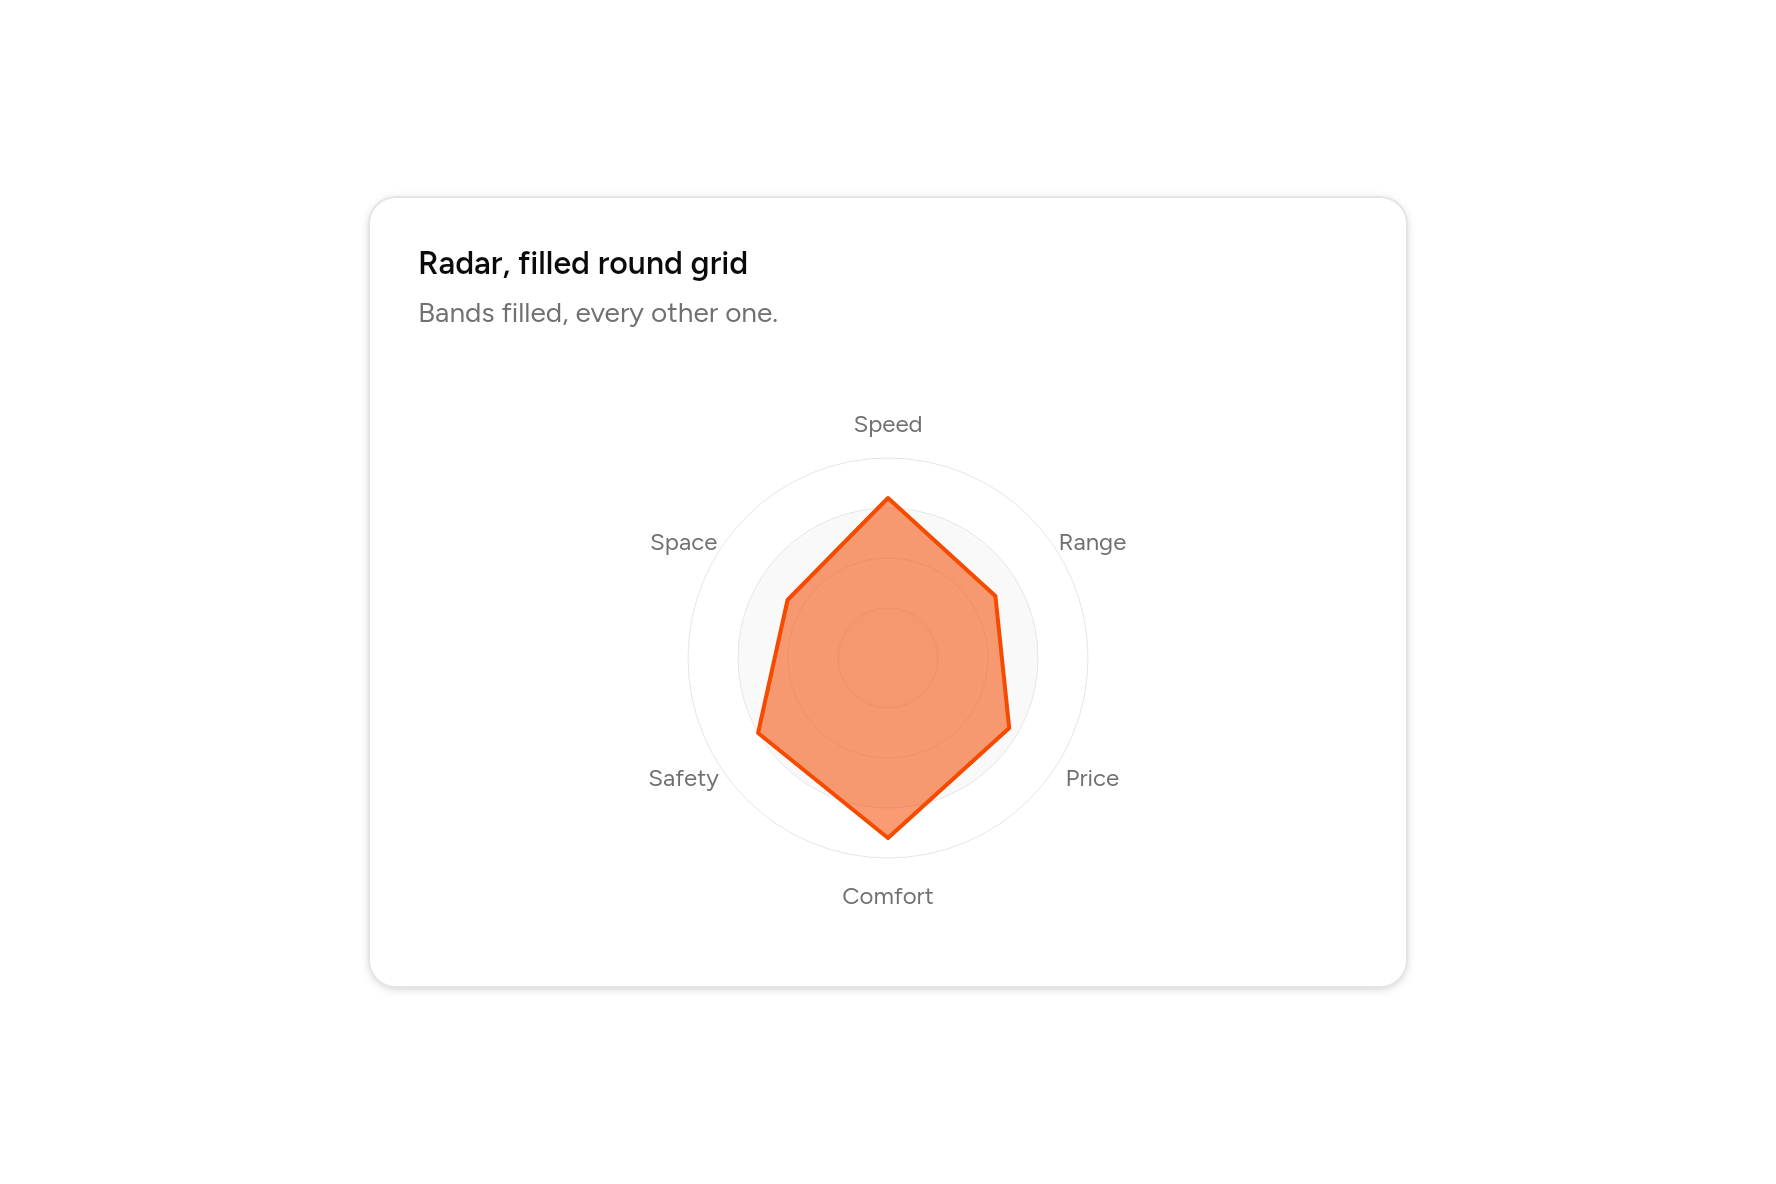
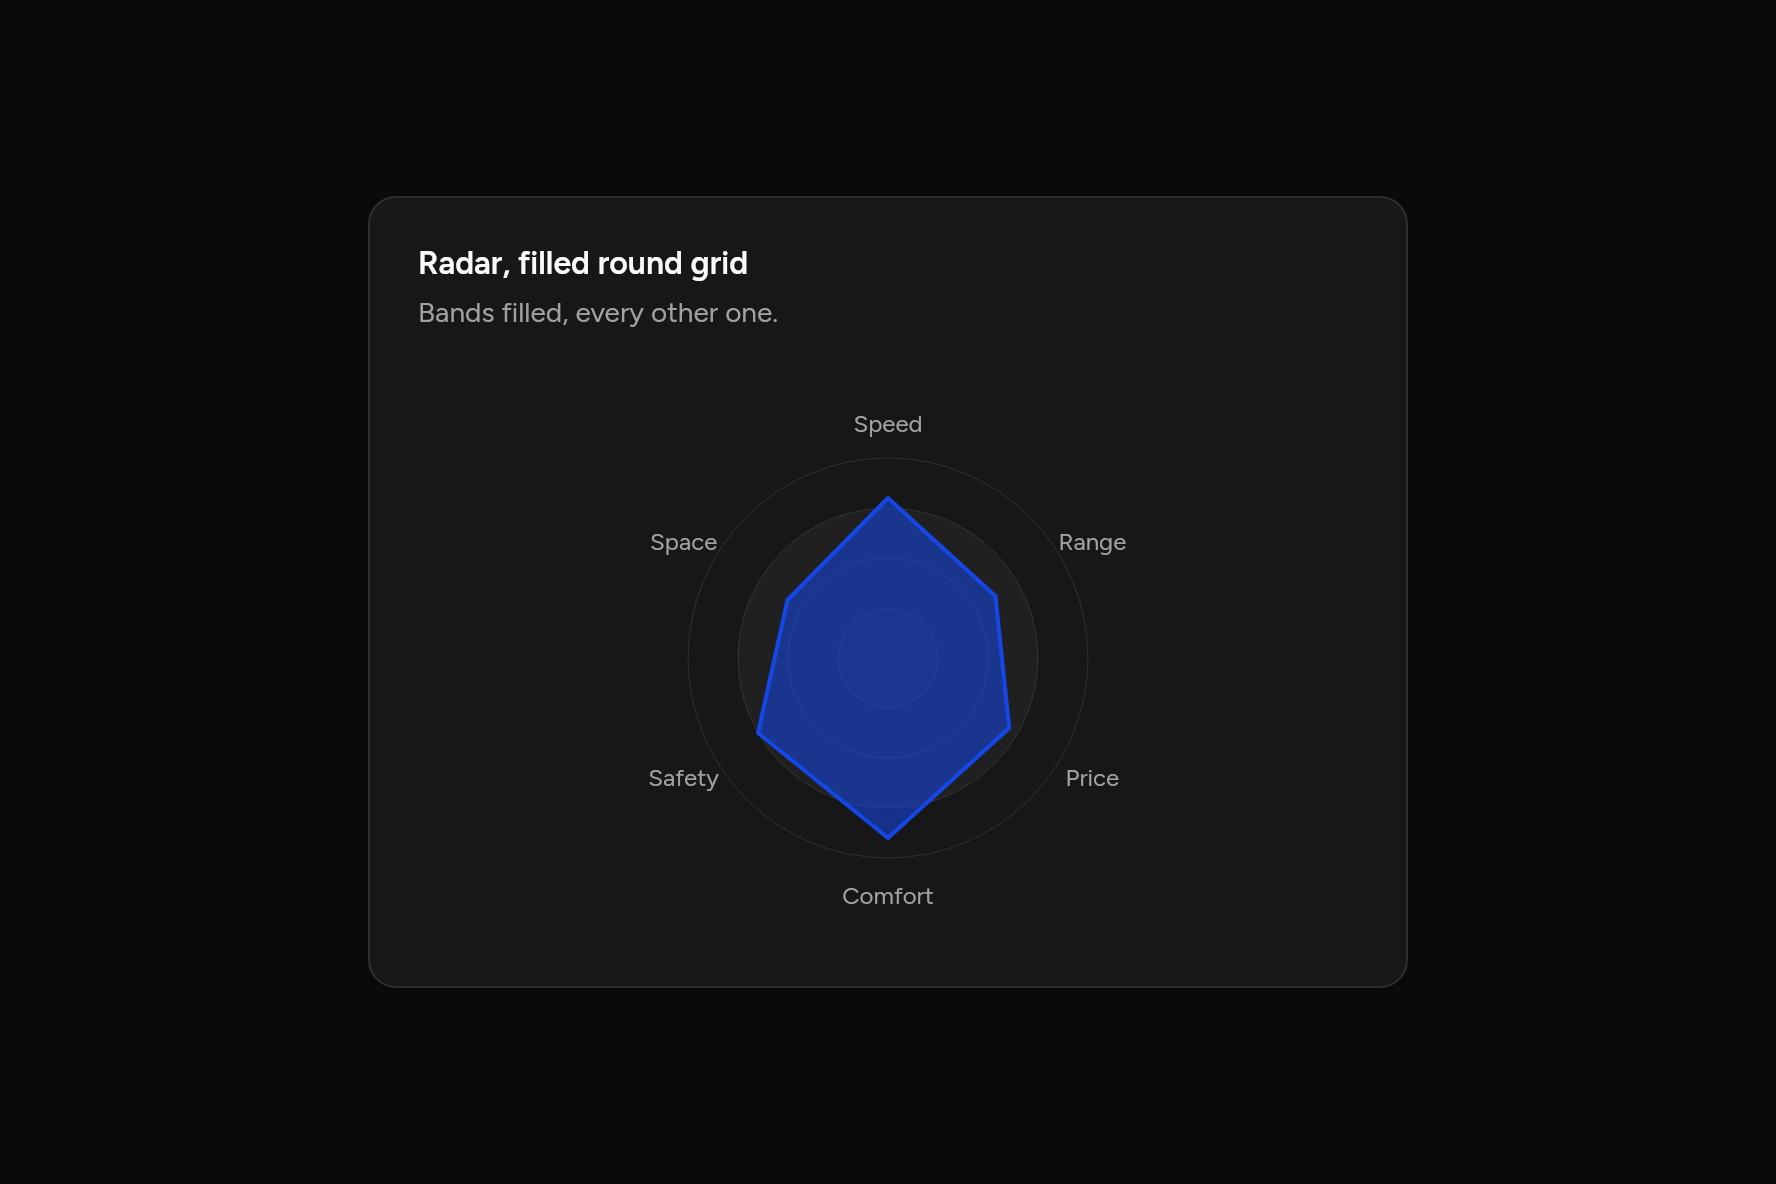
Radar, filled round grid
Bands filled, every other one.
Code
// Radar, filled round grid: Bands filled, every other one. Sample data.
import 'package:flutter/widgets.dart';

import 'ui/card.dart';
import 'ui/chart.dart';

class RadarGridCircleFillChart extends StatelessWidget {
  const RadarGridCircleFillChart({super.key});

  @override
  Widget build(BuildContext context) => SizedBox(
    width: 520,
    child: Card(
      children: [
        const CardHeader(
          title: Text("Radar, filled round grid"),
          description: Text("Bands filled, every other one."),
        ),
        CardContent(
          child: RadarChart(
            labels: ['Speed', 'Range', 'Price', 'Comfort', 'Safety', 'Space'],
            series: const [
              ChartSeries('This year', [80, 62, 70, 90, 75, 58]),
            ],
            grid: RadarGrid.circle,
            gridFill: true,
            spokes: false,
          ),
        ),
      ],
    ),
  );
}
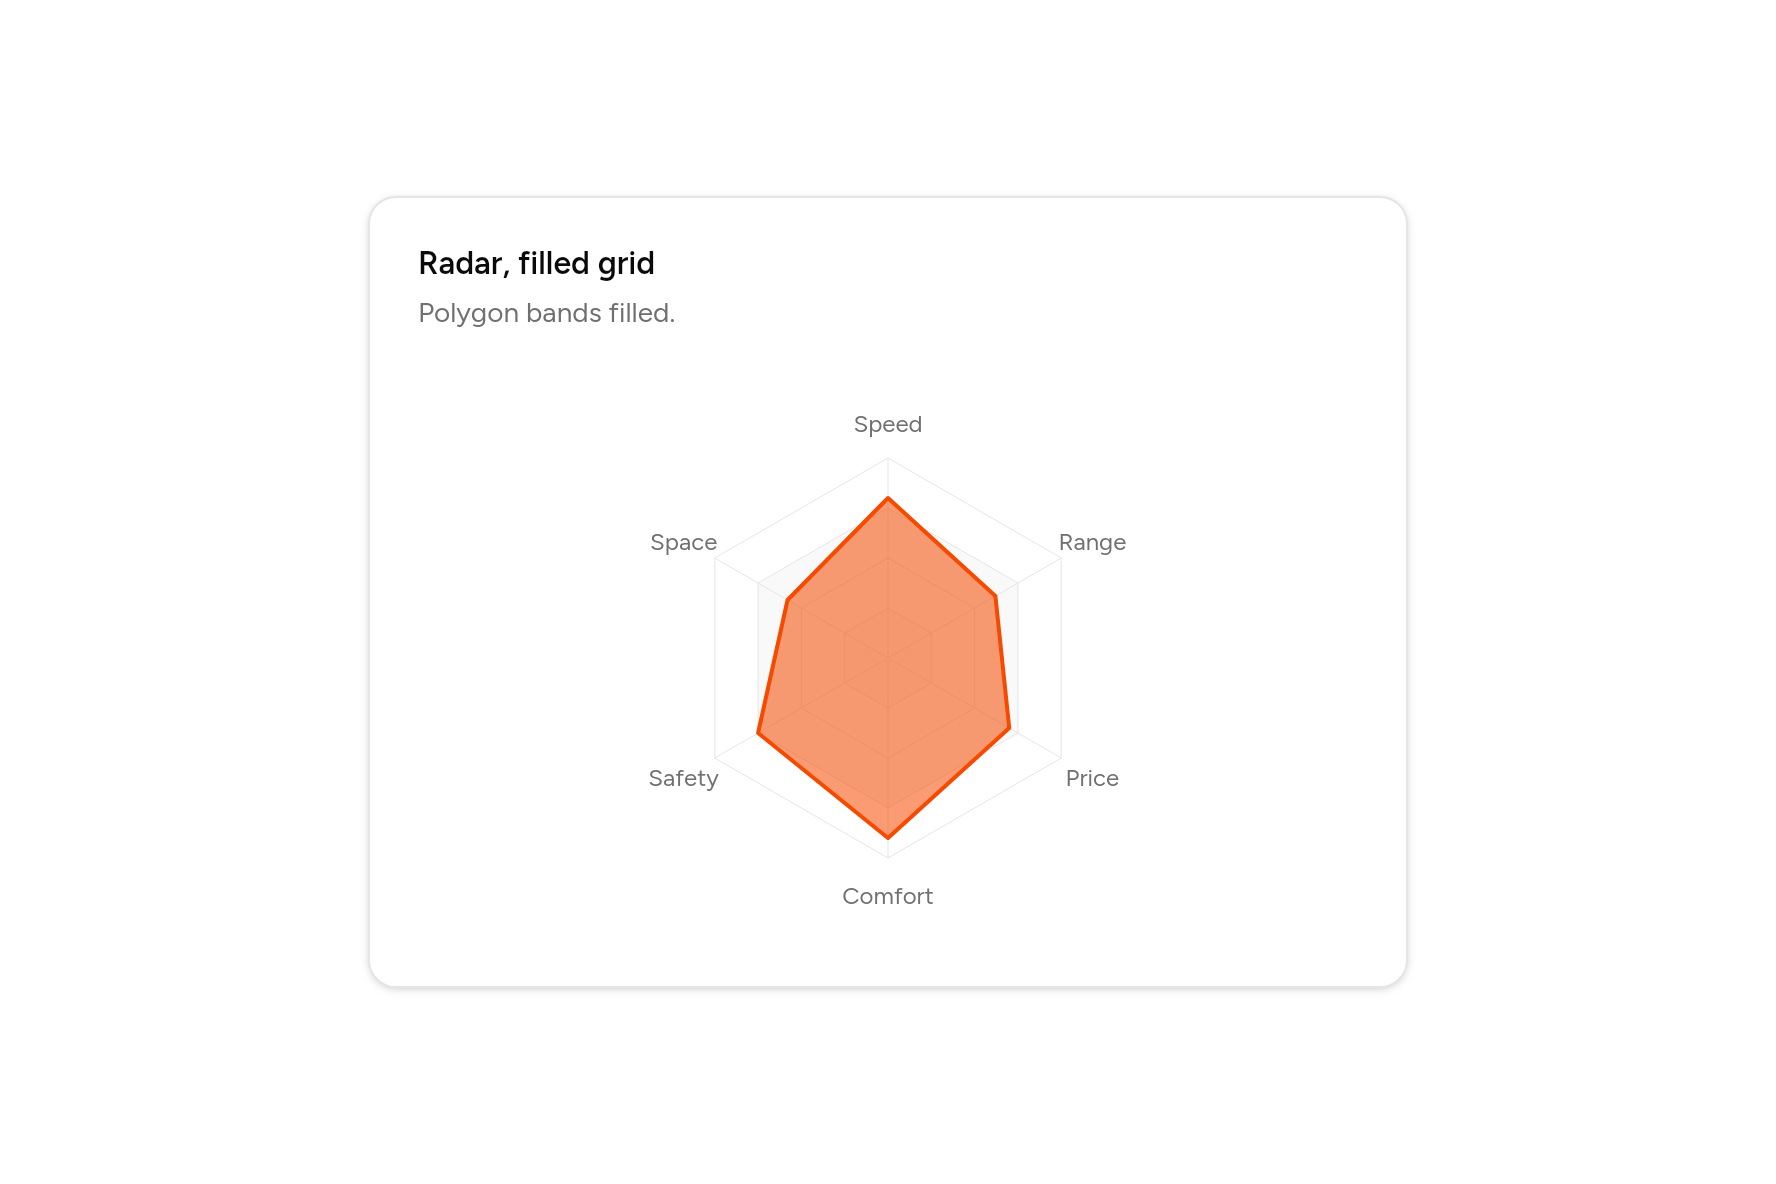
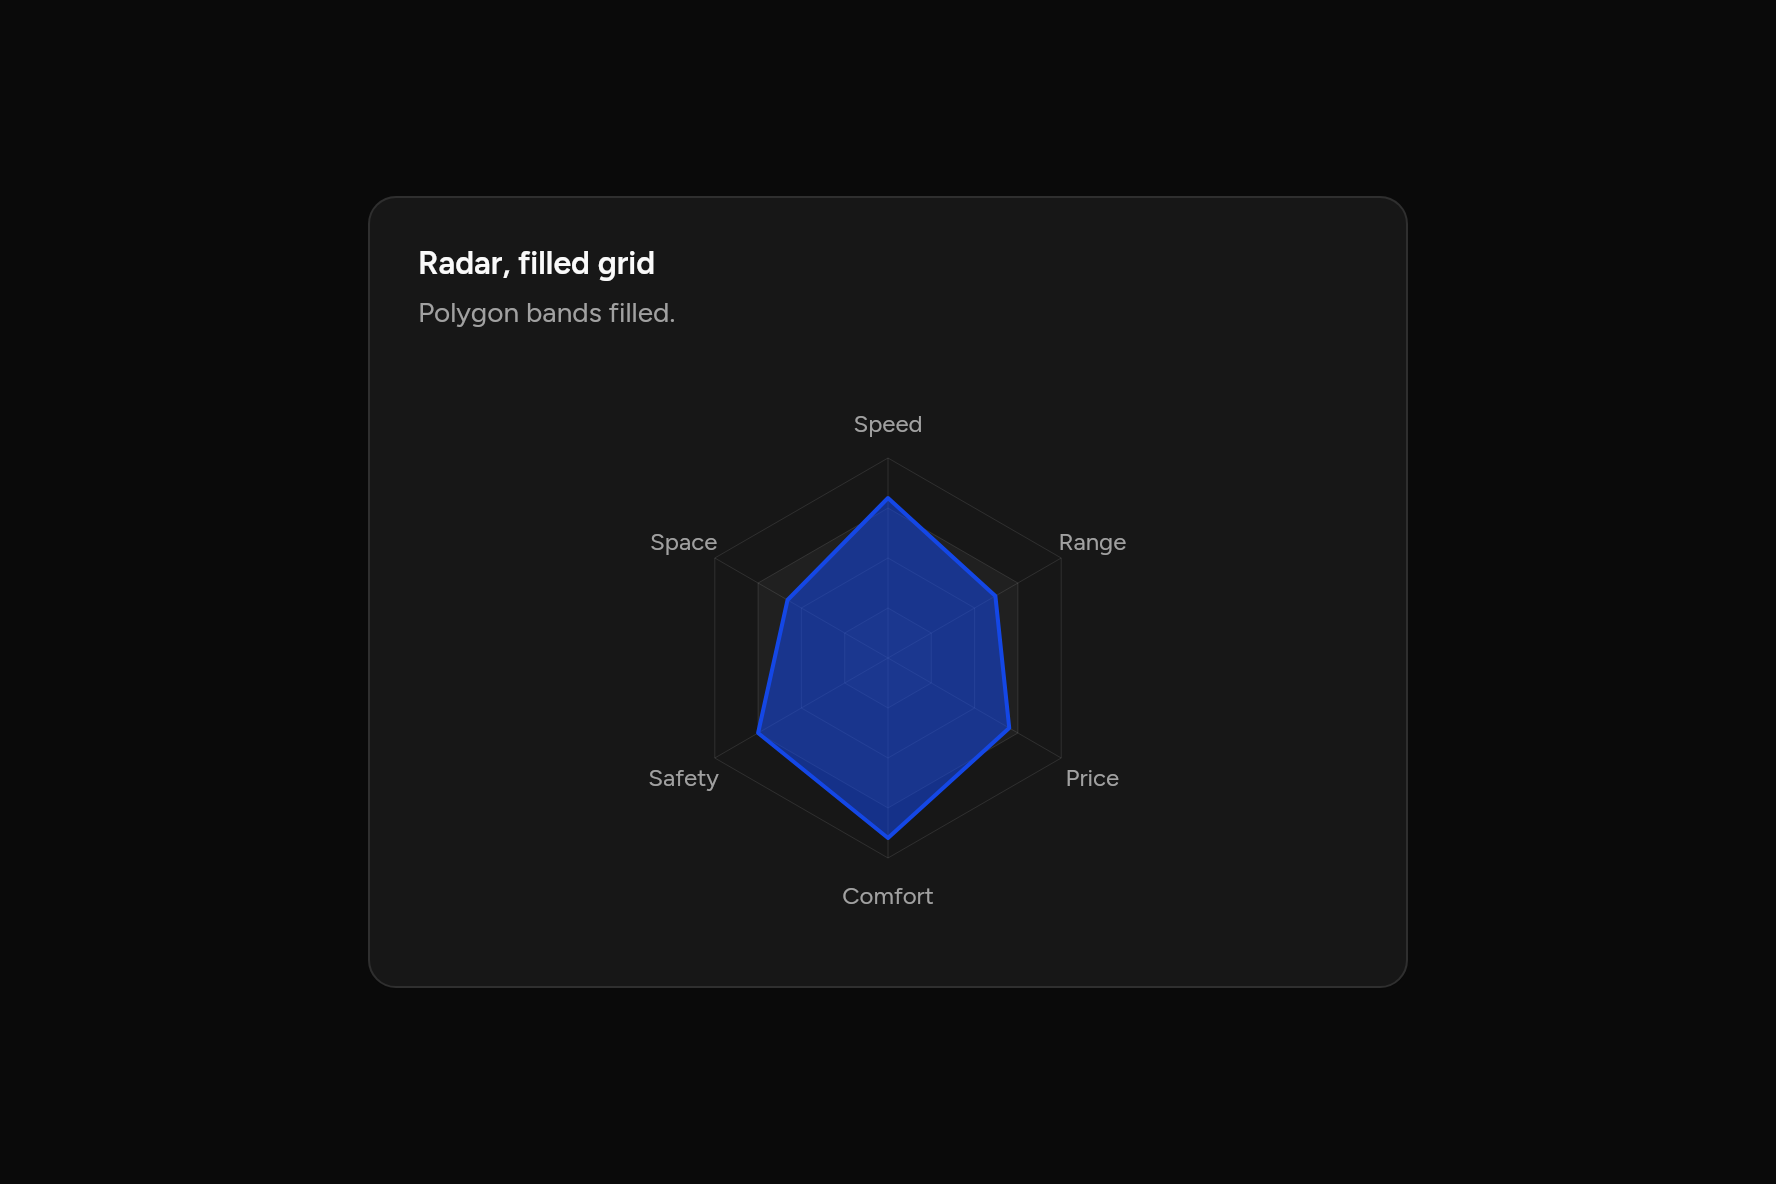
Radar, filled grid
Polygon bands filled.
Code
// Radar, filled grid: Polygon bands filled. Sample data.
import 'package:flutter/widgets.dart';

import 'ui/card.dart';
import 'ui/chart.dart';

class RadarGridFillChart extends StatelessWidget {
  const RadarGridFillChart({super.key});

  @override
  Widget build(BuildContext context) => SizedBox(
    width: 520,
    child: Card(
      children: [
        const CardHeader(
          title: Text("Radar, filled grid"),
          description: Text("Polygon bands filled."),
        ),
        CardContent(
          child: RadarChart(
            labels: ['Speed', 'Range', 'Price', 'Comfort', 'Safety', 'Space'],
            series: const [
              ChartSeries('This year', [80, 62, 70, 90, 75, 58]),
            ],
            gridFill: true,
          ),
        ),
      ],
    ),
  );
}
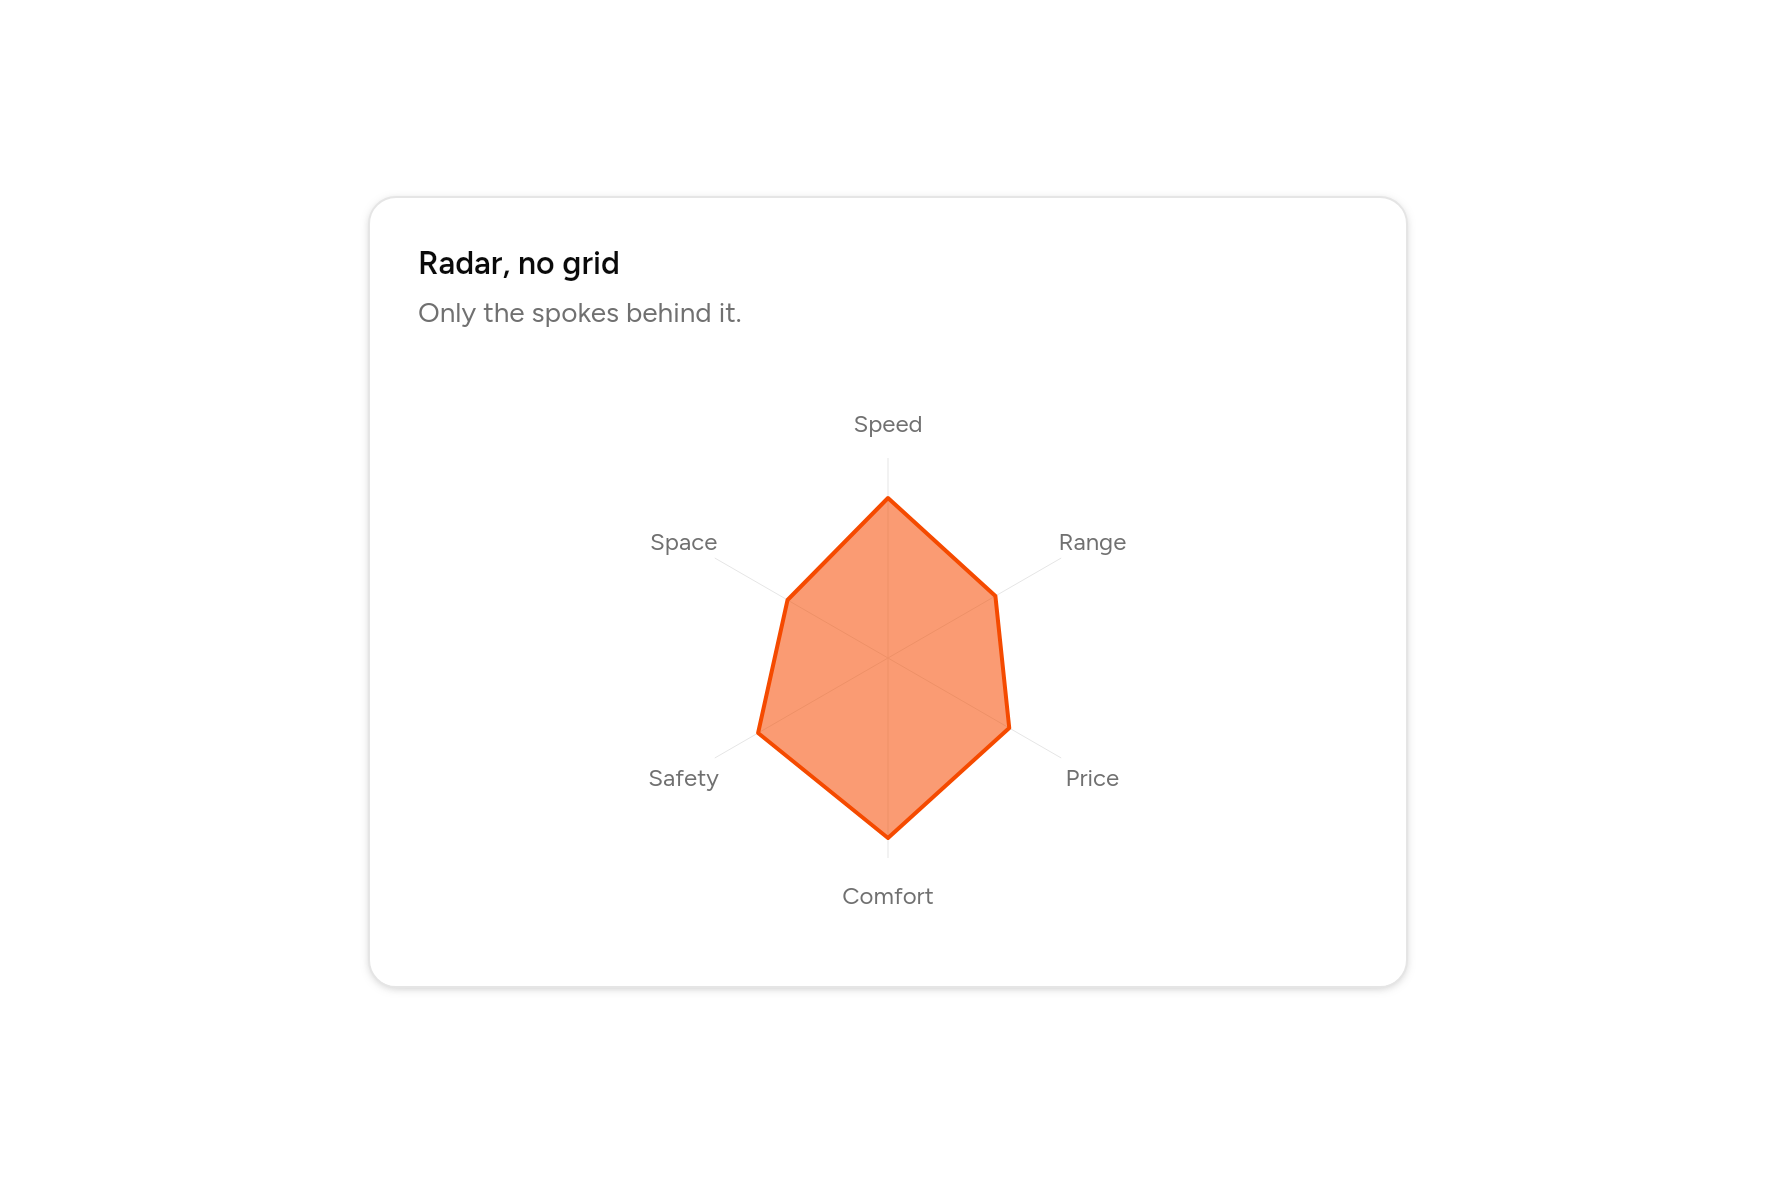
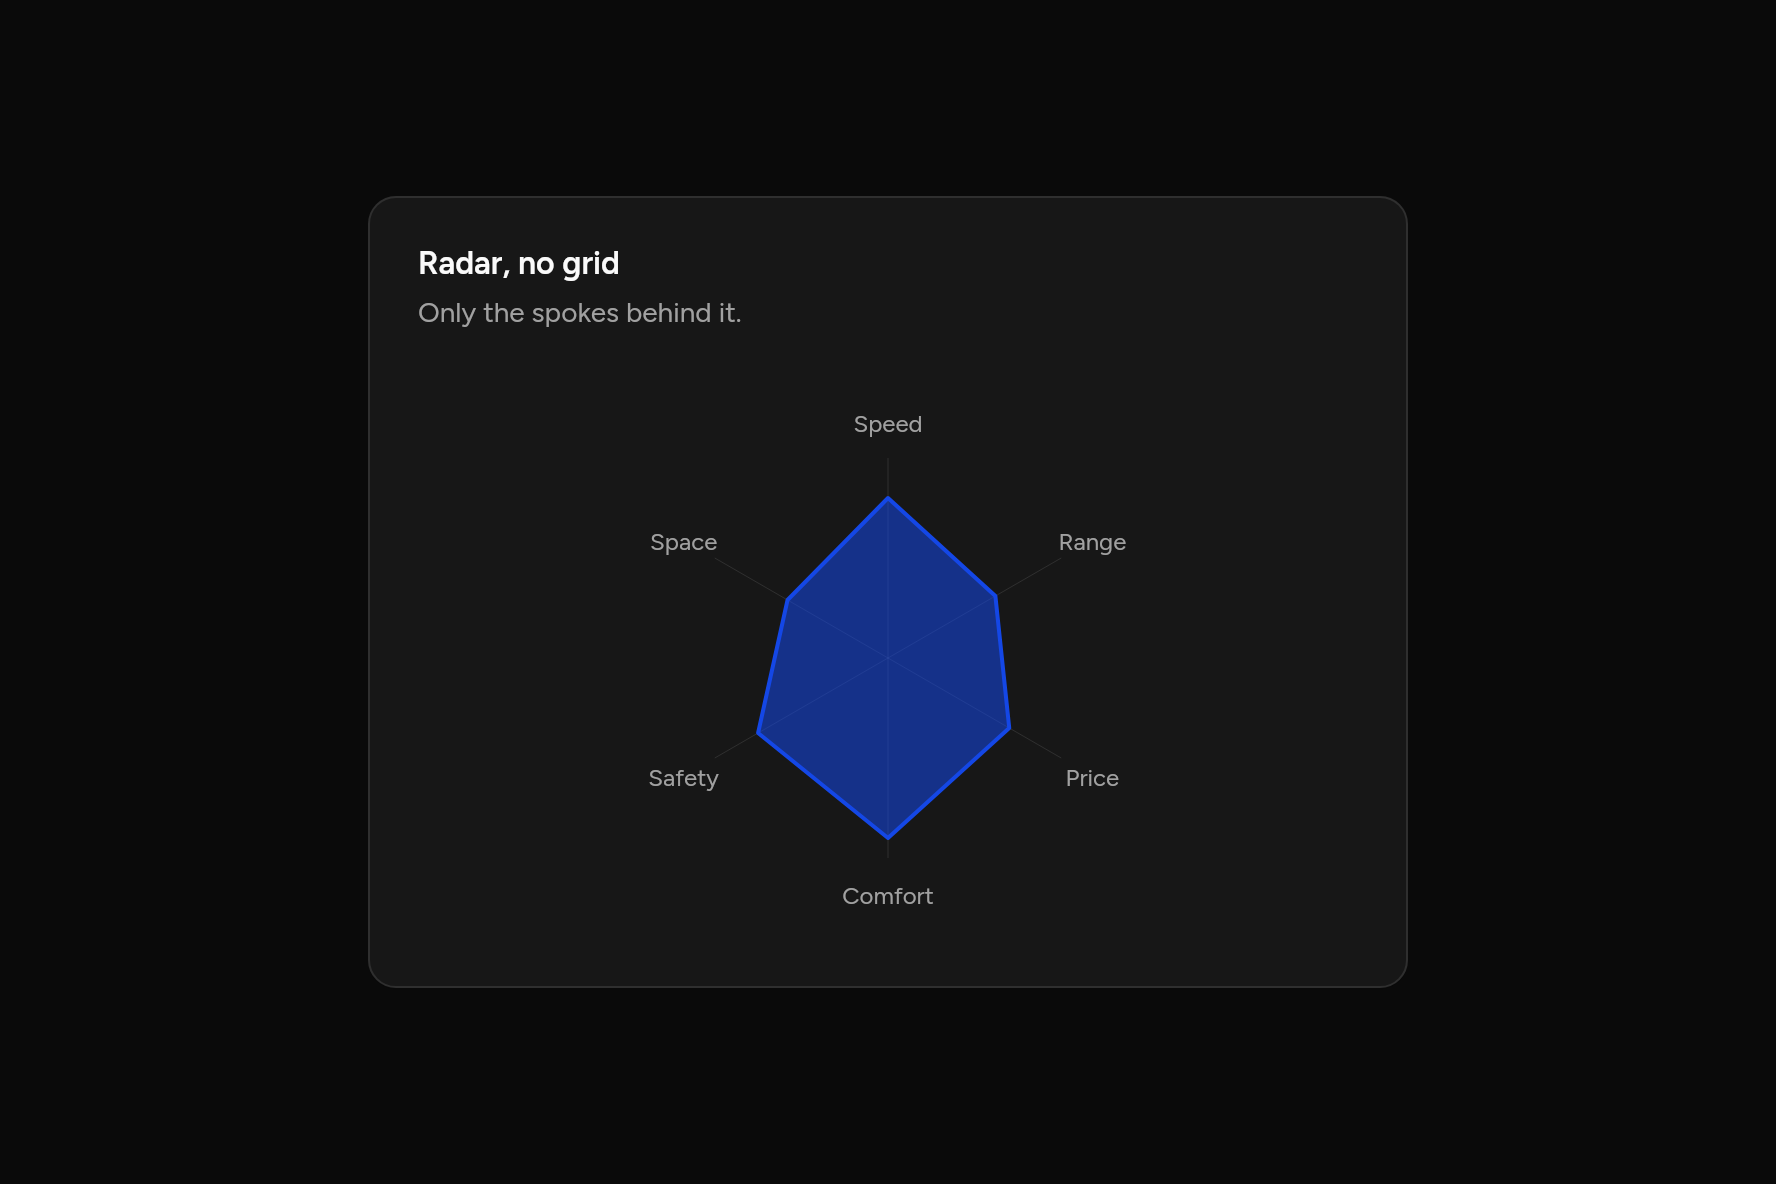
Radar, no grid
Only the spokes behind it.
Code
// Radar, no grid: Only the spokes behind it. Sample data.
import 'package:flutter/widgets.dart';

import 'ui/card.dart';
import 'ui/chart.dart';

class RadarGridNoneChart extends StatelessWidget {
  const RadarGridNoneChart({super.key});

  @override
  Widget build(BuildContext context) => SizedBox(
    width: 520,
    child: Card(
      children: [
        const CardHeader(
          title: Text("Radar, no grid"),
          description: Text("Only the spokes behind it."),
        ),
        CardContent(
          child: RadarChart(
            labels: ['Speed', 'Range', 'Price', 'Comfort', 'Safety', 'Space'],
            series: const [
              ChartSeries('This year', [80, 62, 70, 90, 75, 58]),
            ],
            grid: RadarGrid.none,
          ),
        ),
      ],
    ),
  );
}
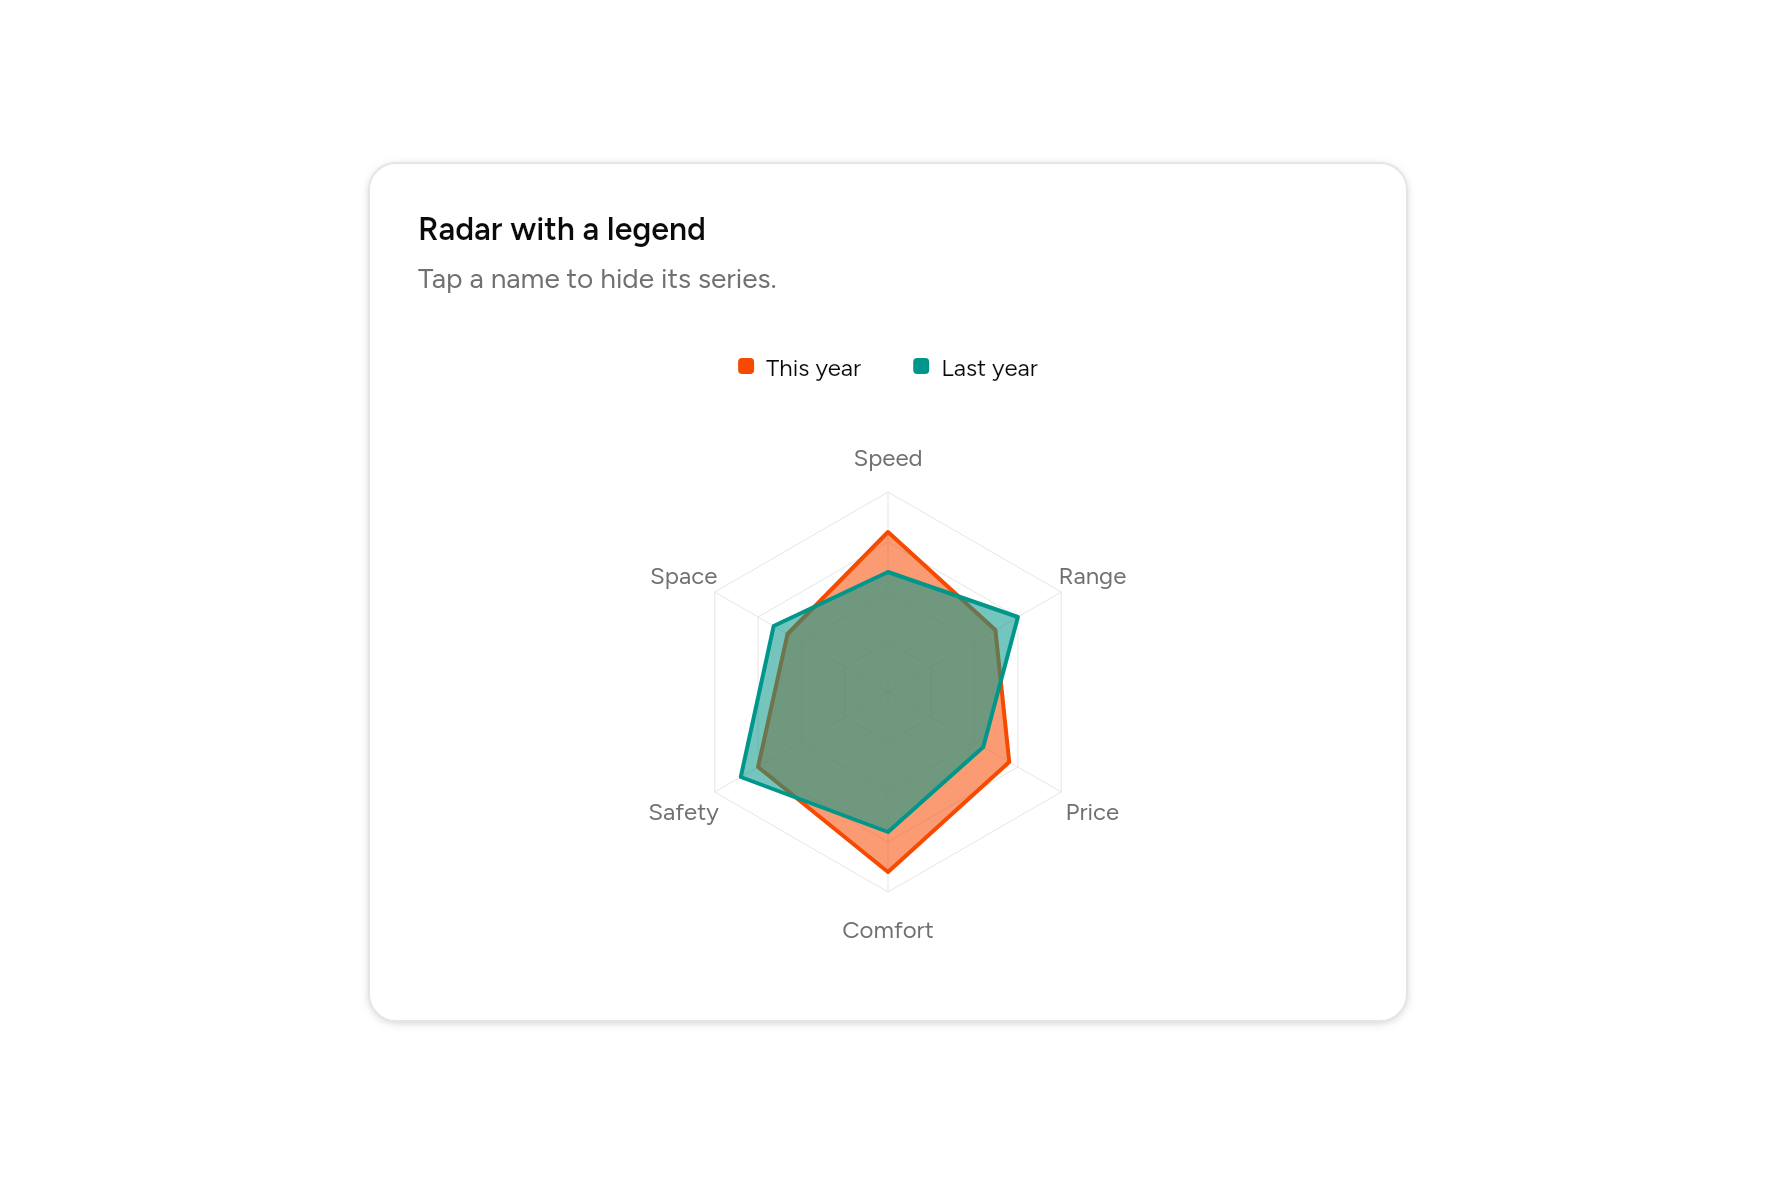
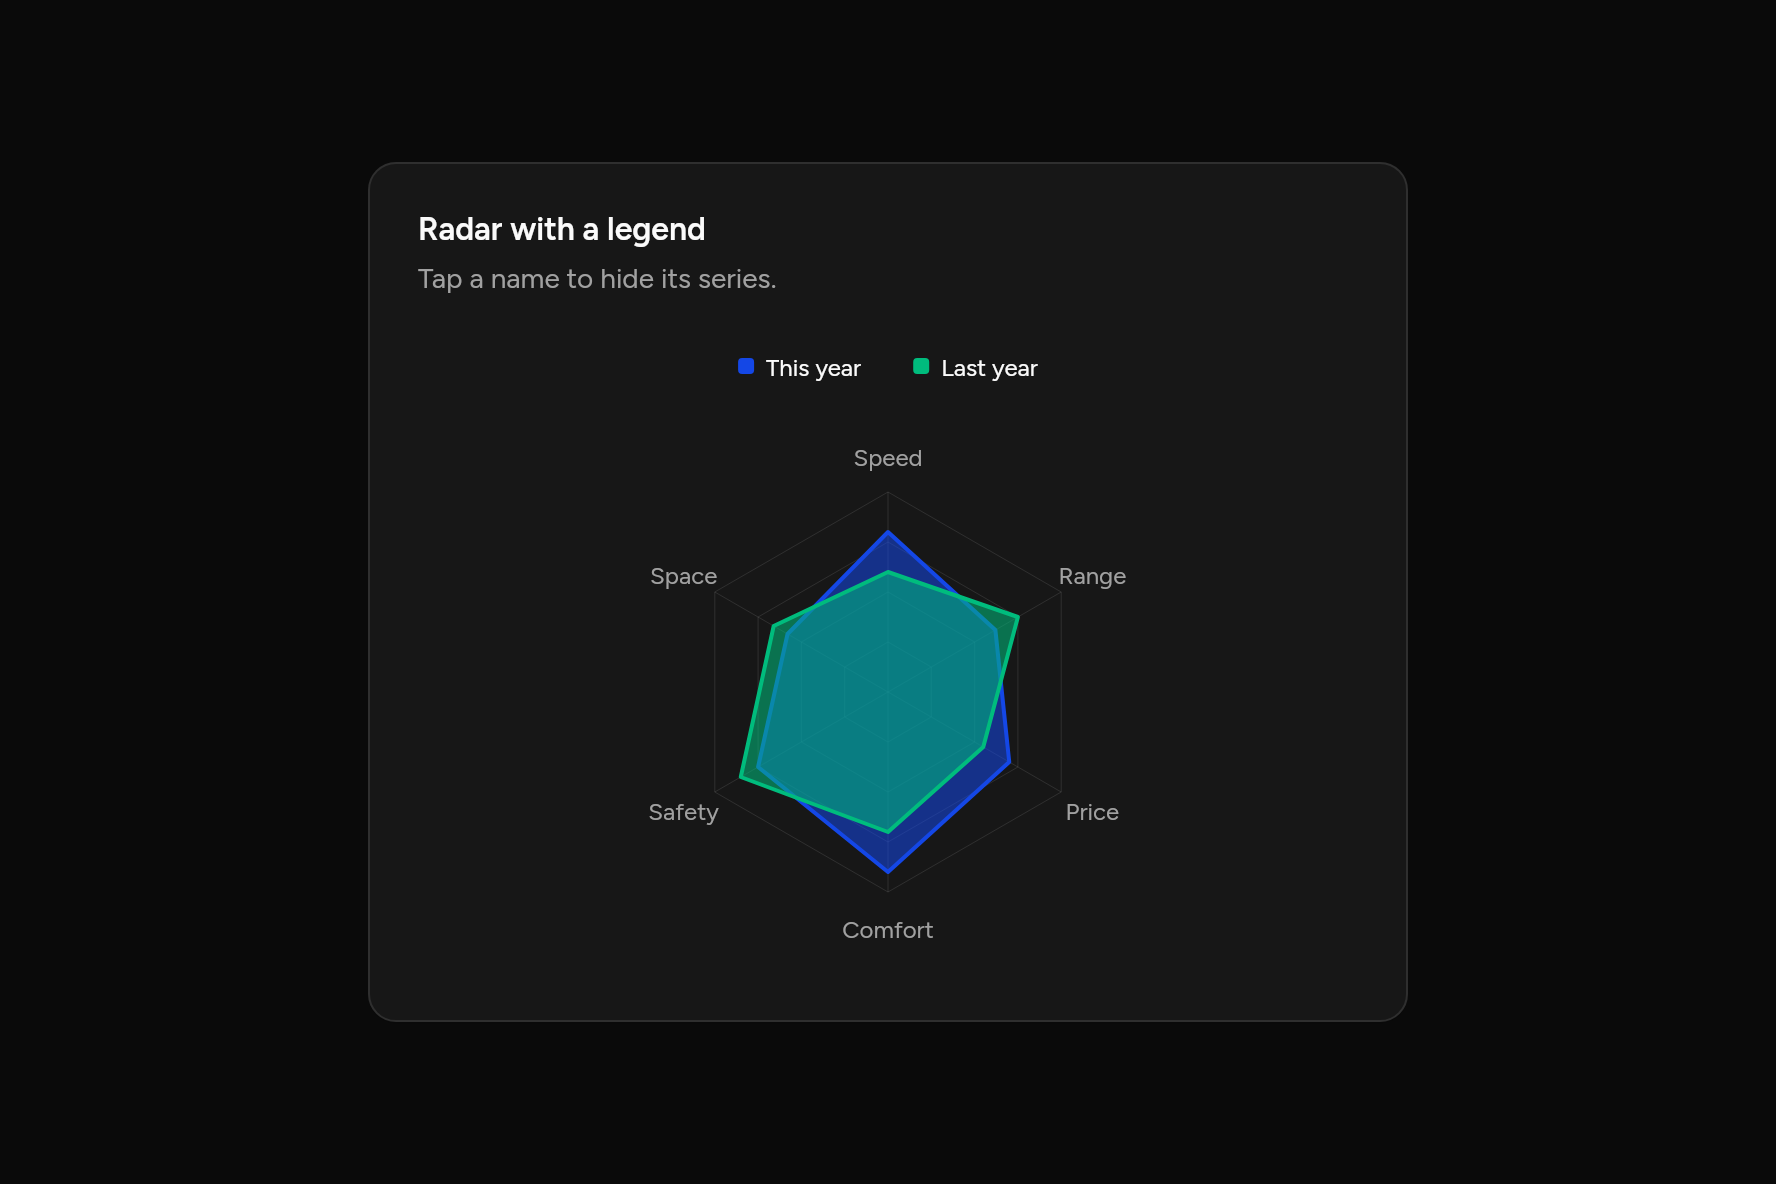
Radar with a legend
Tap a name to hide its series.
Code
// Radar with a legend: Tap a name to hide its series. Sample data.
import 'package:flutter/widgets.dart';

import 'ui/card.dart';
import 'ui/chart.dart';

class RadarLegendChart extends StatelessWidget {
  const RadarLegendChart({super.key});

  @override
  Widget build(BuildContext context) => SizedBox(
    width: 520,
    child: Card(
      children: [
        const CardHeader(
          title: Text("Radar with a legend"),
          description: Text("Tap a name to hide its series."),
        ),
        CardContent(
          child: RadarChart(
            labels: ['Speed', 'Range', 'Price', 'Comfort', 'Safety', 'Space'],
            series: const [
              ChartSeries('This year', [80, 62, 70, 90, 75, 58]),
              ChartSeries('Last year', [60, 75, 55, 70, 85, 66]),
            ],
            legend: ChartLegend.top,
          ),
        ),
      ],
    ),
  );
}
Radial
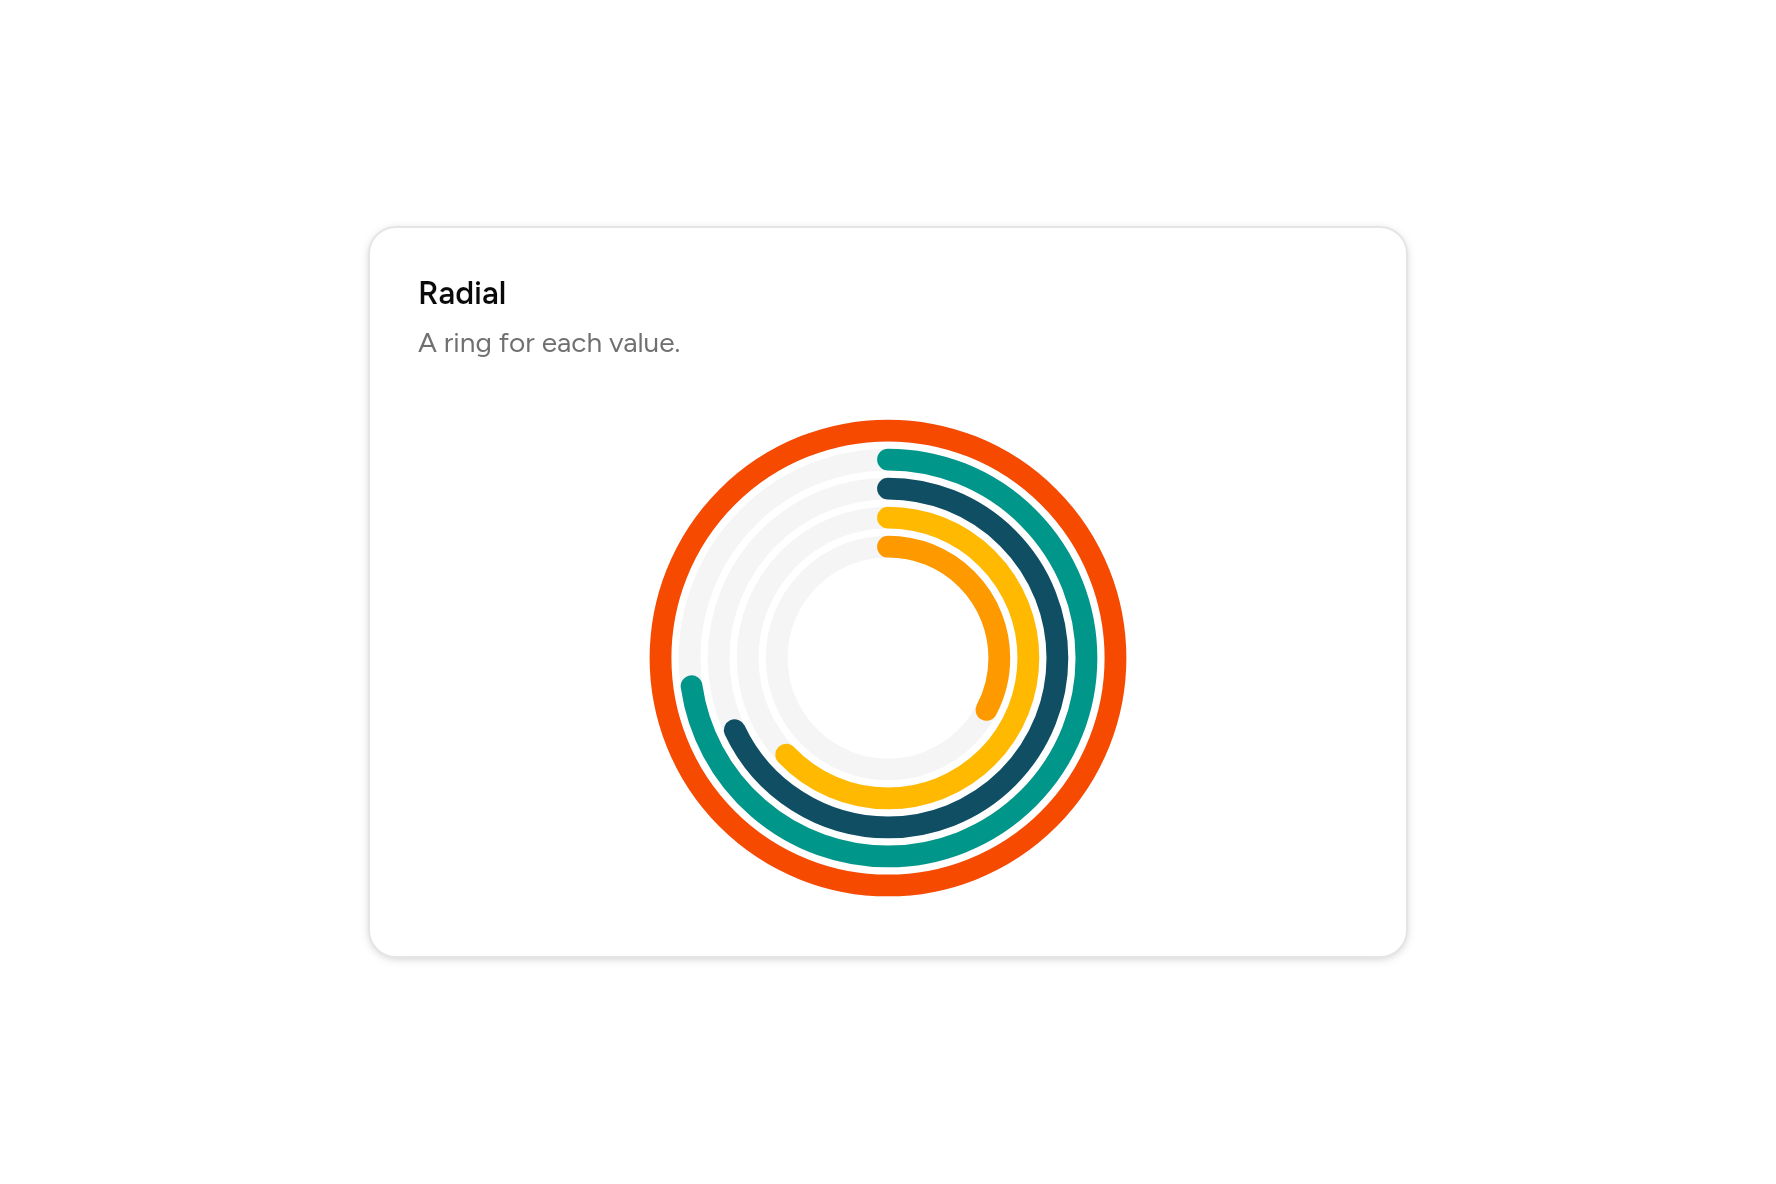
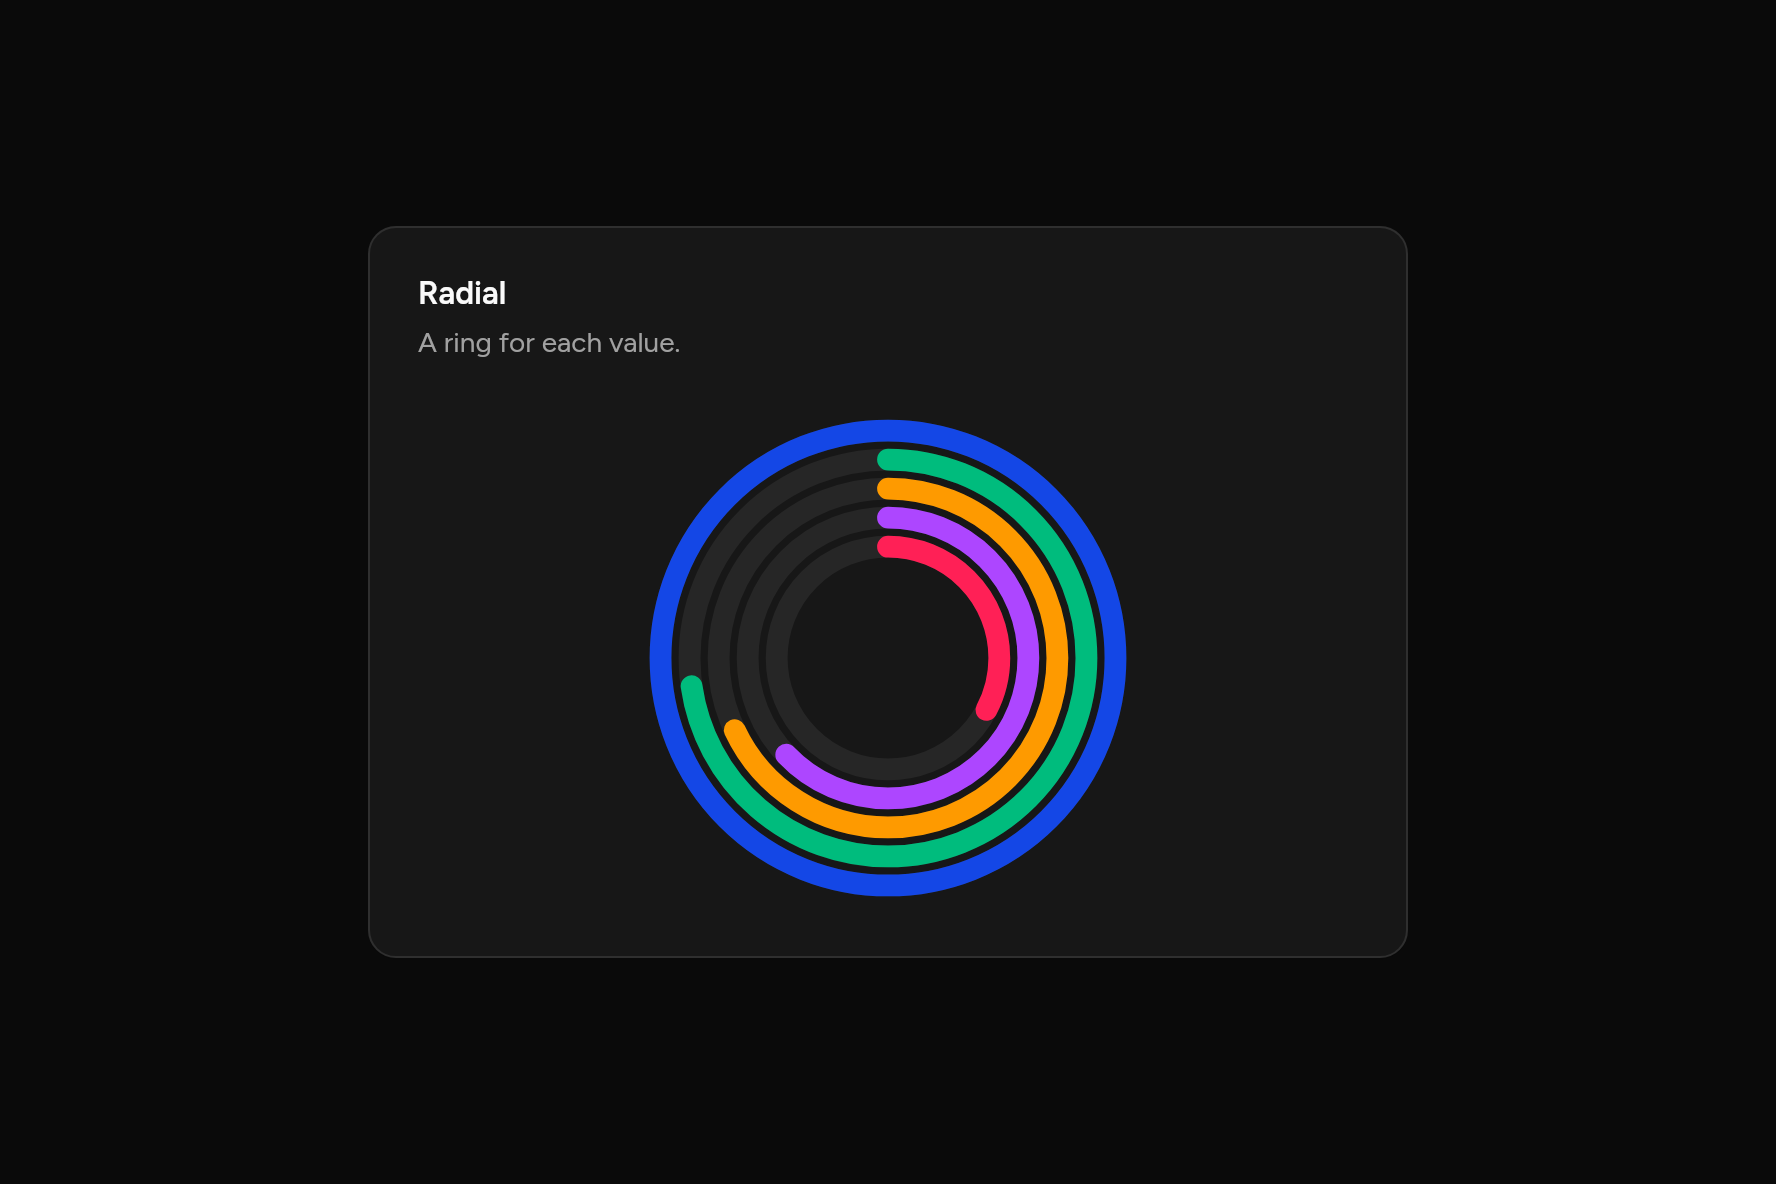
Radial
A ring for each value.
Code
// Radial: A ring for each value. Sample data.
import 'package:flutter/widgets.dart';

import 'ui/card.dart';
import 'ui/chart.dart';

class RadialSimpleChart extends StatelessWidget {
  const RadialSimpleChart({super.key});

  @override
  Widget build(BuildContext context) => SizedBox(
    width: 520,
    child: Card(
      children: [
        const CardHeader(
          title: Text("Radial"),
          description: Text("A ring for each value."),
        ),
        CardContent(
          child: RadialChart(
            slices: const [
              ChartSlice('Chrome', 275),
              ChartSlice('Safari', 200),
              ChartSlice('Firefox', 187),
              ChartSlice('Edge', 173),
              ChartSlice('Other', 90),
            ],
          ),
        ),
      ],
    ),
  );
}
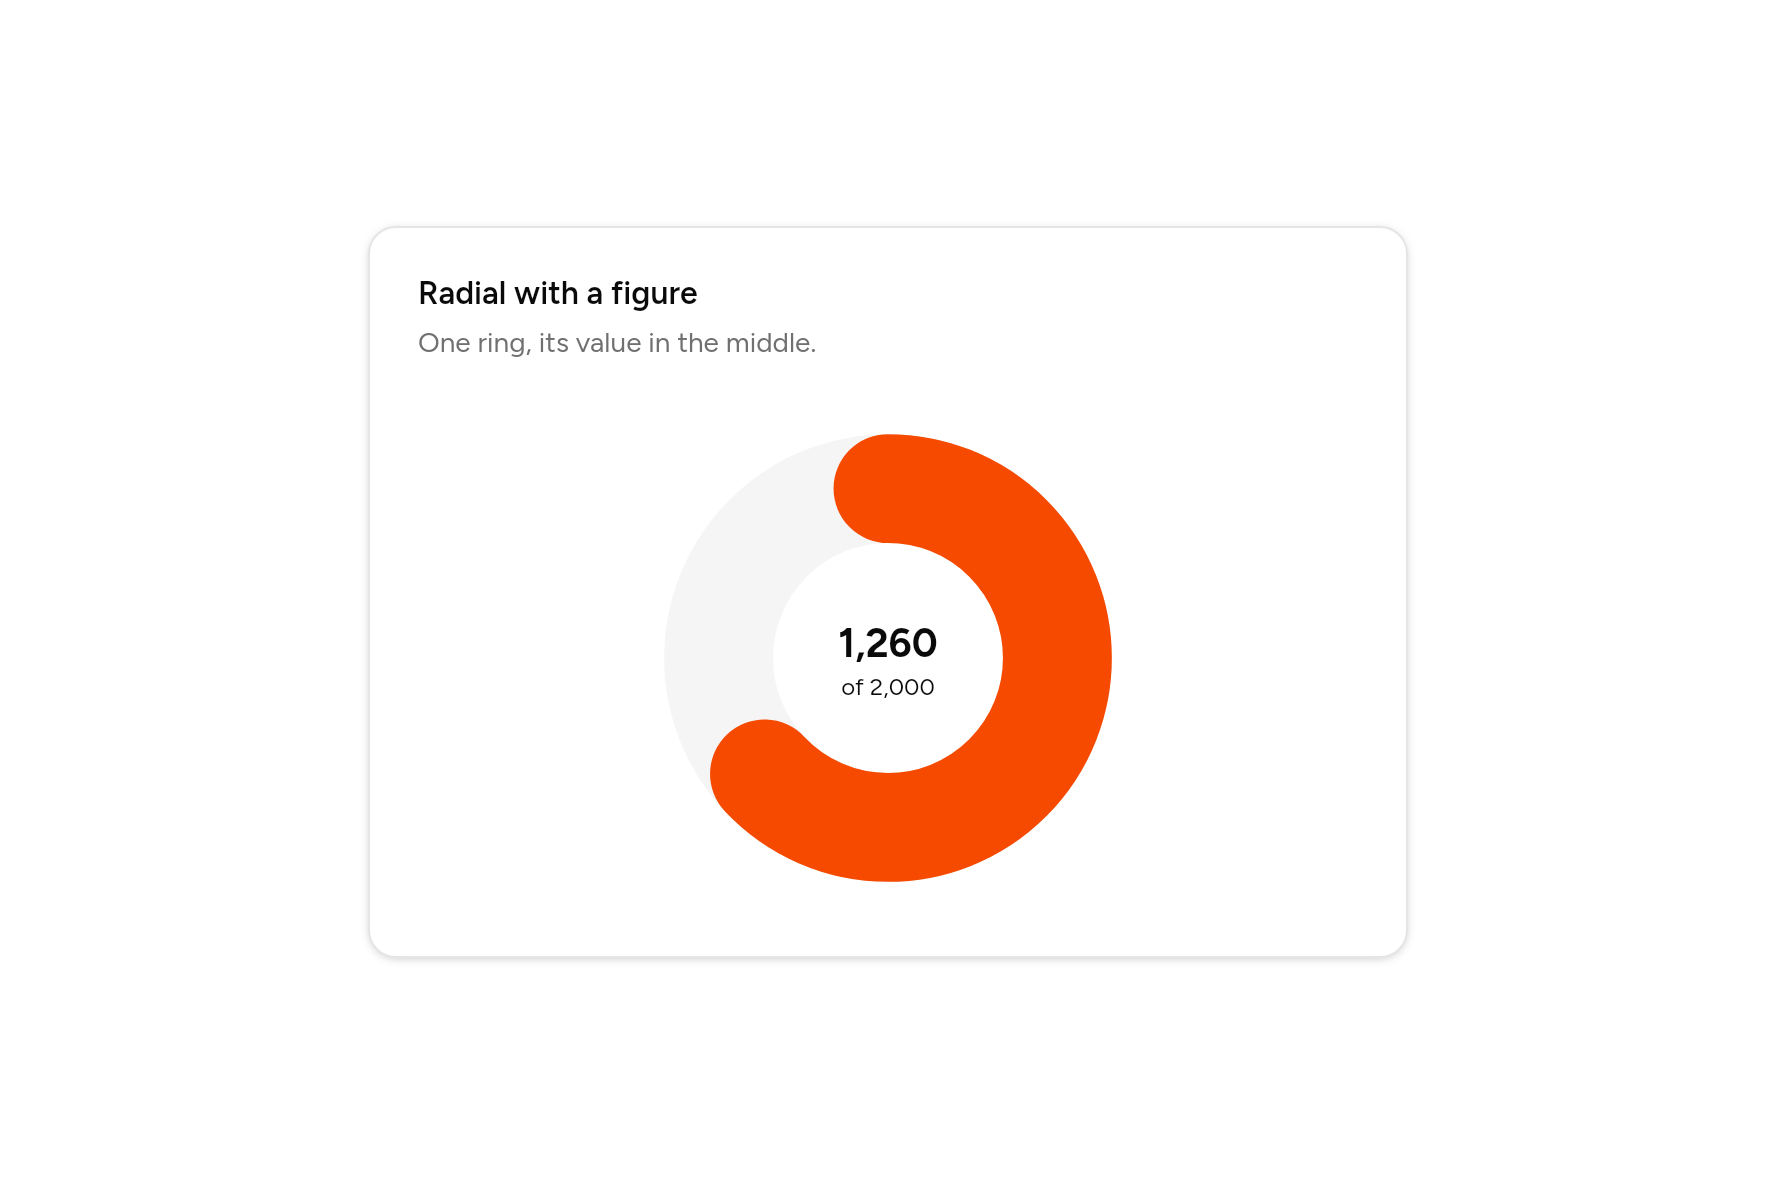
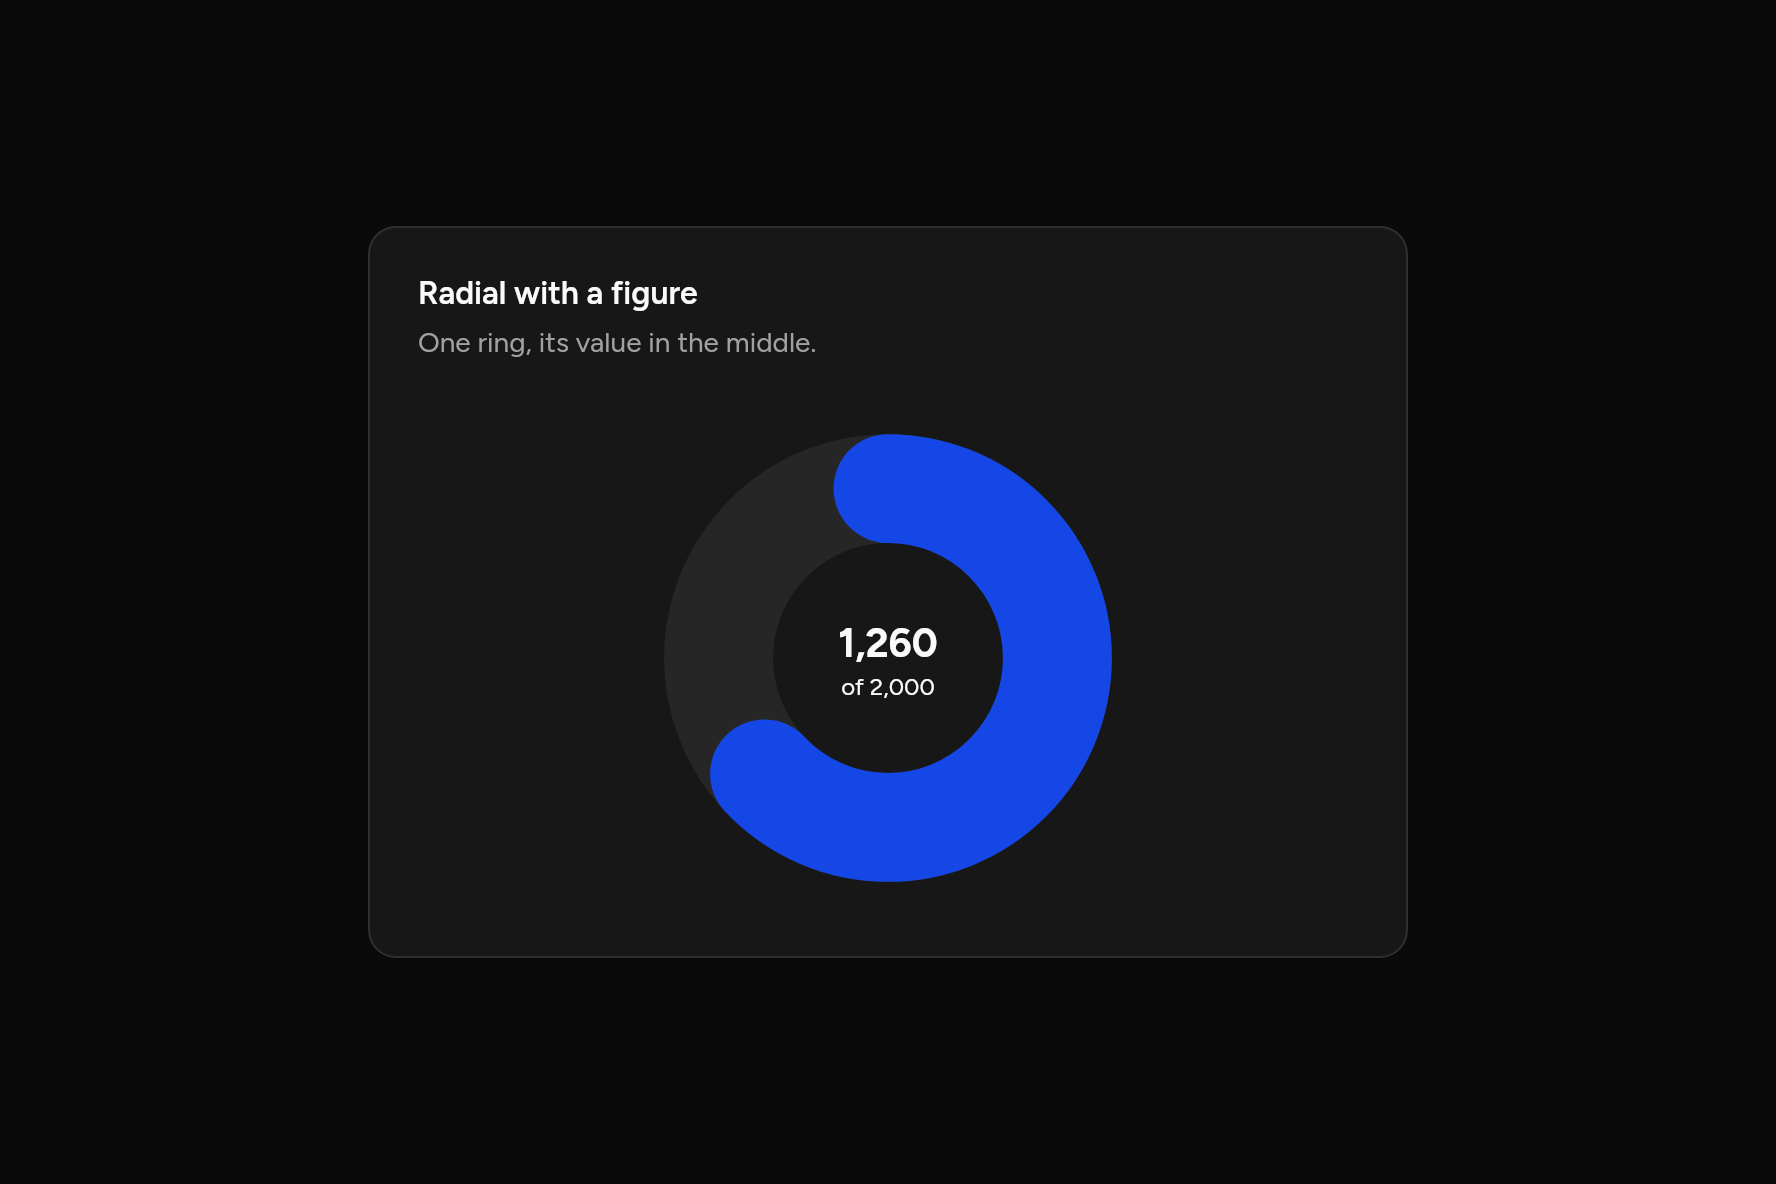
Radial with a figure
One ring, its value in the middle.
Code
// Radial with a figure: One ring, its value in the middle. Sample data.
import 'package:flutter/widgets.dart';

import 'ui/card.dart';
import 'ui/chart.dart';

class RadialTextChart extends StatelessWidget {
  const RadialTextChart({super.key});

  @override
  Widget build(BuildContext context) => SizedBox(
    width: 520,
    child: Card(
      children: [
        const CardHeader(
          title: Text("Radial with a figure"),
          description: Text("One ring, its value in the middle."),
        ),
        CardContent(
          child: const RadialChart(
            slices: [ChartSlice('Visitors', 1260)],
            max: 2000,
            center: Column(
              mainAxisSize: MainAxisSize.min,
              children: [
                Text('1,260'),
                Text('of 2,000', style: TextStyle(fontSize: 12, fontWeight: FontWeight.w400)),
              ],
            ),
          ),
        ),
      ],
    ),
  );
}
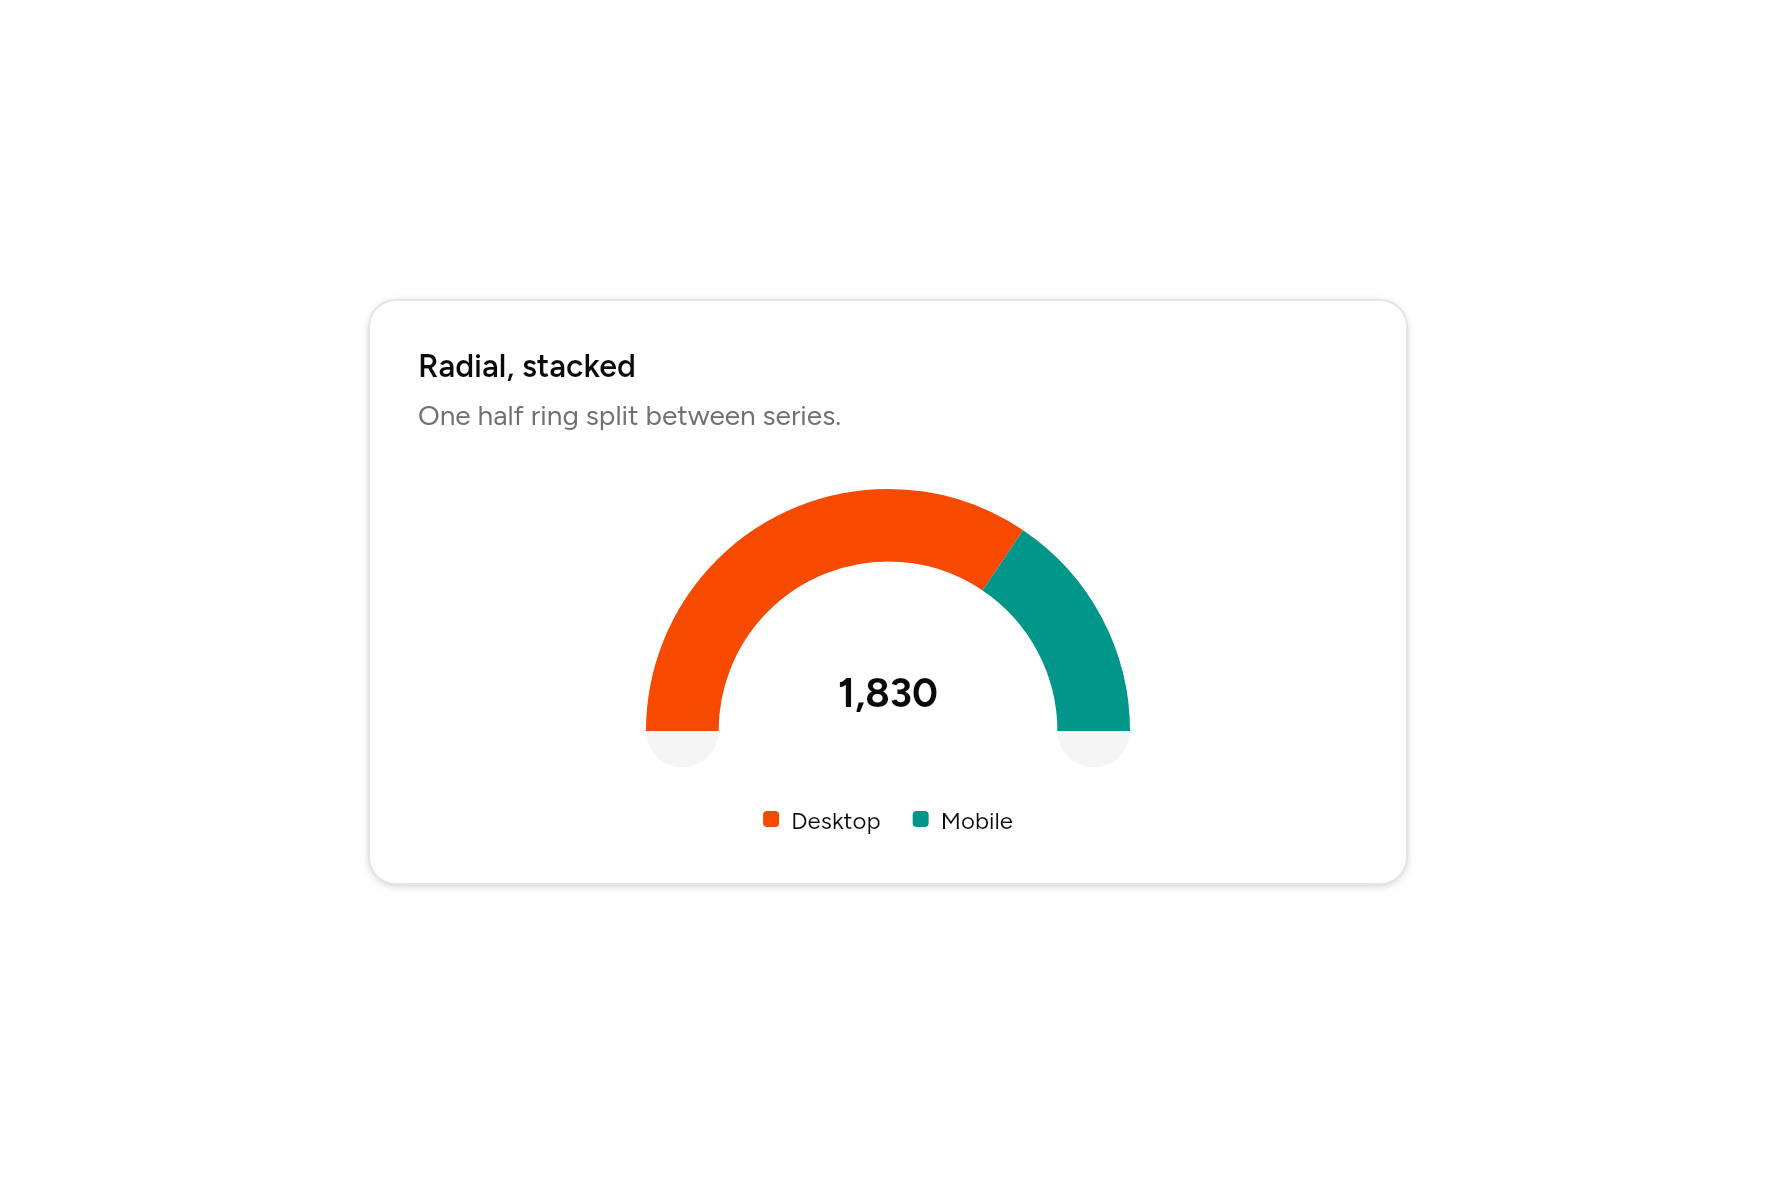
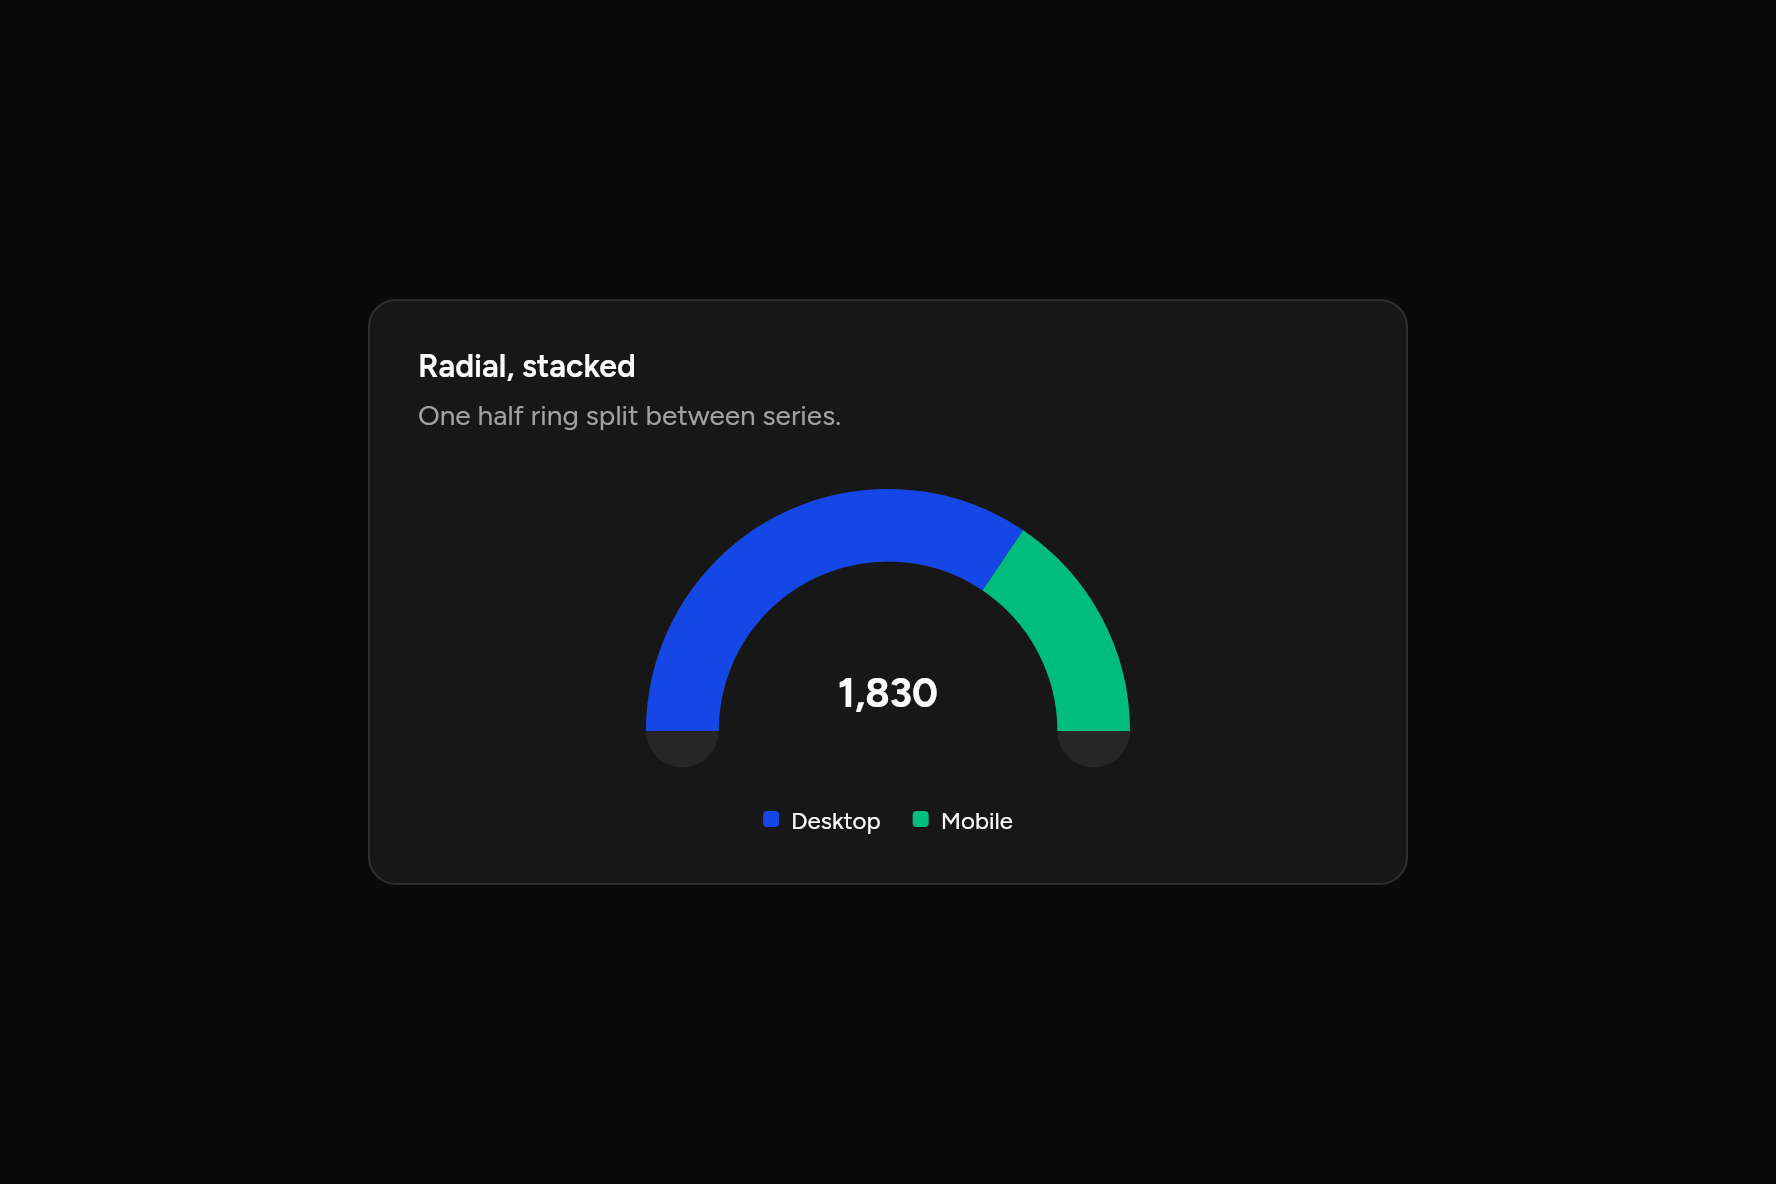
Radial, stacked
One half ring split between series.
Code
// Radial, stacked: One half ring split between series. Sample data.
import 'package:flutter/widgets.dart';

import 'ui/card.dart';
import 'ui/chart.dart';

class RadialStackedChart extends StatelessWidget {
  const RadialStackedChart({super.key});

  @override
  Widget build(BuildContext context) => SizedBox(
    width: 520,
    child: Card(
      children: [
        const CardHeader(
          title: Text("Radial, stacked"),
          description: Text("One half ring split between series."),
        ),
        CardContent(
          child: const RadialChart(
            slices: [ChartSlice('Desktop', 1260), ChartSlice('Mobile', 570)],
            stacked: true,
            half: true,
            center: Text('1,830'),
            legend: ChartLegend.bottom,
          ),
        ),
      ],
    ),
  );
}
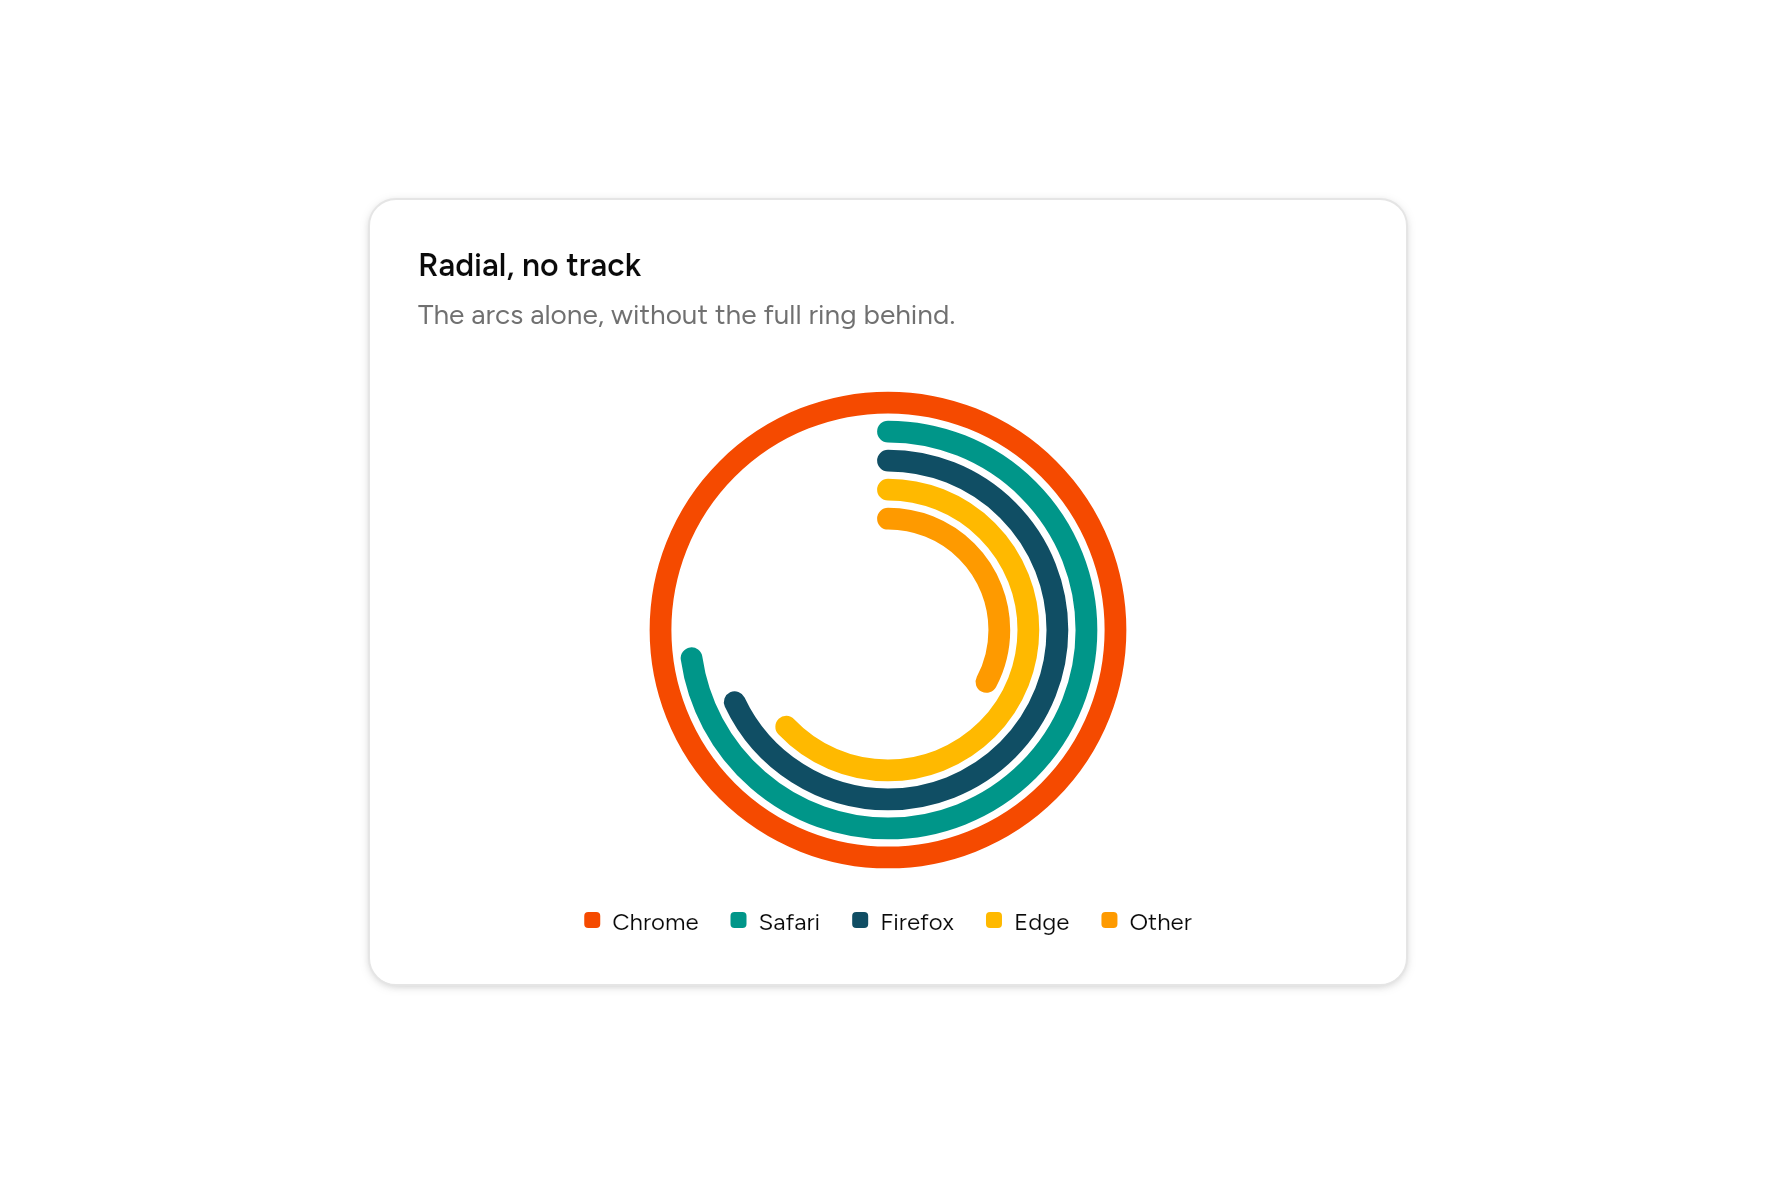
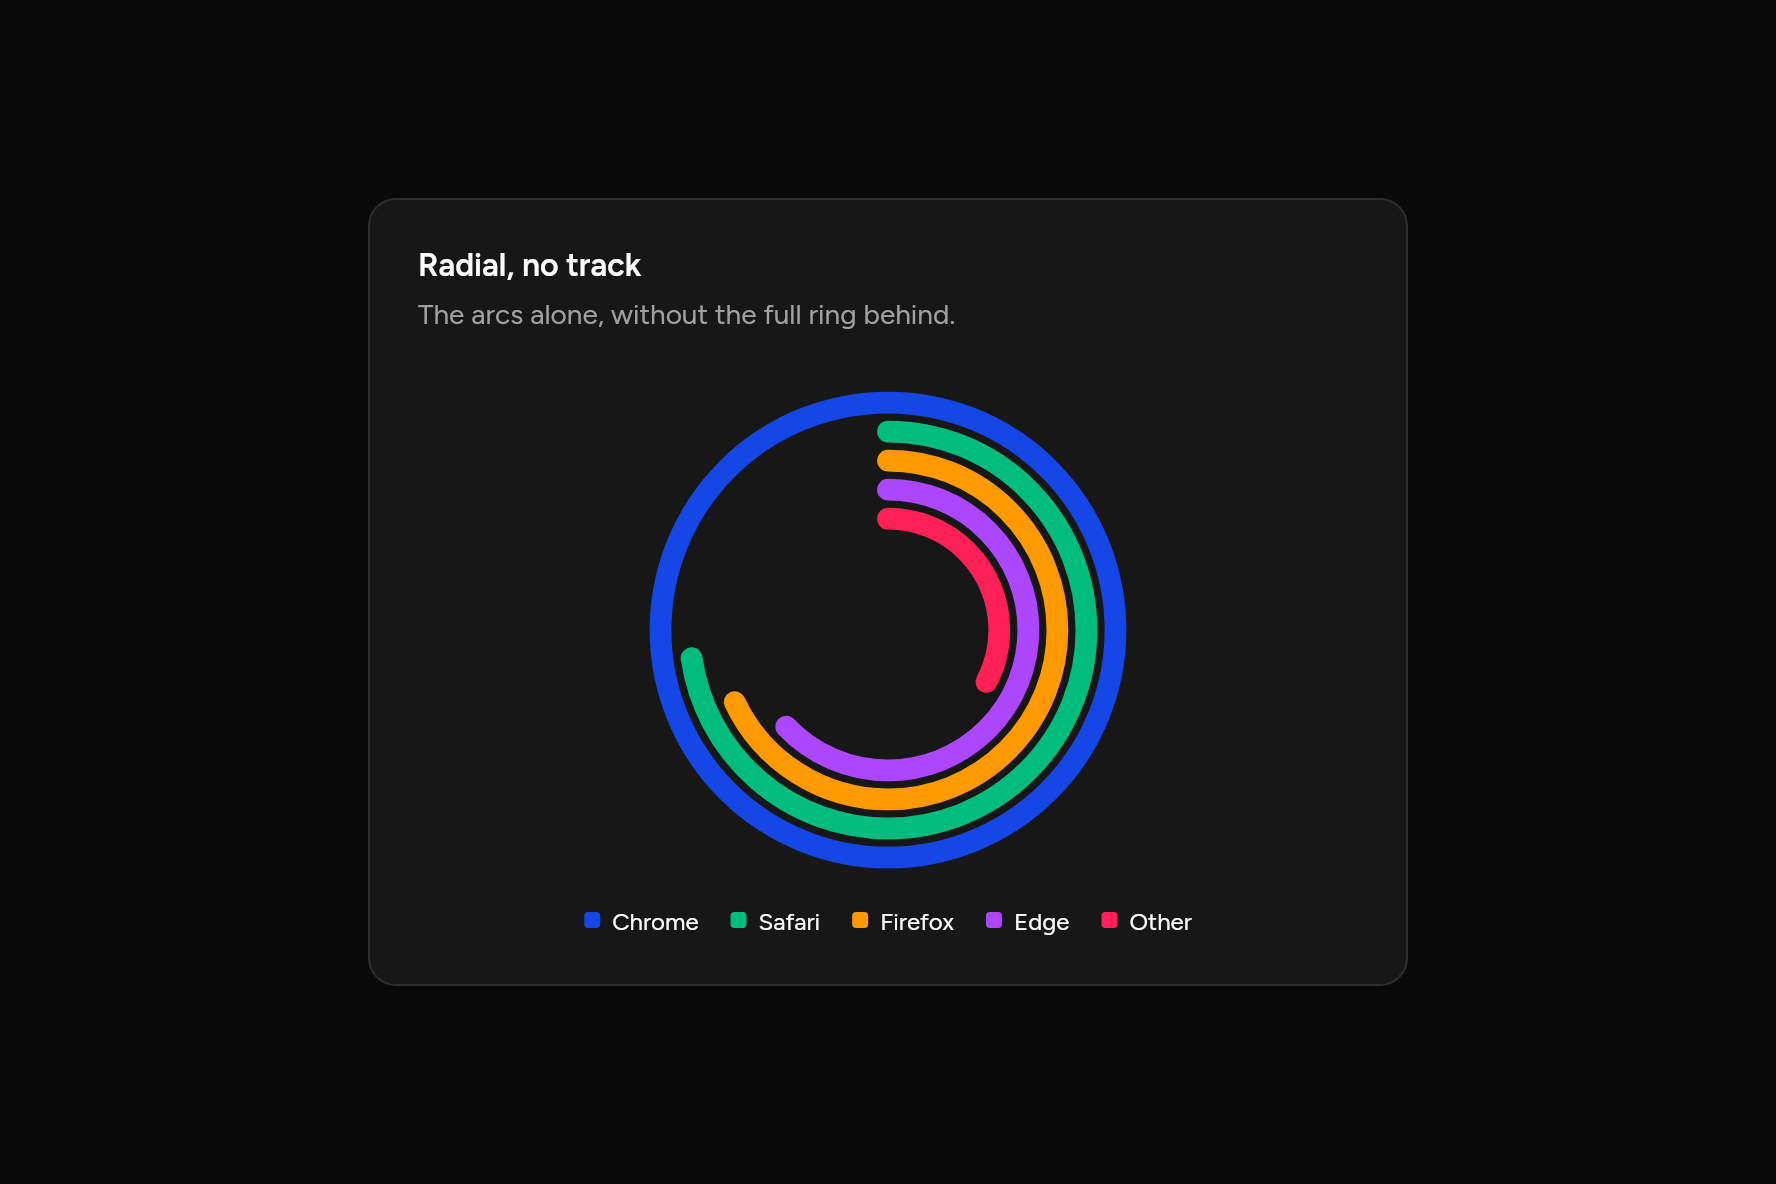
Radial, no track
The arcs alone, without the full ring behind.
Code
// Radial, no track: The arcs alone, without the full ring behind. Sample data.
import 'package:flutter/widgets.dart';

import 'ui/card.dart';
import 'ui/chart.dart';

class RadialShapeChart extends StatelessWidget {
  const RadialShapeChart({super.key});

  @override
  Widget build(BuildContext context) => SizedBox(
    width: 520,
    child: Card(
      children: [
        const CardHeader(
          title: Text("Radial, no track"),
          description: Text("The arcs alone, without the full ring behind."),
        ),
        CardContent(
          child: RadialChart(
            slices: const [
              ChartSlice('Chrome', 275),
              ChartSlice('Safari', 200),
              ChartSlice('Firefox', 187),
              ChartSlice('Edge', 173),
              ChartSlice('Other', 90),
            ],
            track: false,
            legend: ChartLegend.bottom,
          ),
        ),
      ],
    ),
  );
}
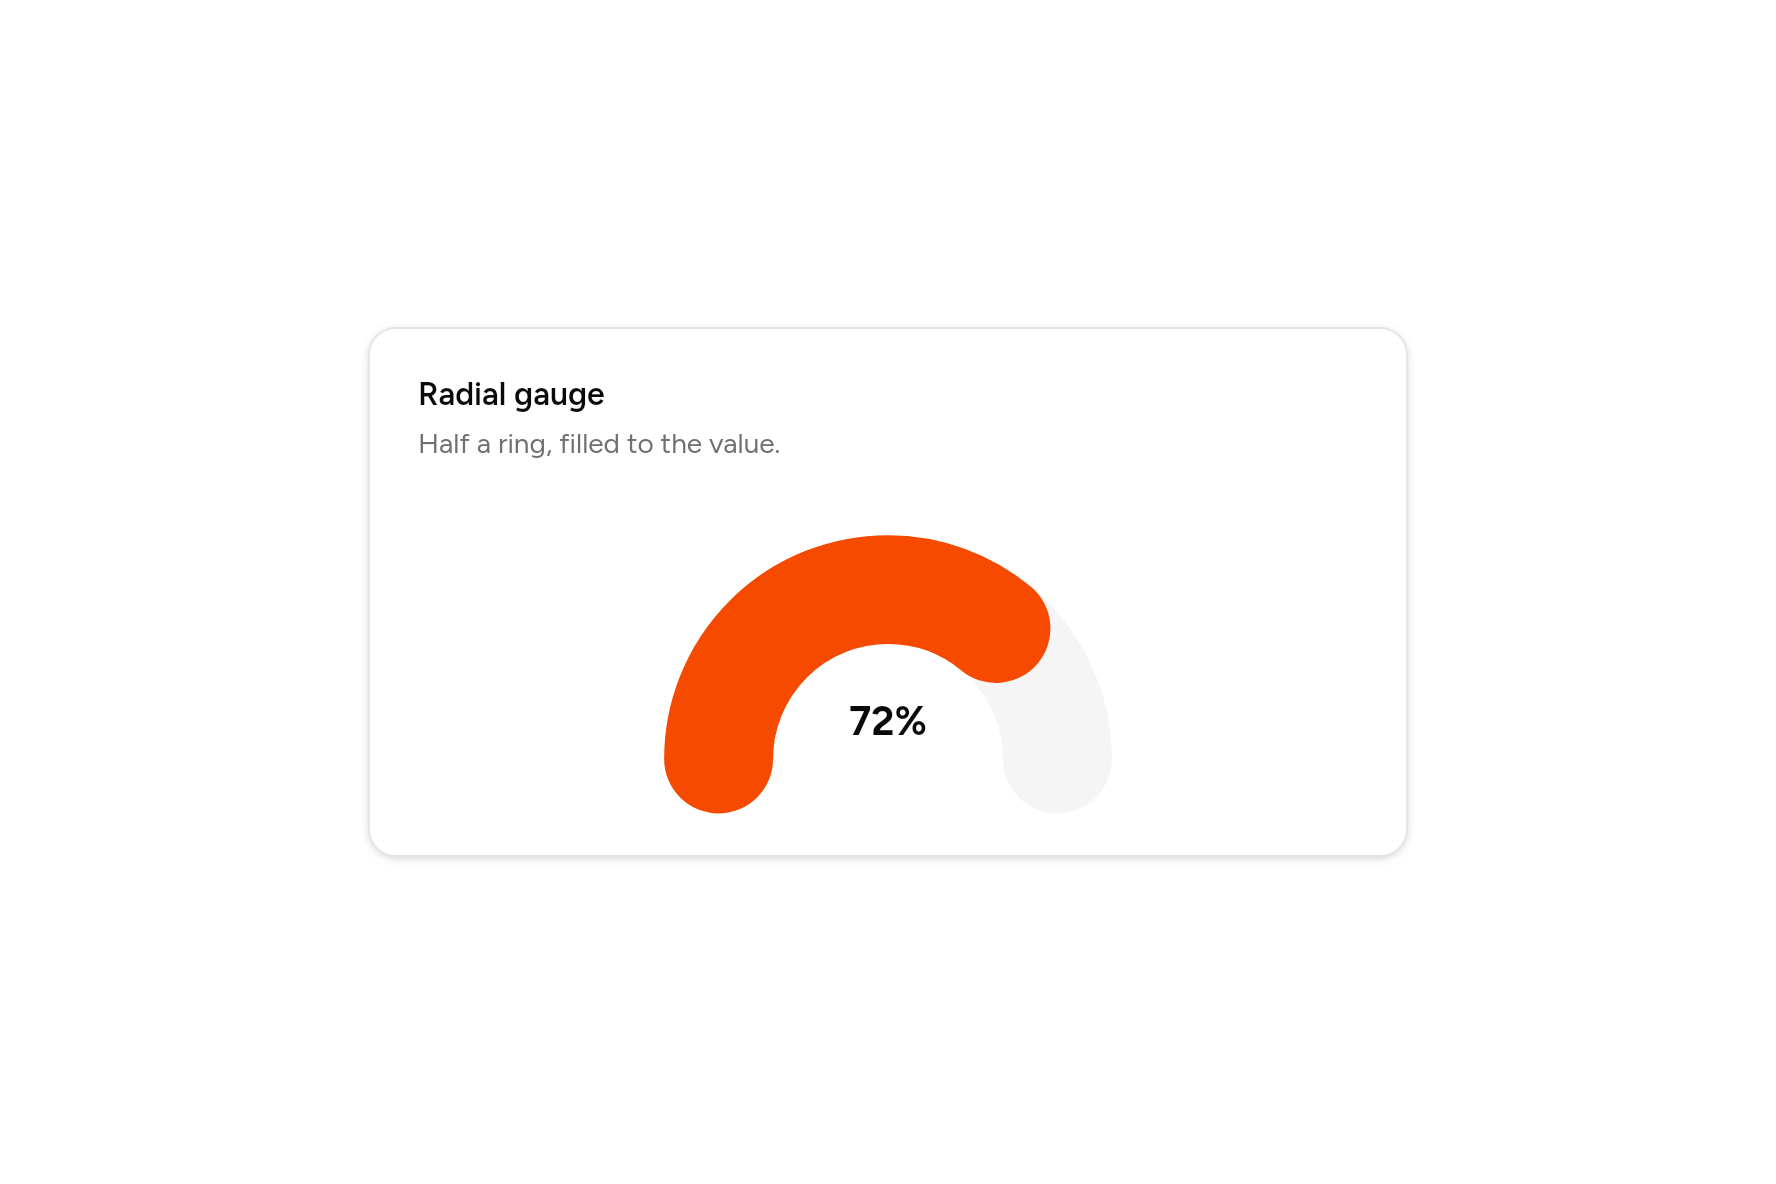
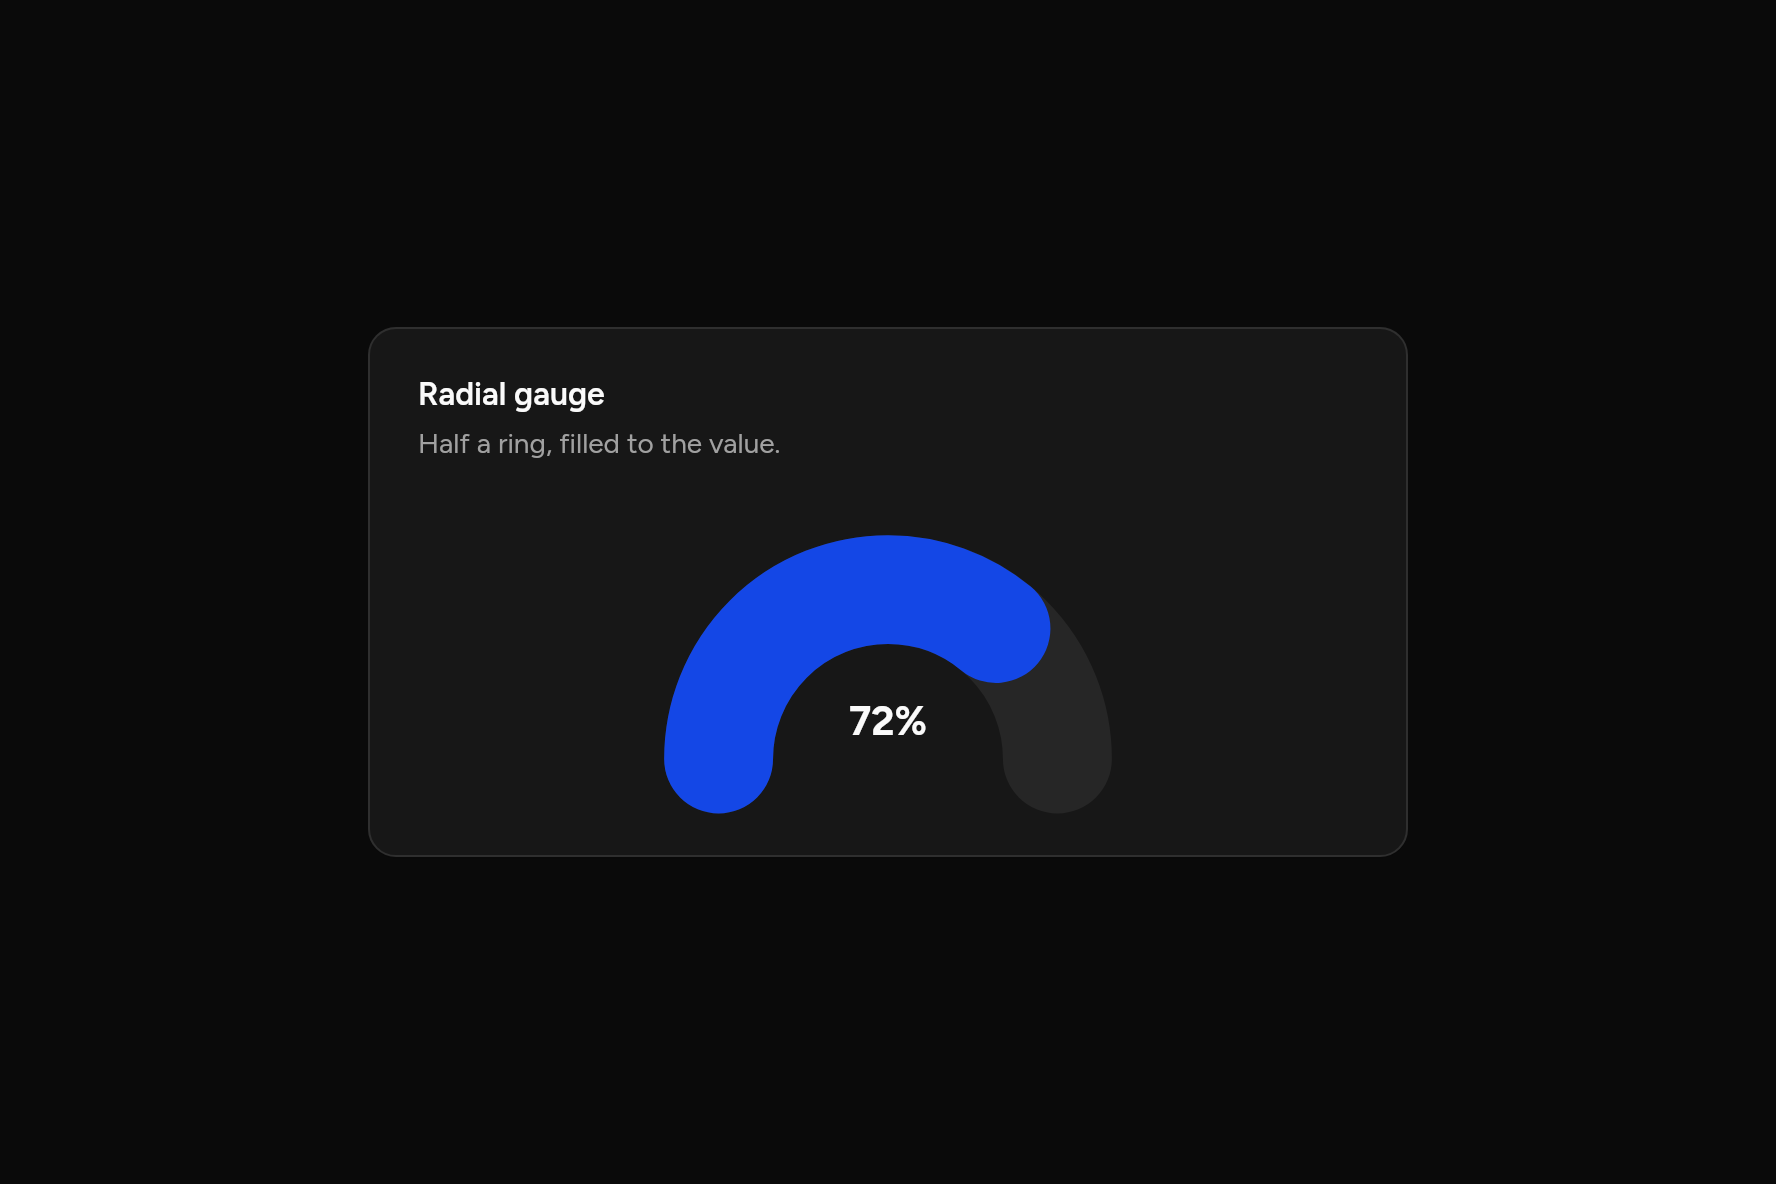
Radial gauge
Half a ring, filled to the value.
Code
// Radial gauge: Half a ring, filled to the value. Sample data.
import 'package:flutter/widgets.dart';

import 'ui/card.dart';
import 'ui/chart.dart';

class RadialGaugeChart extends StatelessWidget {
  const RadialGaugeChart({super.key});

  @override
  Widget build(BuildContext context) => SizedBox(
    width: 520,
    child: Card(
      children: [
        const CardHeader(
          title: Text("Radial gauge"),
          description: Text("Half a ring, filled to the value."),
        ),
        CardContent(
          child: const RadialChart(
            slices: [ChartSlice('Storage', 72)],
            max: 100,
            half: true,
            center: Text('72%'),
          ),
        ),
      ],
    ),
  );
}
Tooltip
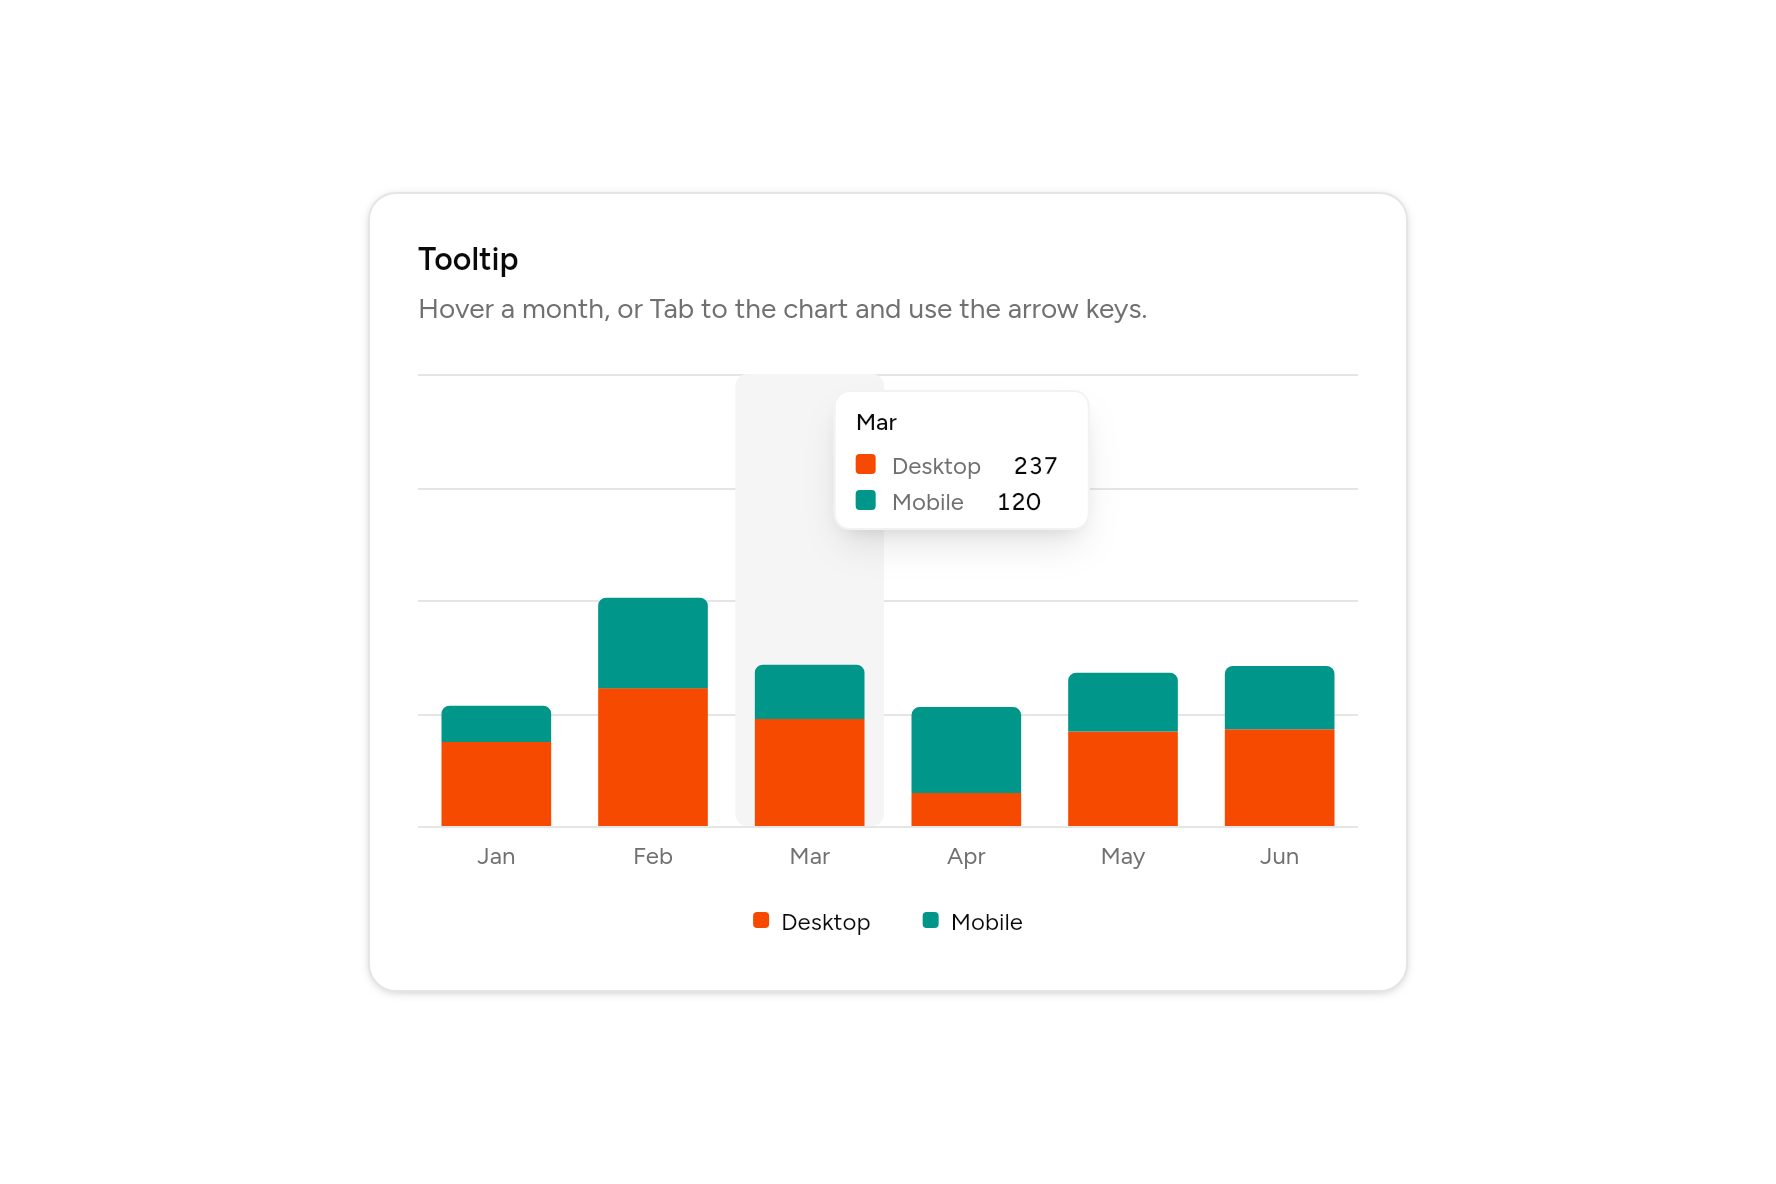
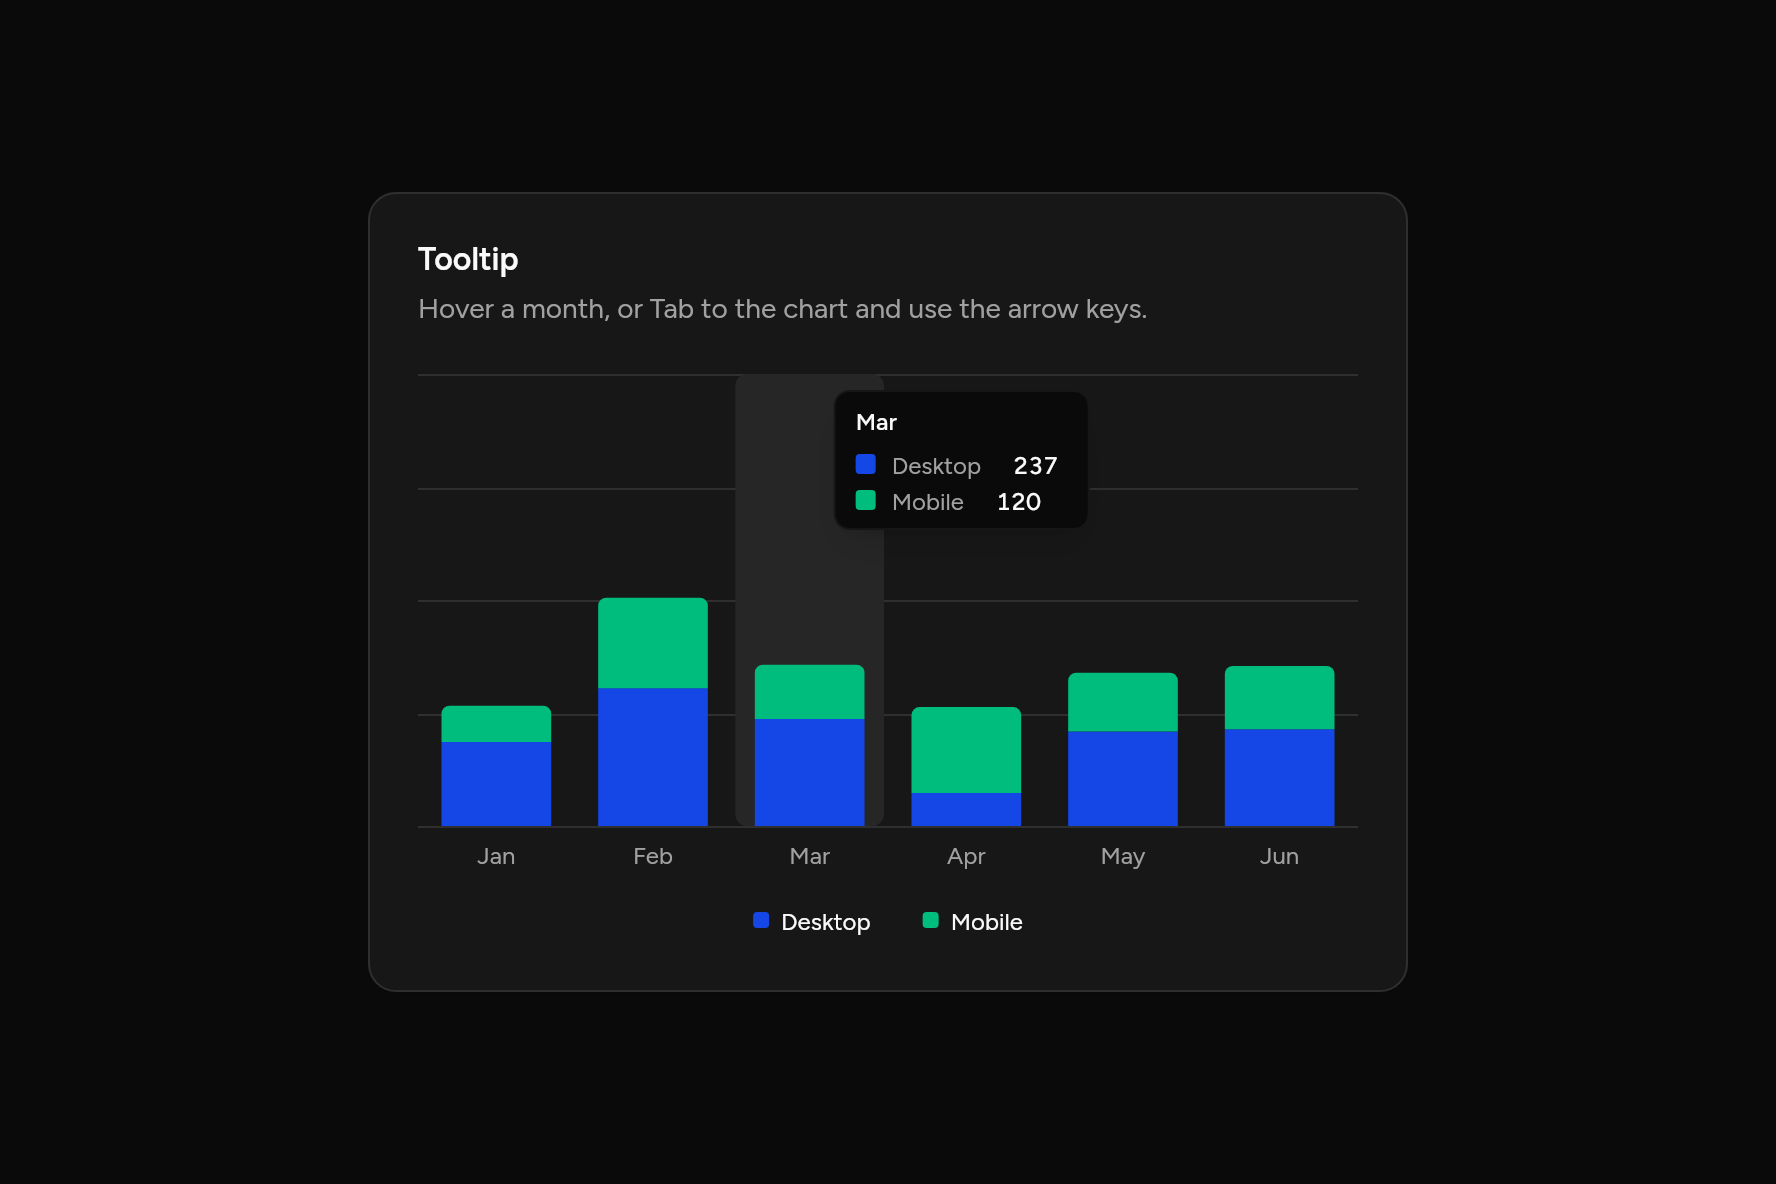
Tooltip
Hover a month, or Tab to the chart and use the arrow keys.
Code
// Tooltip: Hover a month, or Tab to the chart and use the arrow keys. Sample data.
import 'package:flutter/widgets.dart';

import 'ui/card.dart';
import 'ui/chart.dart';

class TooltipDefaultChart extends StatelessWidget {
  const TooltipDefaultChart({super.key});

  @override
  Widget build(BuildContext context) => SizedBox(
    width: 520,
    child: Card(
      children: [
        const CardHeader(
          title: Text("Tooltip"),
          description: Text("Hover a month, or Tab to the chart and use the arrow keys."),
        ),
        CardContent(
          child: BarChart(
            labels: ['Jan', 'Feb', 'Mar', 'Apr', 'May', 'Jun'],
            series: const [
              ChartSeries('Desktop', [186, 305, 237, 73, 209, 214]),
              ChartSeries('Mobile', [80, 200, 120, 190, 130, 140]),
            ],
            stacked: true,
          ),
        ),
      ],
    ),
  );
}
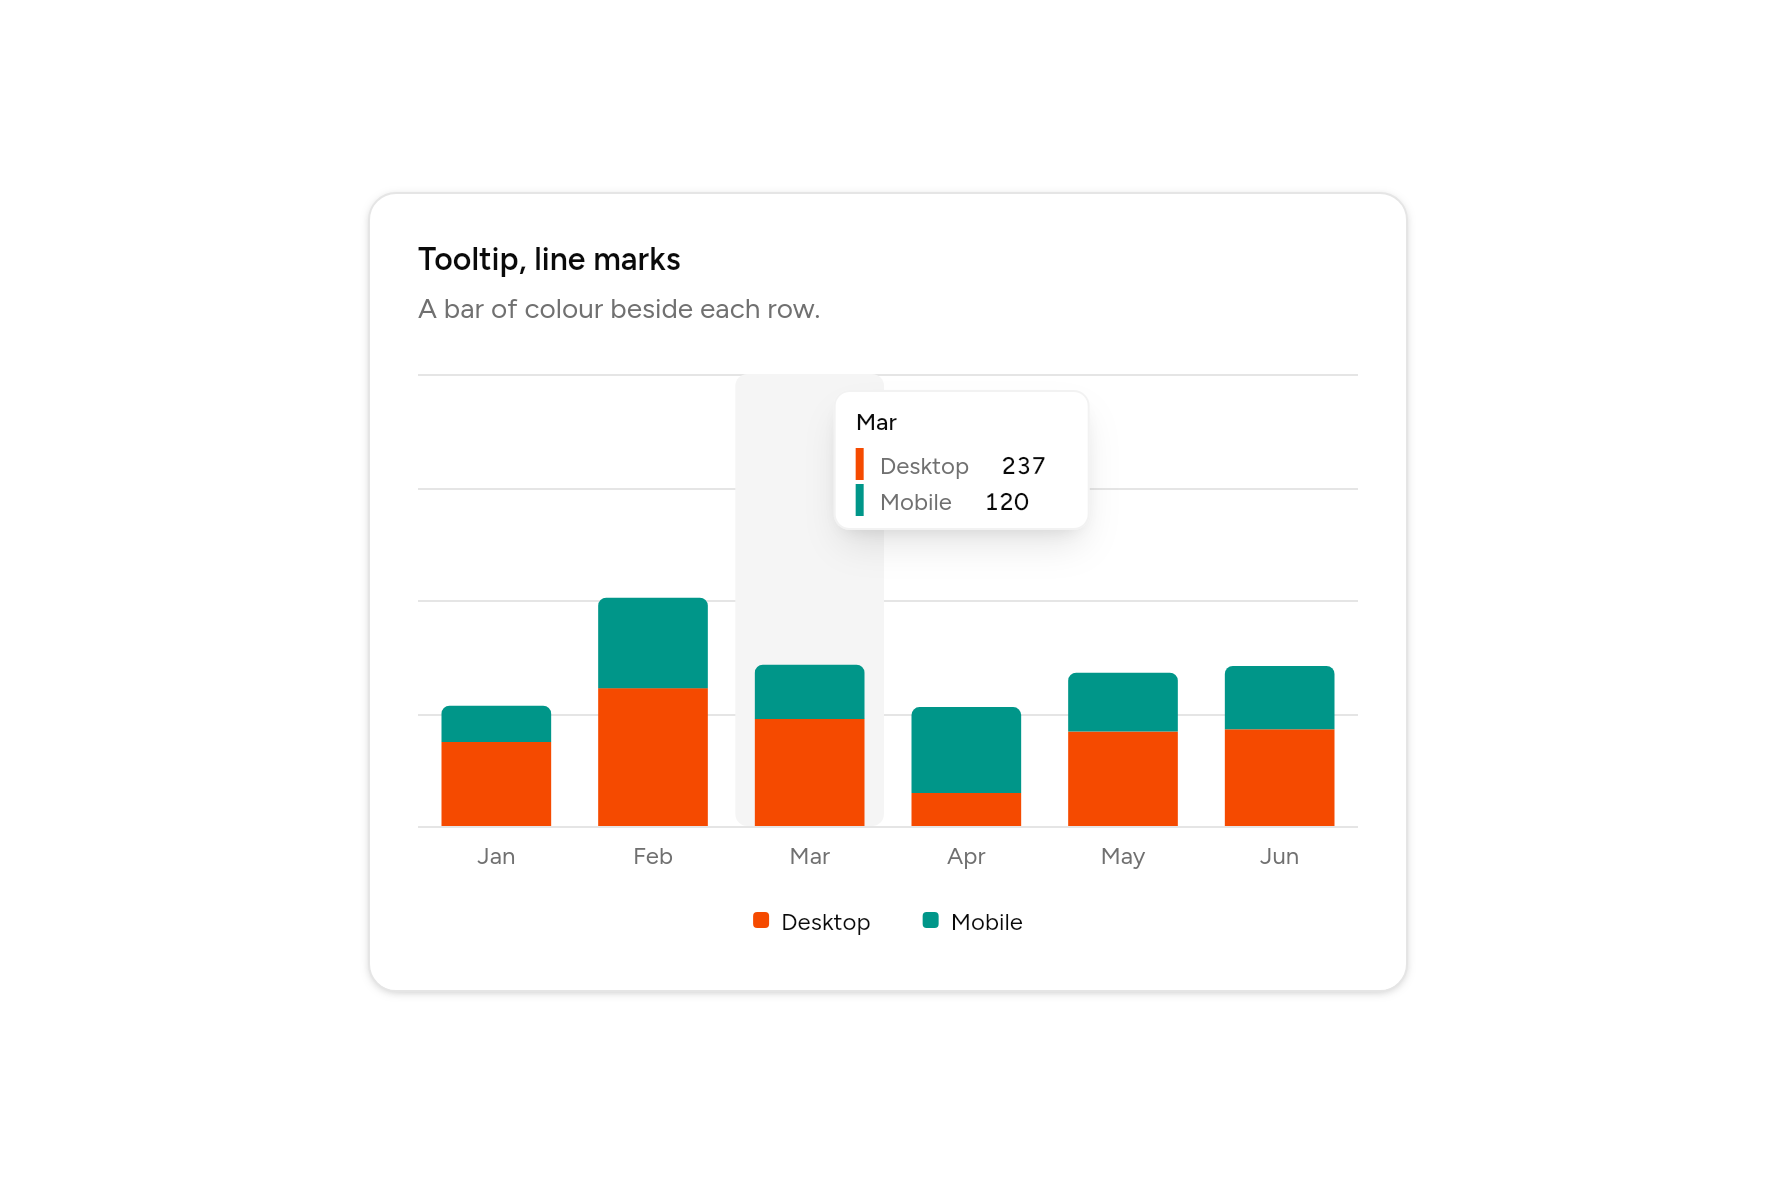
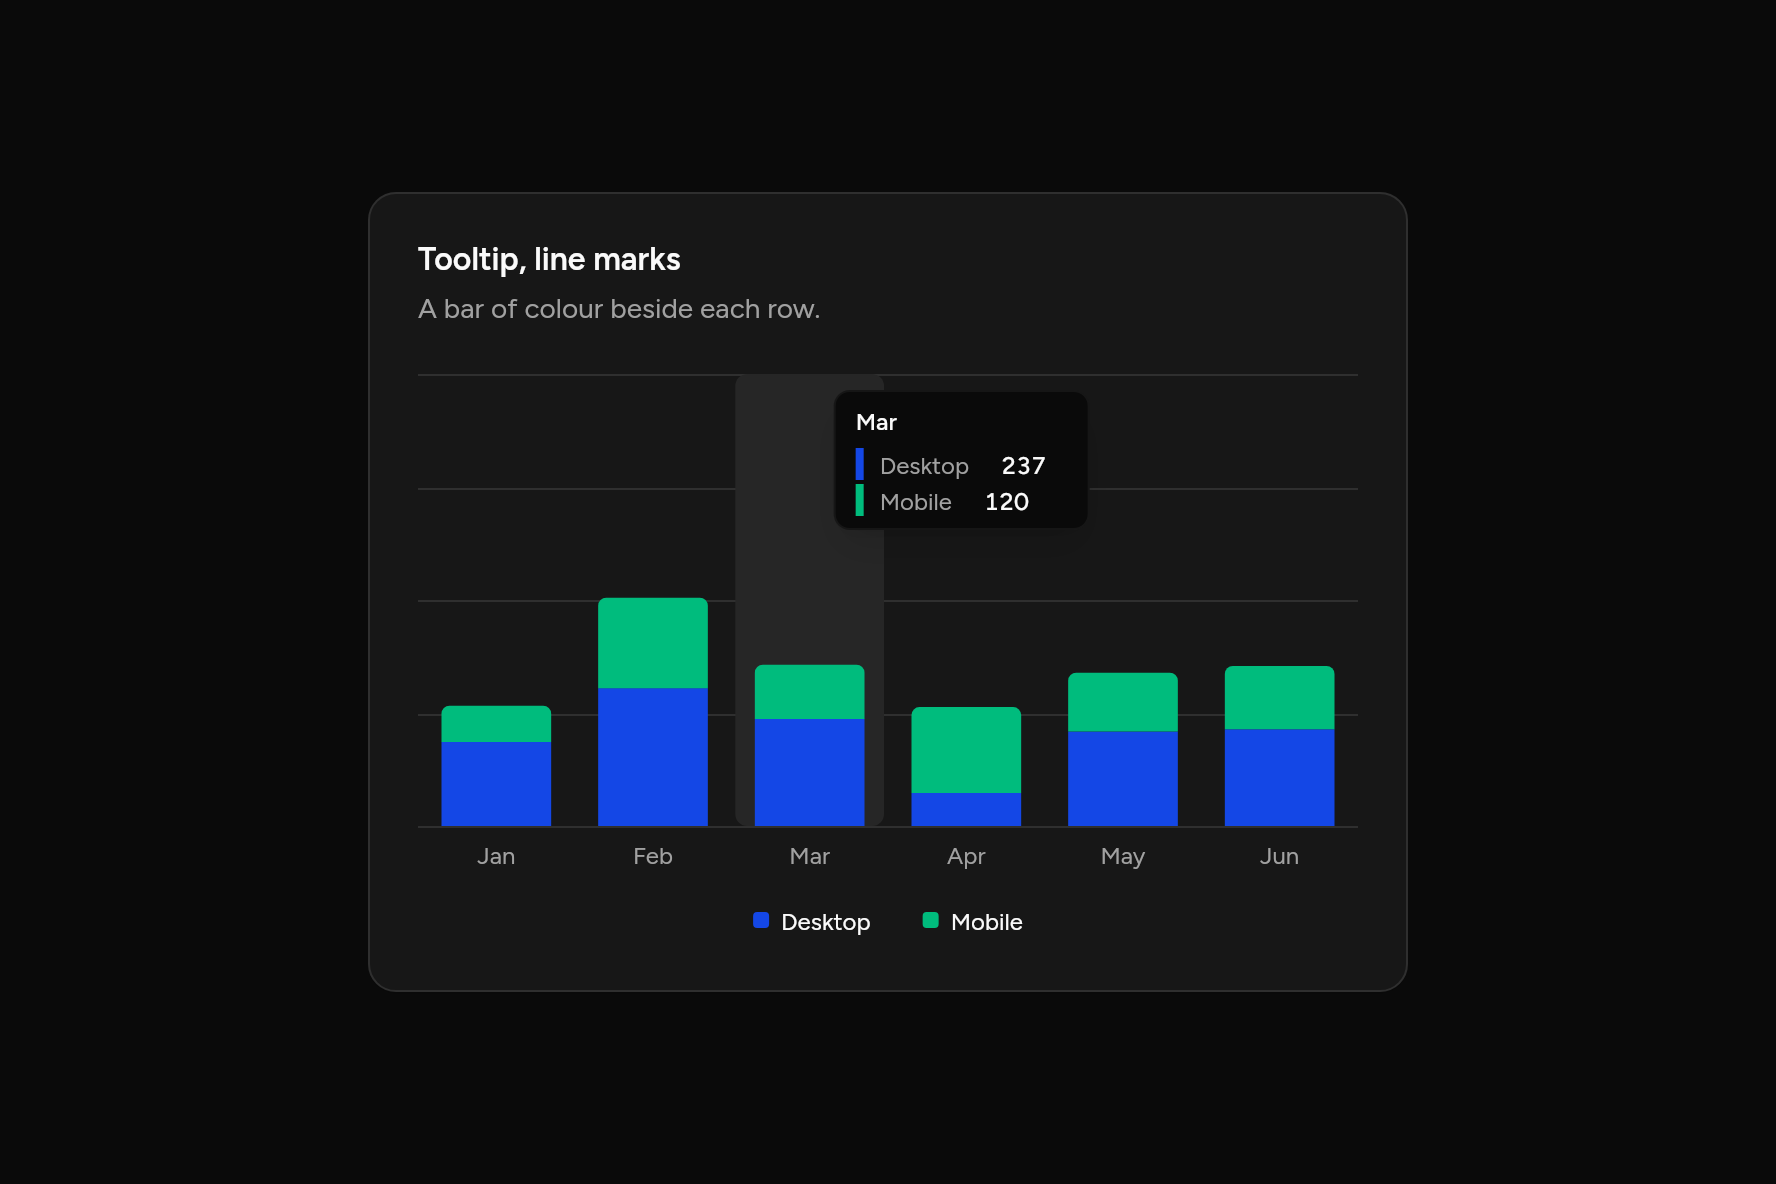
Tooltip, line marks
A bar of colour beside each row.
Code
// Tooltip, line marks: A bar of colour beside each row. Sample data.
import 'package:flutter/widgets.dart';

import 'ui/card.dart';
import 'ui/chart.dart';

class TooltipLineChart extends StatelessWidget {
  const TooltipLineChart({super.key});

  @override
  Widget build(BuildContext context) => SizedBox(
    width: 520,
    child: Card(
      children: [
        const CardHeader(
          title: Text("Tooltip, line marks"),
          description: Text("A bar of colour beside each row."),
        ),
        CardContent(
          child: BarChart(
            labels: ['Jan', 'Feb', 'Mar', 'Apr', 'May', 'Jun'],
            series: const [
              ChartSeries('Desktop', [186, 305, 237, 73, 209, 214]),
              ChartSeries('Mobile', [80, 200, 120, 190, 130, 140]),
            ],
            stacked: true,
            tooltip: const ChartTooltip(indicator: ChartIndicator.line),
          ),
        ),
      ],
    ),
  );
}
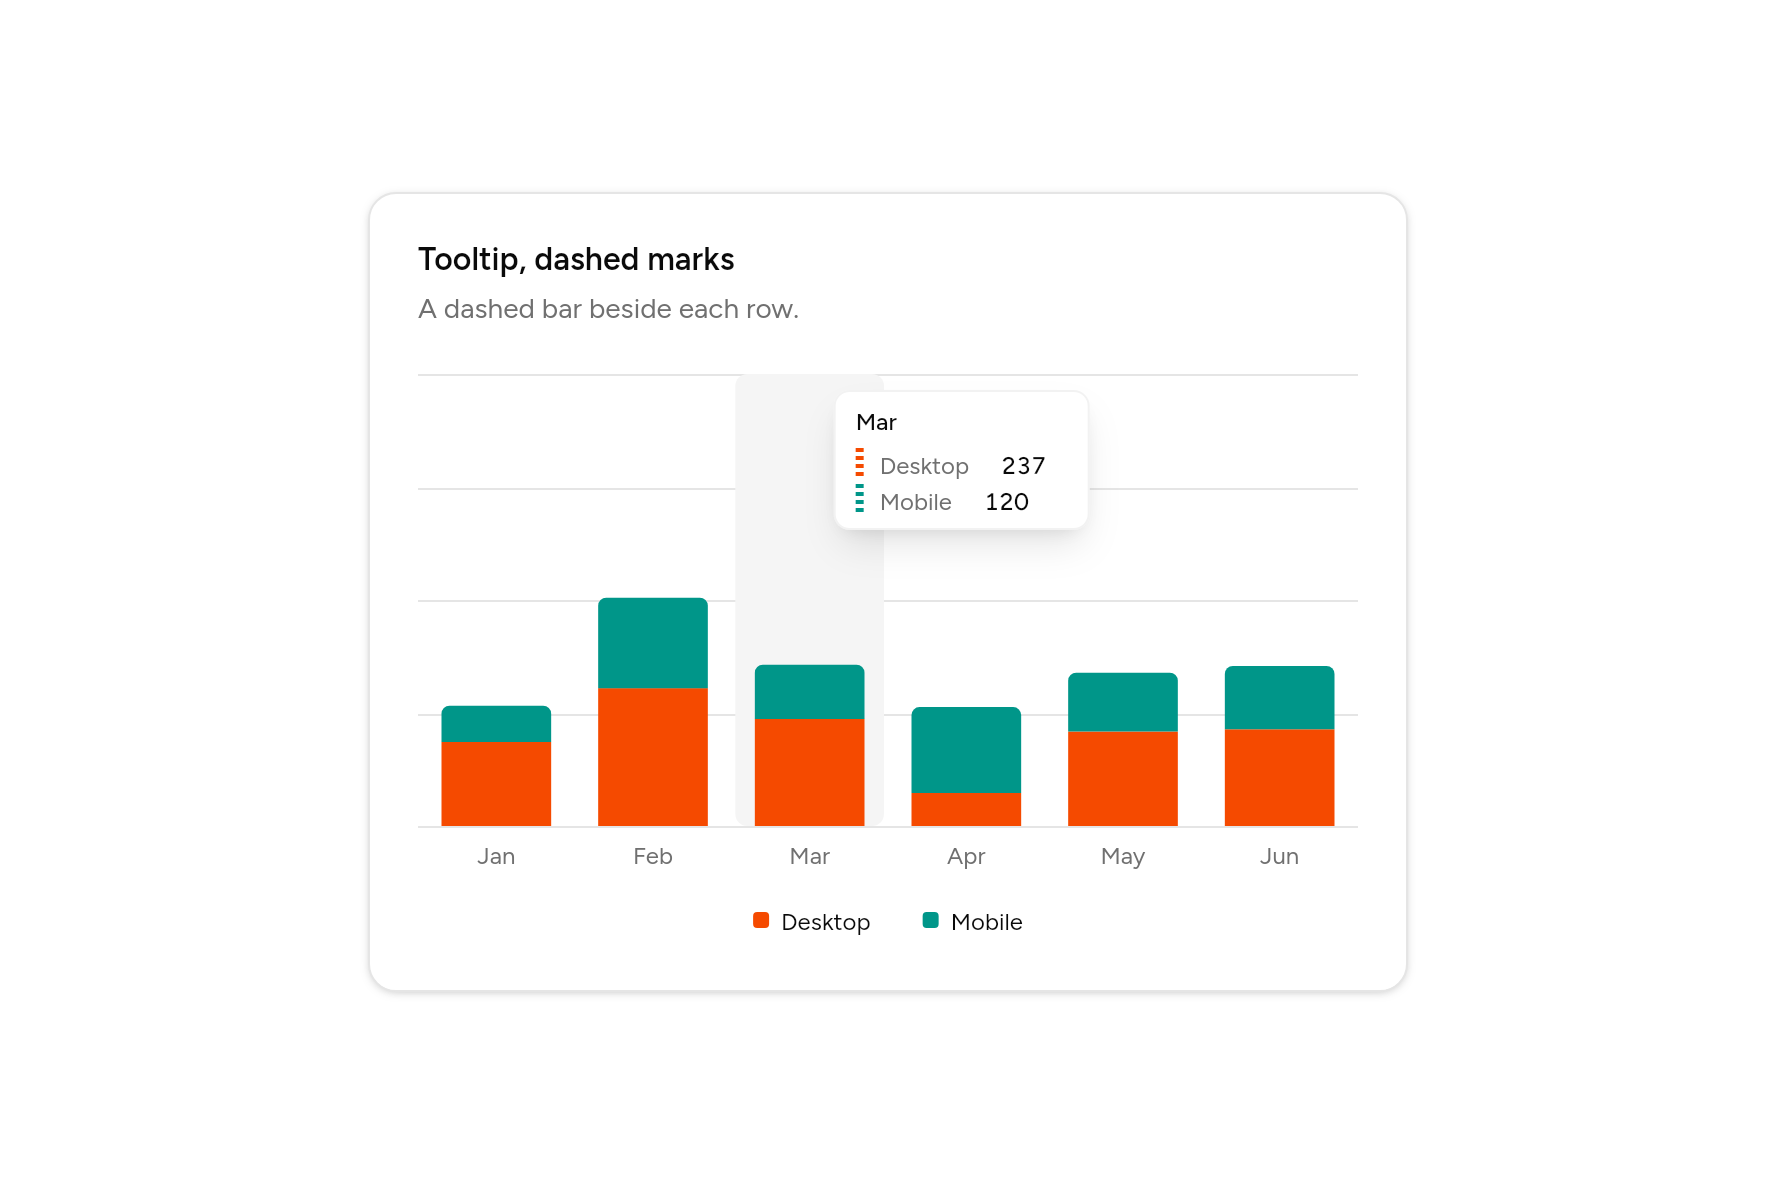
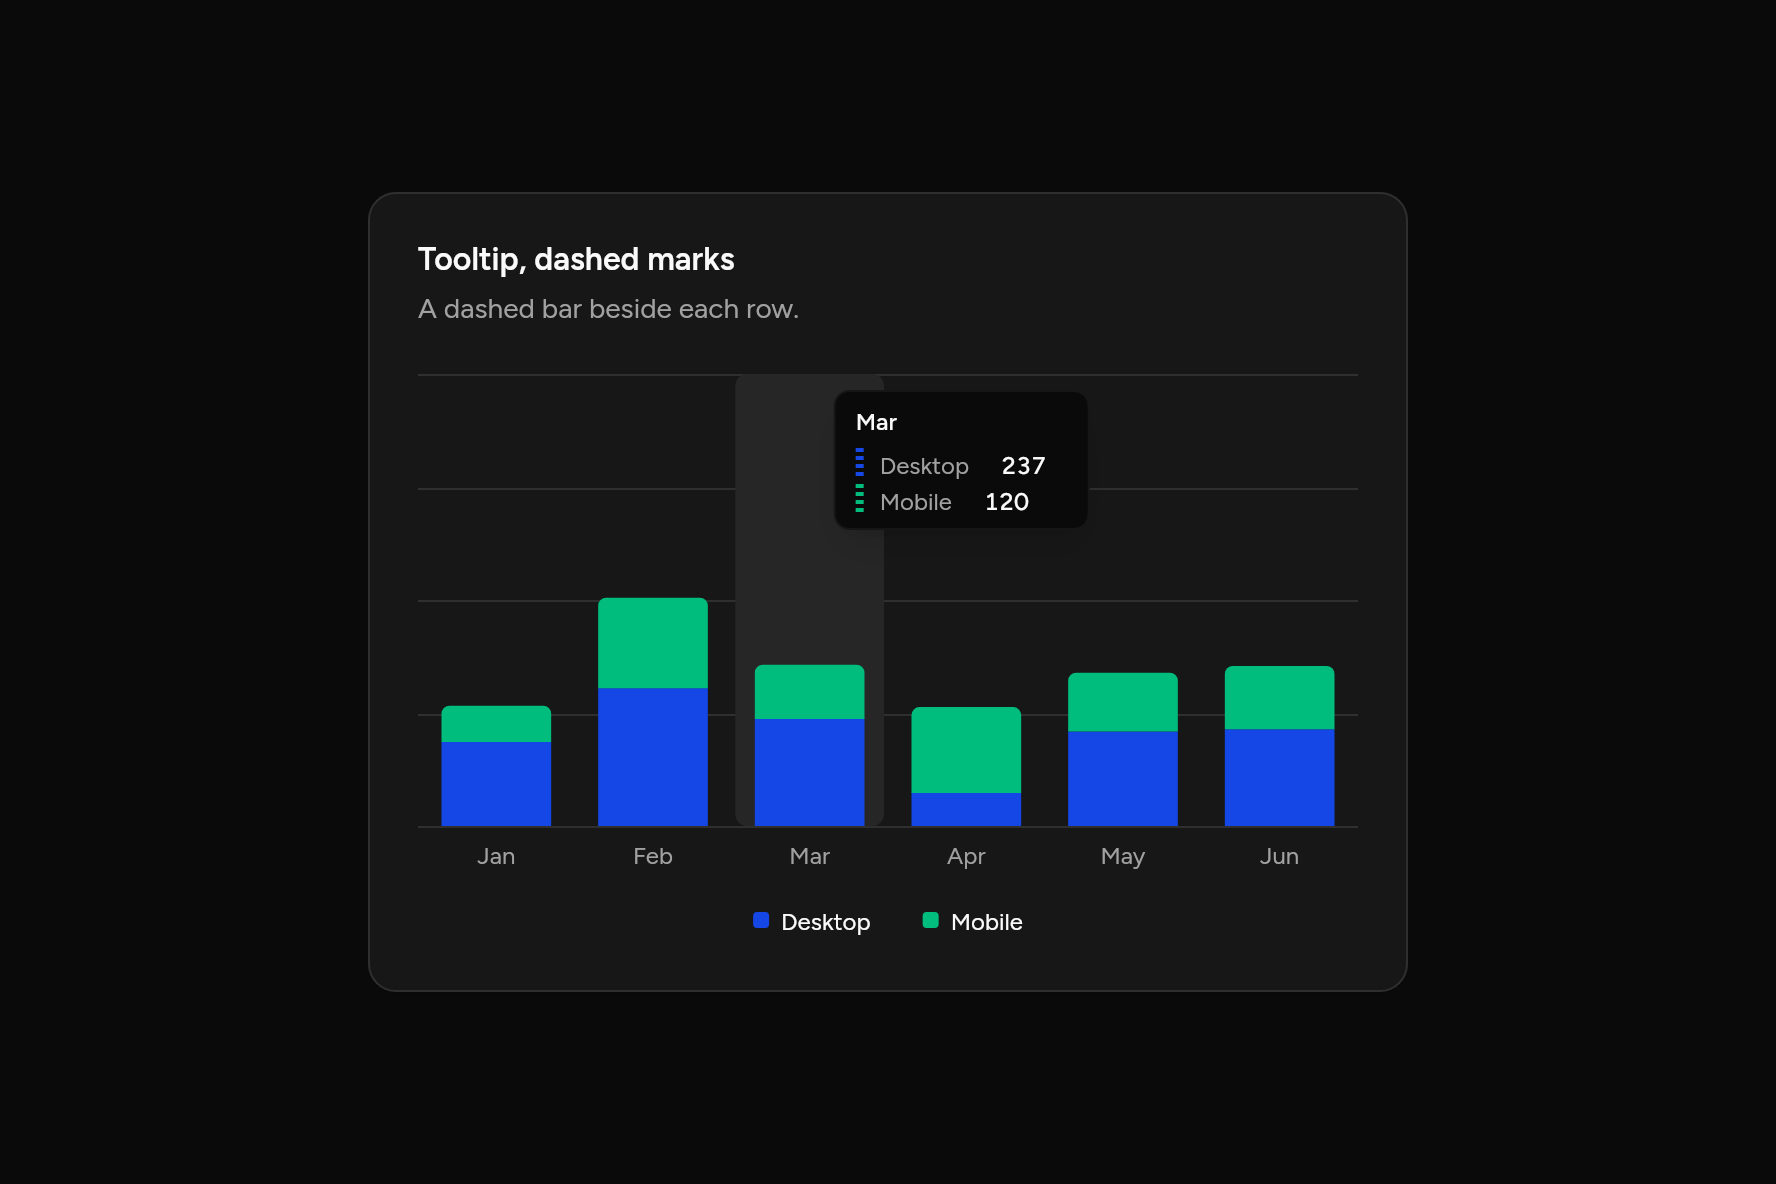
Tooltip, dashed marks
A dashed bar beside each row.
Code
// Tooltip, dashed marks: A dashed bar beside each row. Sample data.
import 'package:flutter/widgets.dart';

import 'ui/card.dart';
import 'ui/chart.dart';

class TooltipDashedChart extends StatelessWidget {
  const TooltipDashedChart({super.key});

  @override
  Widget build(BuildContext context) => SizedBox(
    width: 520,
    child: Card(
      children: [
        const CardHeader(
          title: Text("Tooltip, dashed marks"),
          description: Text("A dashed bar beside each row."),
        ),
        CardContent(
          child: BarChart(
            labels: ['Jan', 'Feb', 'Mar', 'Apr', 'May', 'Jun'],
            series: const [
              ChartSeries('Desktop', [186, 305, 237, 73, 209, 214]),
              ChartSeries('Mobile', [80, 200, 120, 190, 130, 140]),
            ],
            stacked: true,
            tooltip: const ChartTooltip(indicator: ChartIndicator.dashed),
          ),
        ),
      ],
    ),
  );
}
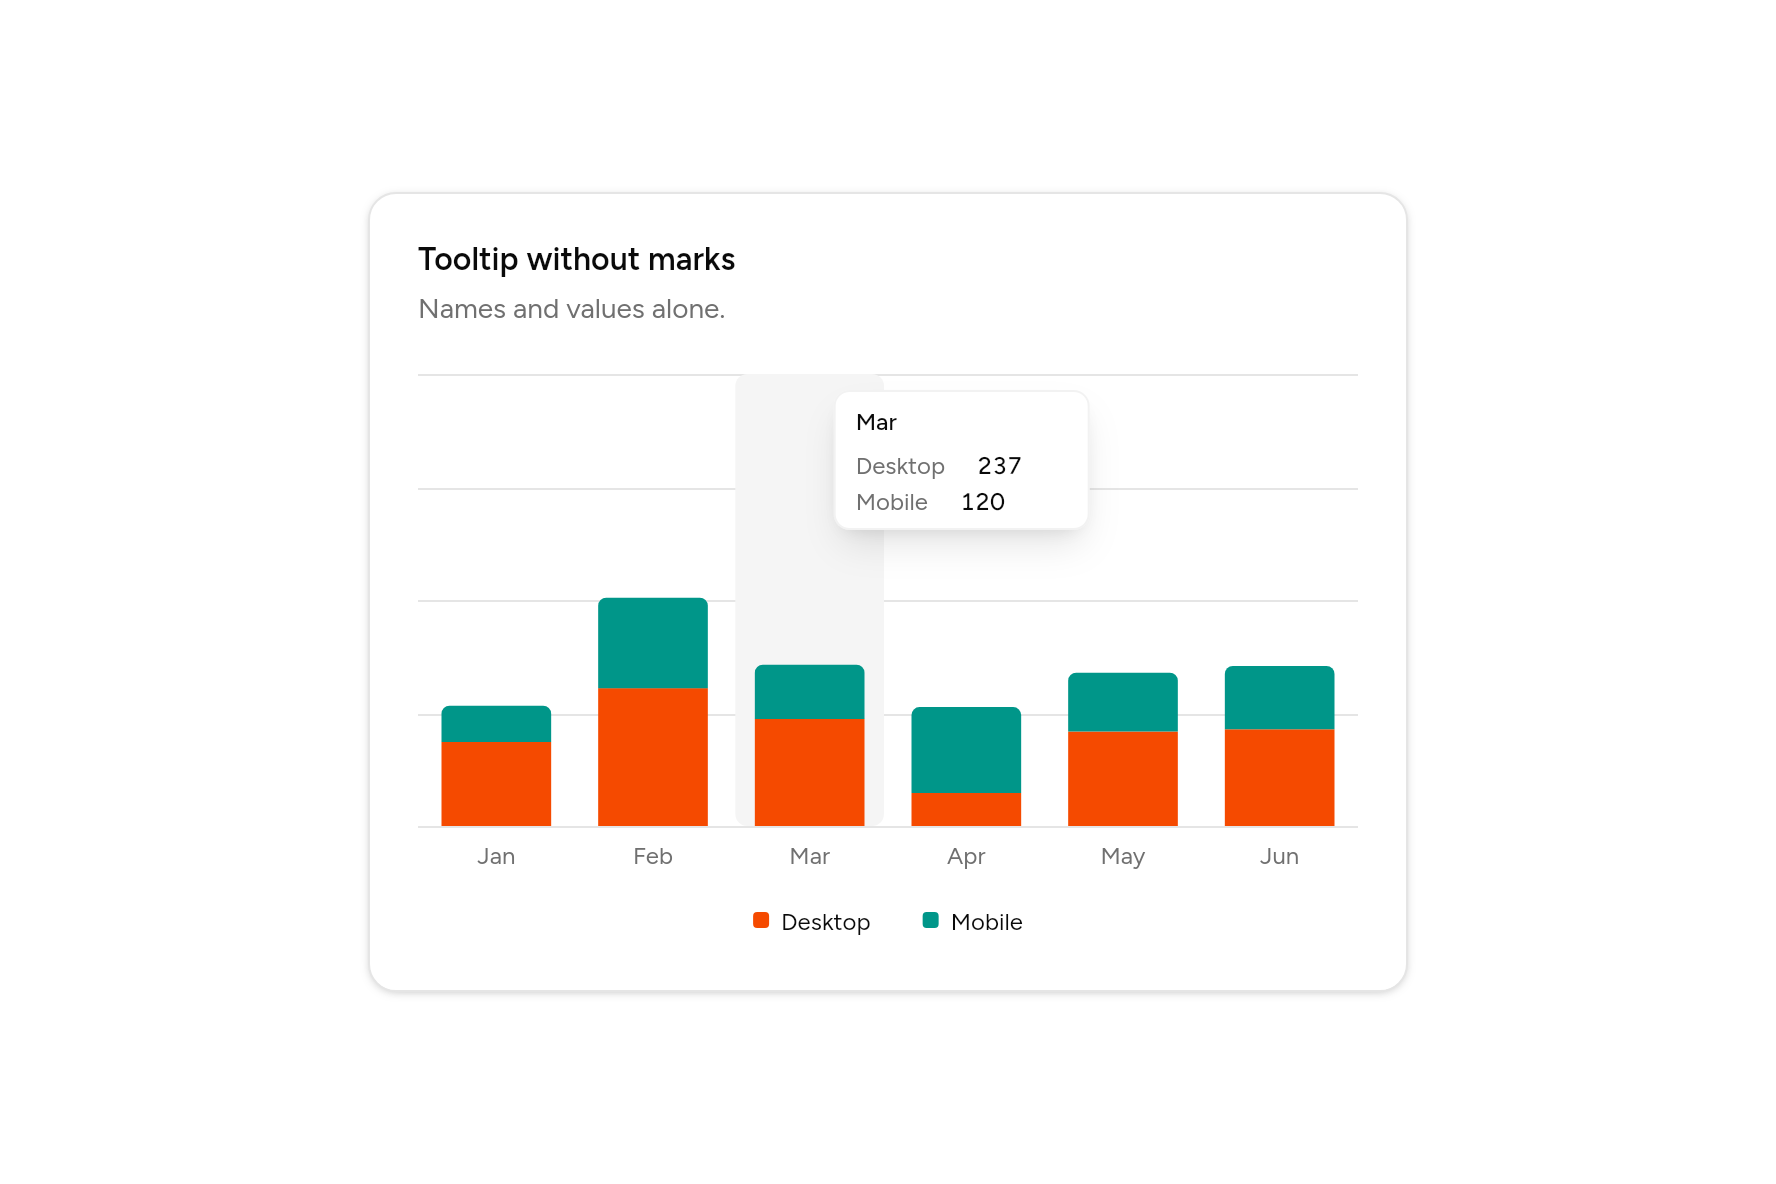
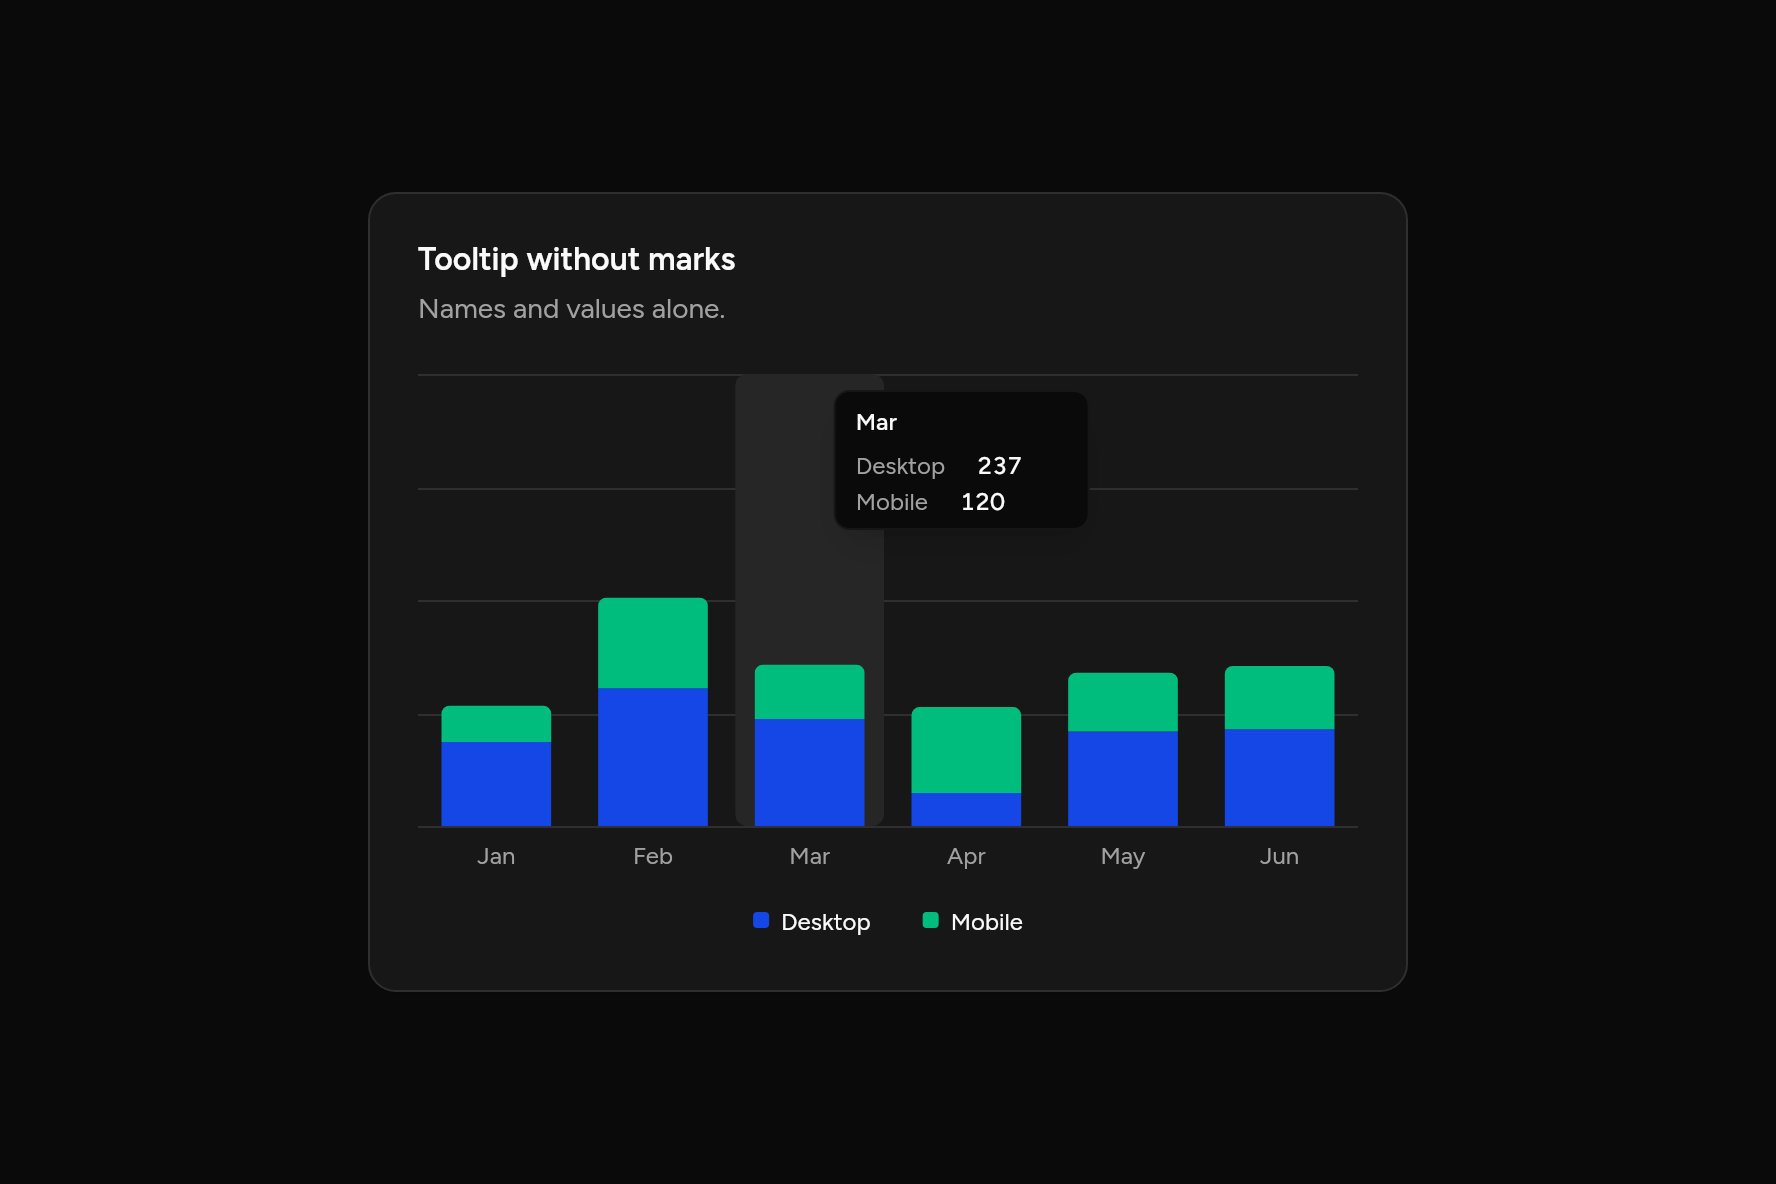
Tooltip without marks
Names and values alone.
Code
// Tooltip without marks: Names and values alone. Sample data.
import 'package:flutter/widgets.dart';

import 'ui/card.dart';
import 'ui/chart.dart';

class TooltipNoneChart extends StatelessWidget {
  const TooltipNoneChart({super.key});

  @override
  Widget build(BuildContext context) => SizedBox(
    width: 520,
    child: Card(
      children: [
        const CardHeader(
          title: Text("Tooltip without marks"),
          description: Text("Names and values alone."),
        ),
        CardContent(
          child: BarChart(
            labels: ['Jan', 'Feb', 'Mar', 'Apr', 'May', 'Jun'],
            series: const [
              ChartSeries('Desktop', [186, 305, 237, 73, 209, 214]),
              ChartSeries('Mobile', [80, 200, 120, 190, 130, 140]),
            ],
            stacked: true,
            tooltip: const ChartTooltip(indicator: ChartIndicator.none),
          ),
        ),
      ],
    ),
  );
}
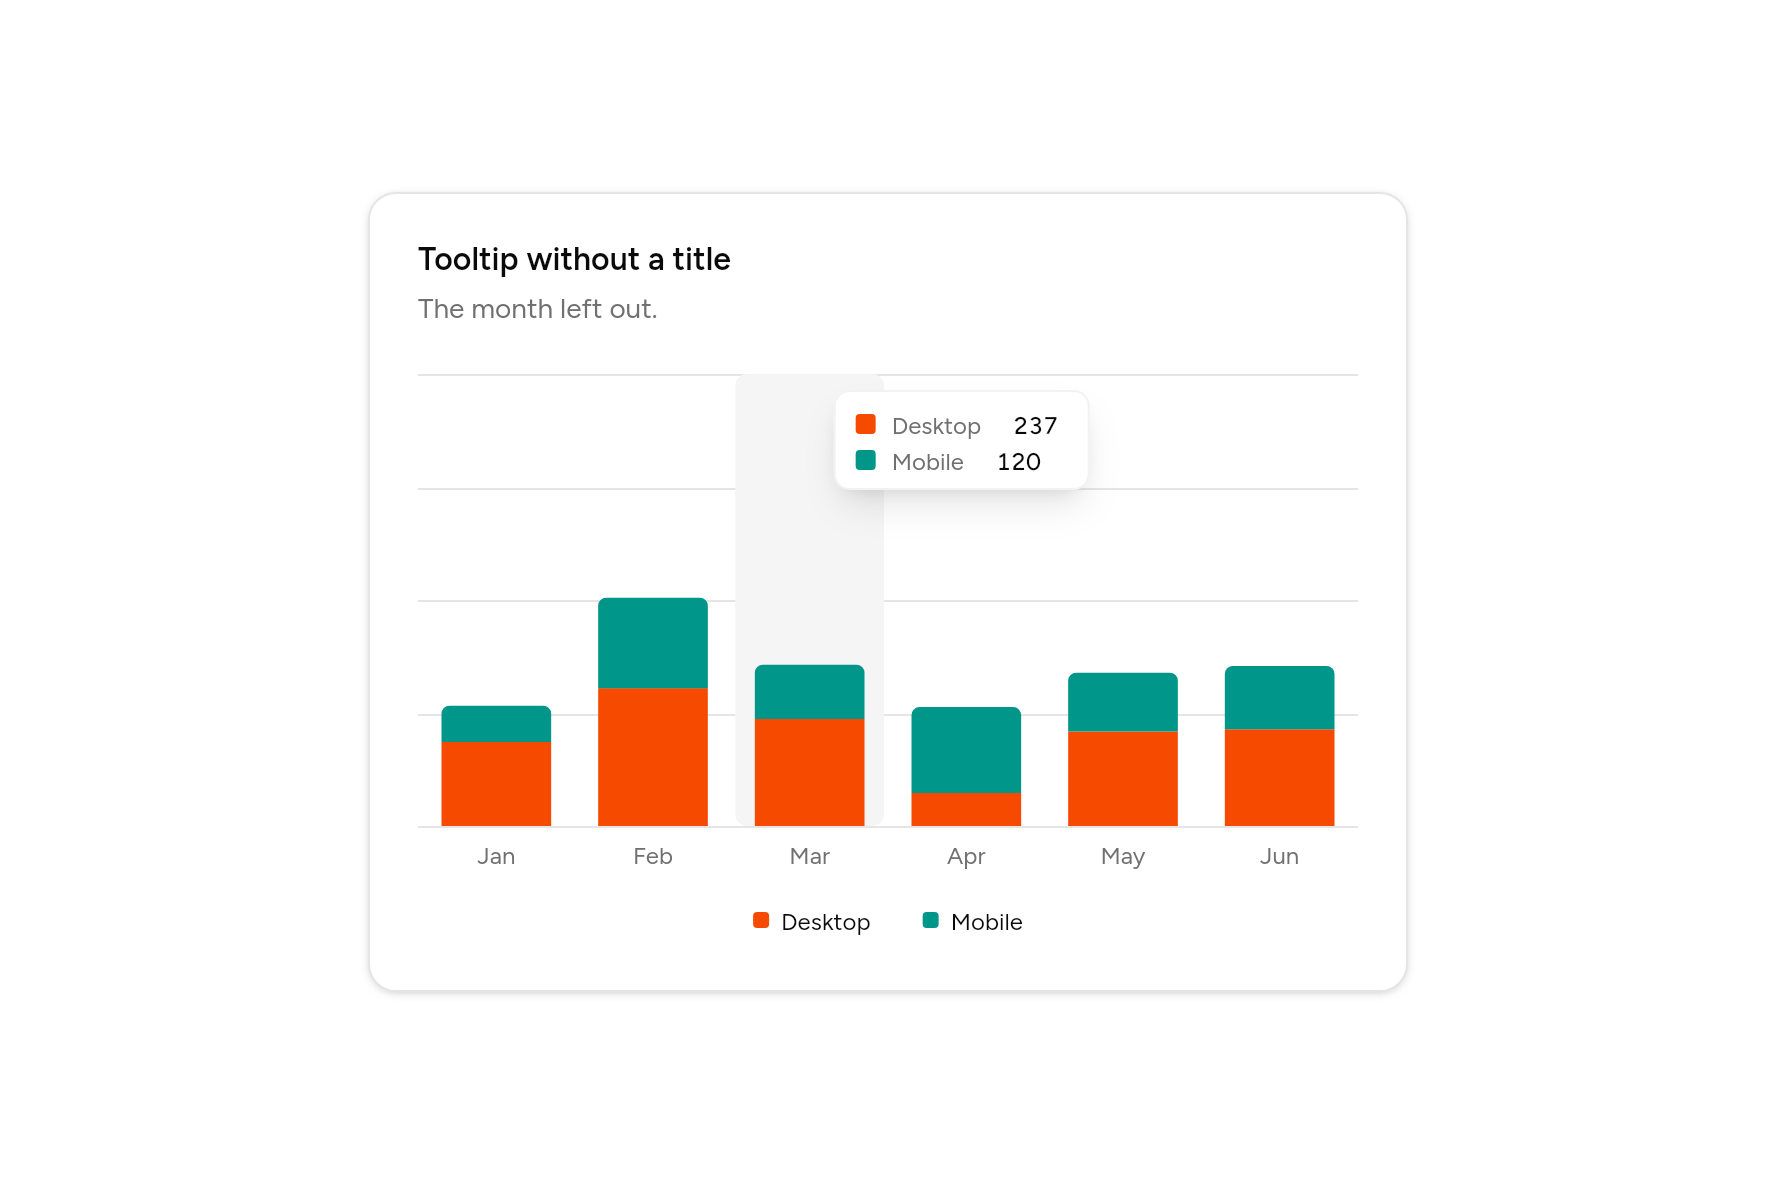
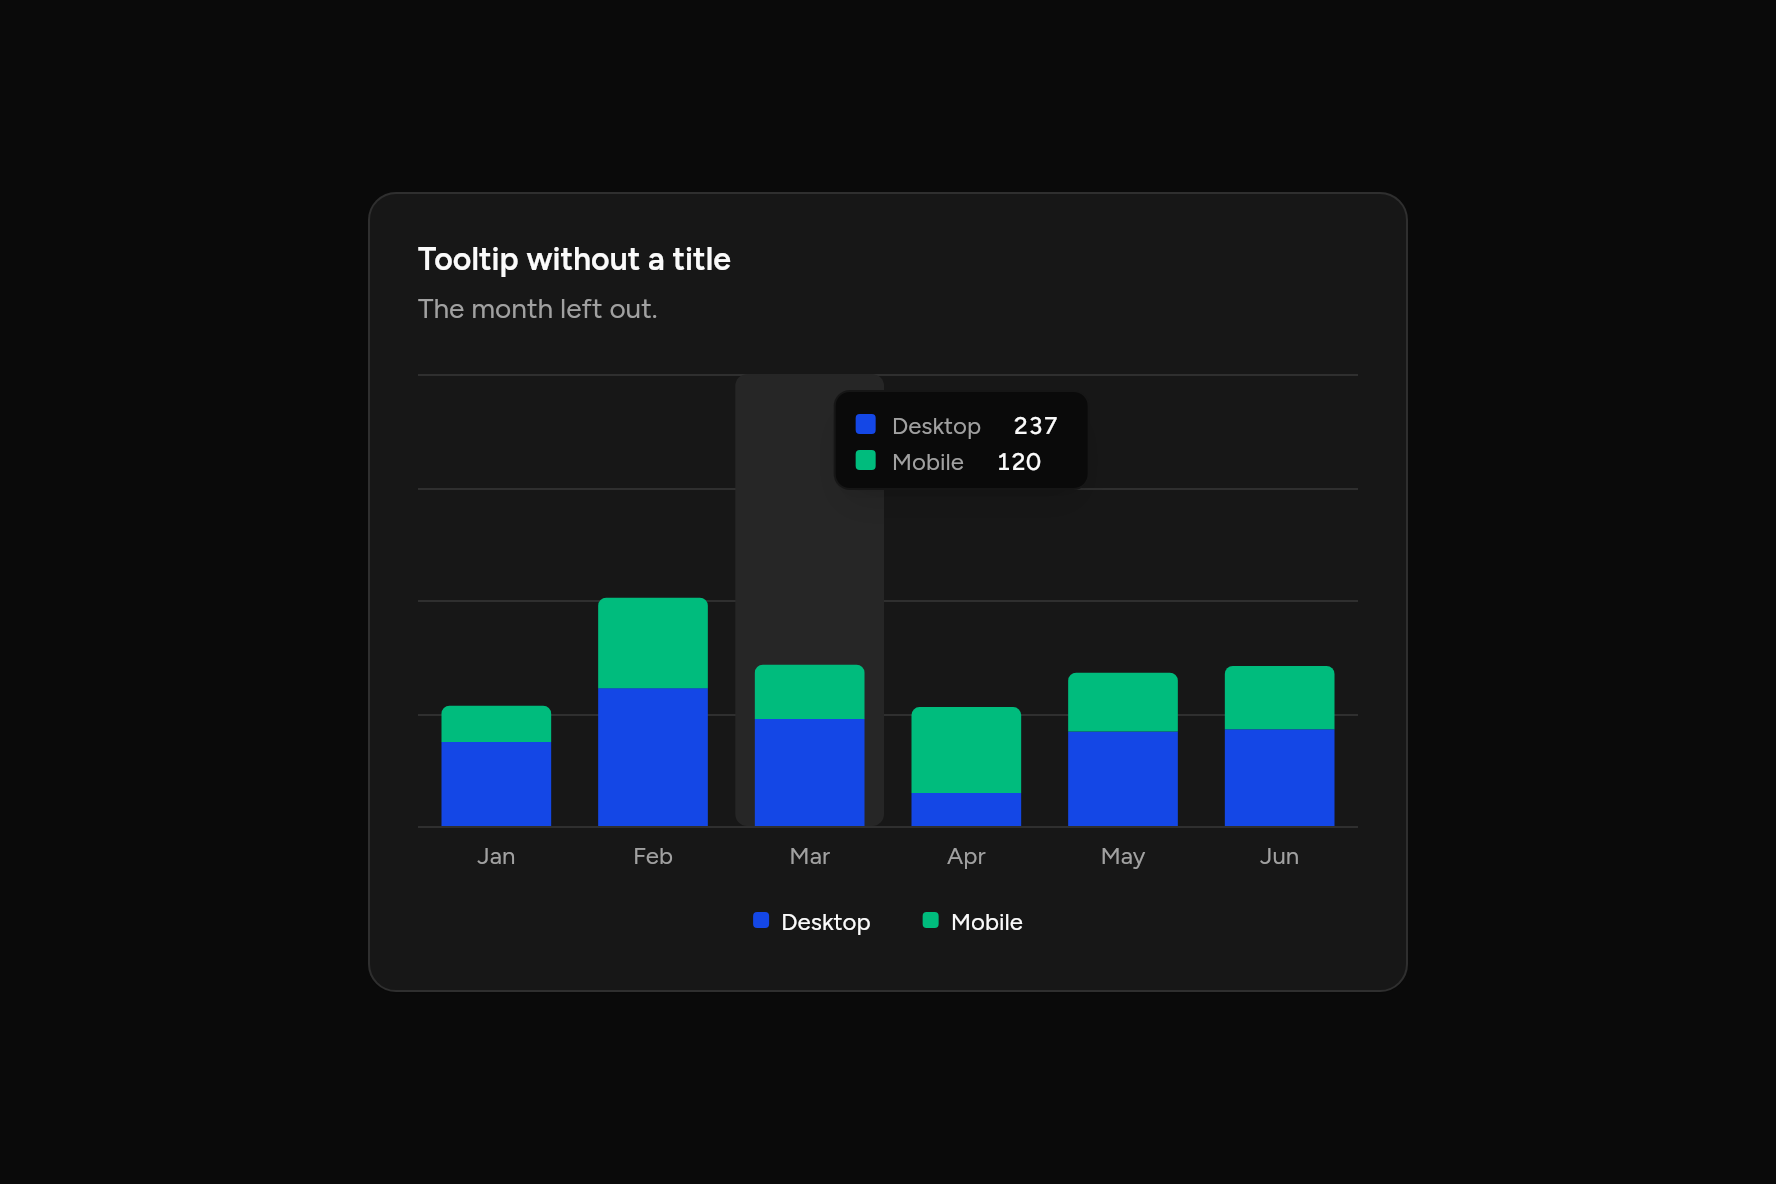
Tooltip without a title
The month left out.
Code
// Tooltip without a title: The month left out. Sample data.
import 'package:flutter/widgets.dart';

import 'ui/card.dart';
import 'ui/chart.dart';

class TooltipLabelNoneChart extends StatelessWidget {
  const TooltipLabelNoneChart({super.key});

  @override
  Widget build(BuildContext context) => SizedBox(
    width: 520,
    child: Card(
      children: [
        const CardHeader(
          title: Text("Tooltip without a title"),
          description: Text("The month left out."),
        ),
        CardContent(
          child: BarChart(
            labels: ['Jan', 'Feb', 'Mar', 'Apr', 'May', 'Jun'],
            series: const [
              ChartSeries('Desktop', [186, 305, 237, 73, 209, 214]),
              ChartSeries('Mobile', [80, 200, 120, 190, 130, 140]),
            ],
            stacked: true,
            tooltip: const ChartTooltip(showTitle: false),
          ),
        ),
      ],
    ),
  );
}
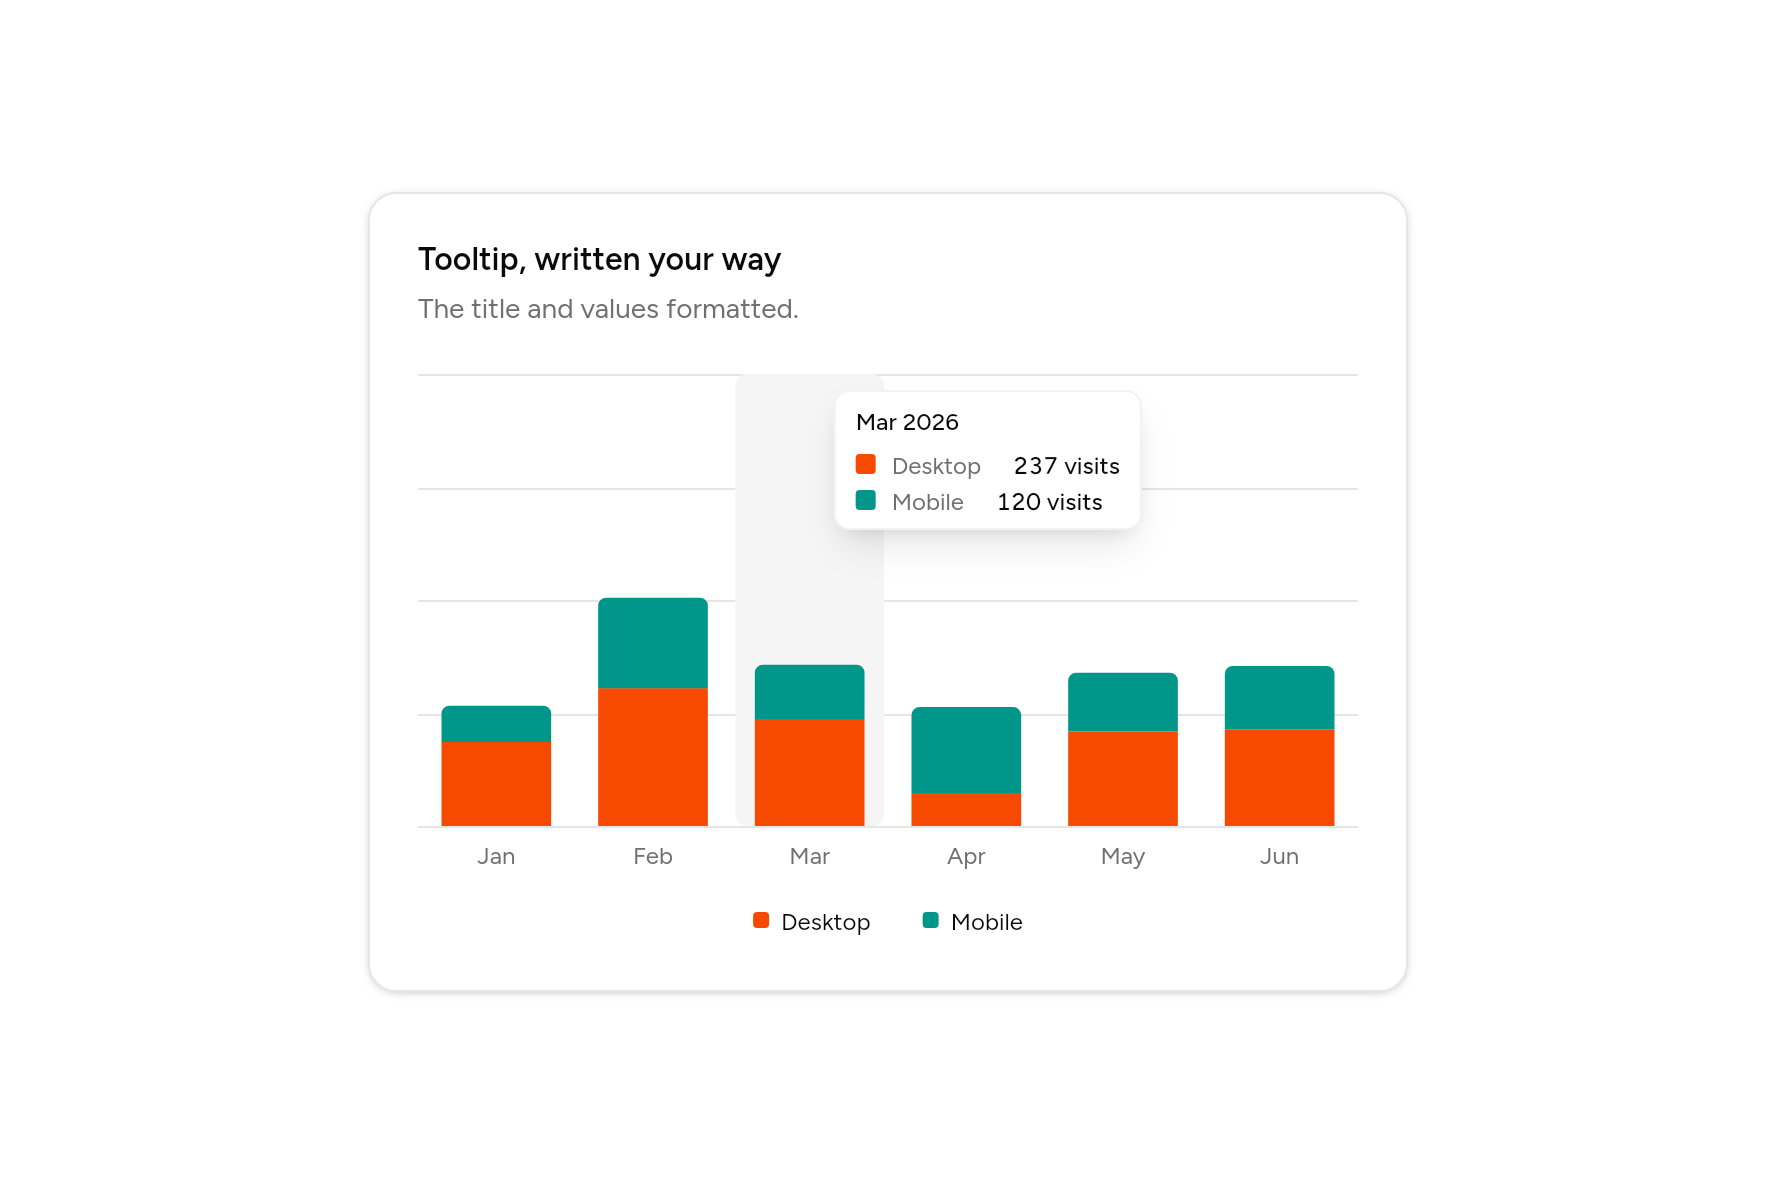
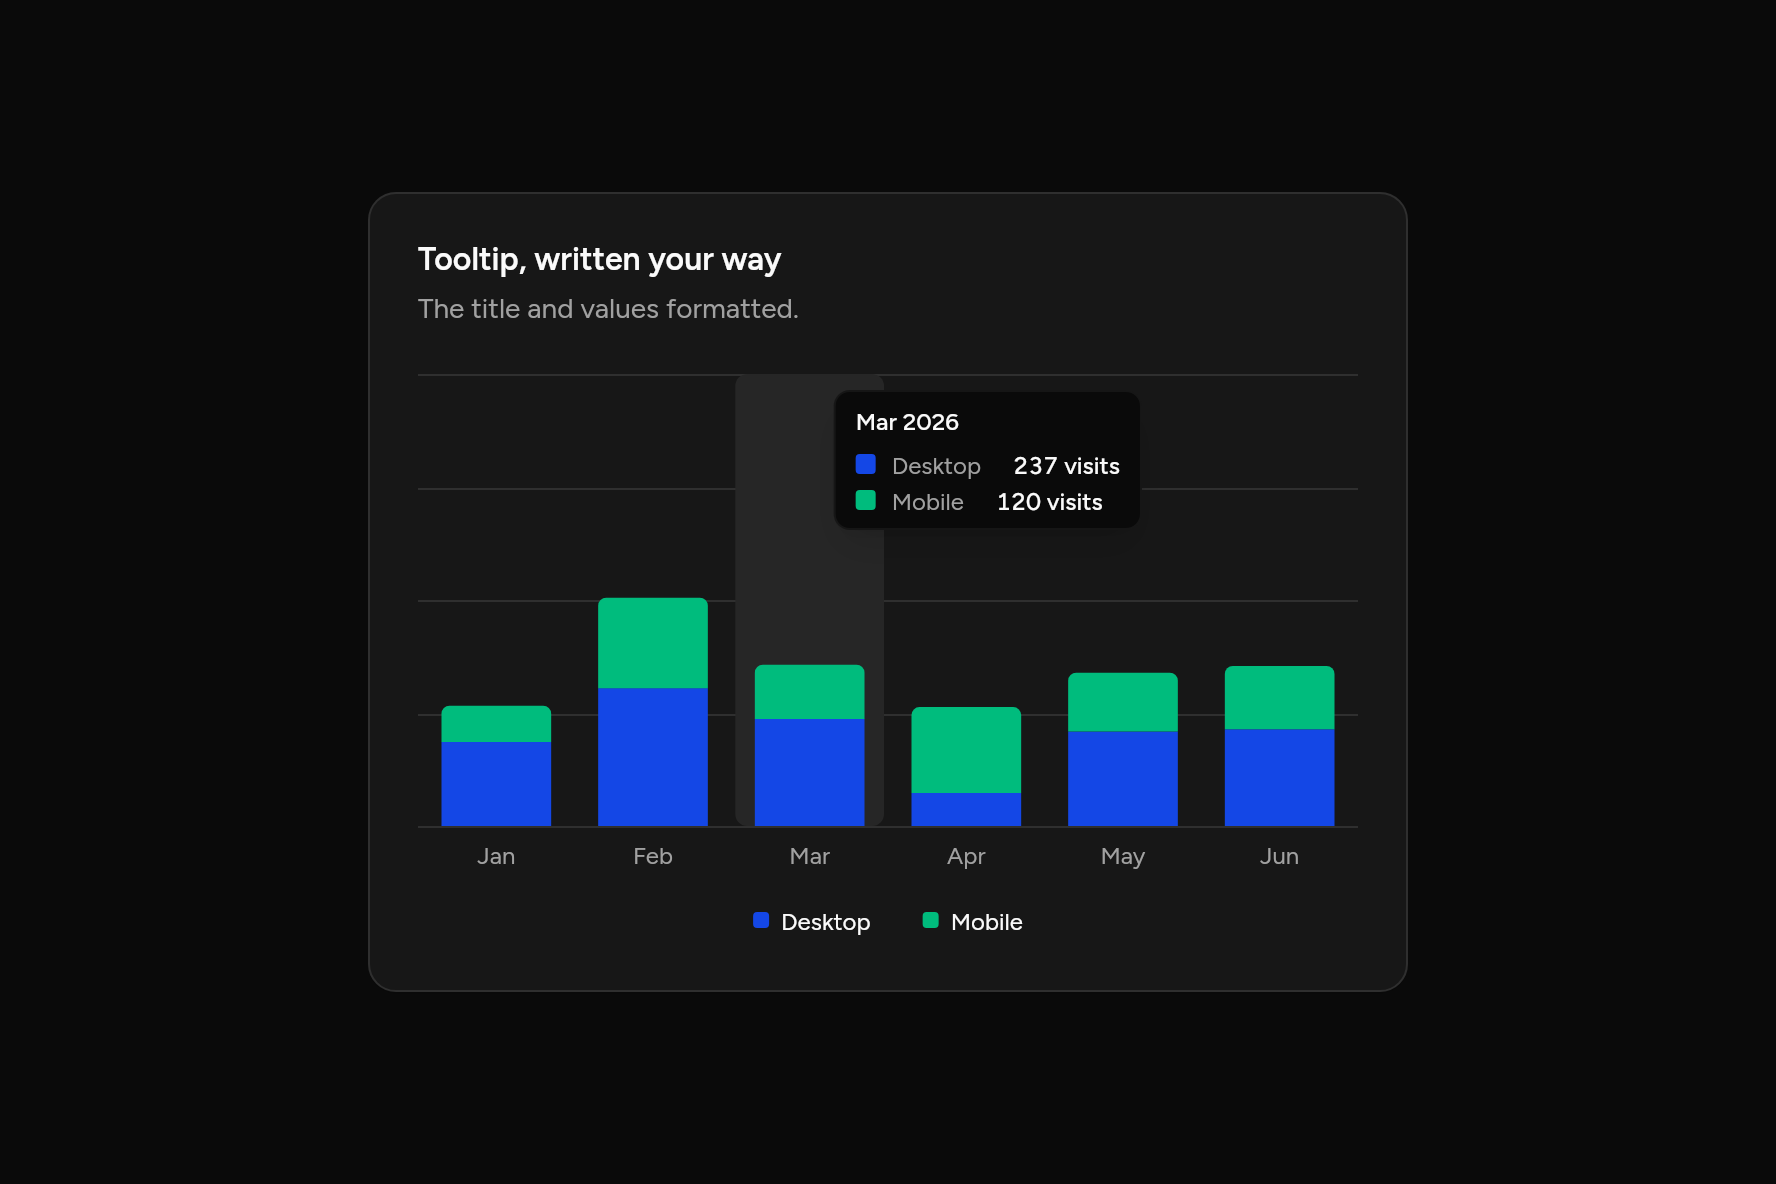
Tooltip, written your way
The title and values formatted.
Code
// Tooltip, written your way: The title and values formatted. Sample data.
import 'package:flutter/widgets.dart';

import 'ui/card.dart';
import 'ui/chart.dart';

class TooltipFormatterChart extends StatelessWidget {
  const TooltipFormatterChart({super.key});

  @override
  Widget build(BuildContext context) => SizedBox(
    width: 520,
    child: Card(
      children: [
        const CardHeader(
          title: Text("Tooltip, written your way"),
          description: Text("The title and values formatted."),
        ),
        CardContent(
          child: BarChart(
            labels: ['Jan', 'Feb', 'Mar', 'Apr', 'May', 'Jun'],
            series: const [
              ChartSeries('Desktop', [186, 305, 237, 73, 209, 214]),
              ChartSeries('Mobile', [80, 200, 120, 190, 130, 140]),
            ],
            stacked: true,
            format: (v) => '${v.round()} visits',
            tooltip: ChartTooltip(title: (m) => '$m 2026'),
          ),
        ),
      ],
    ),
  );
}
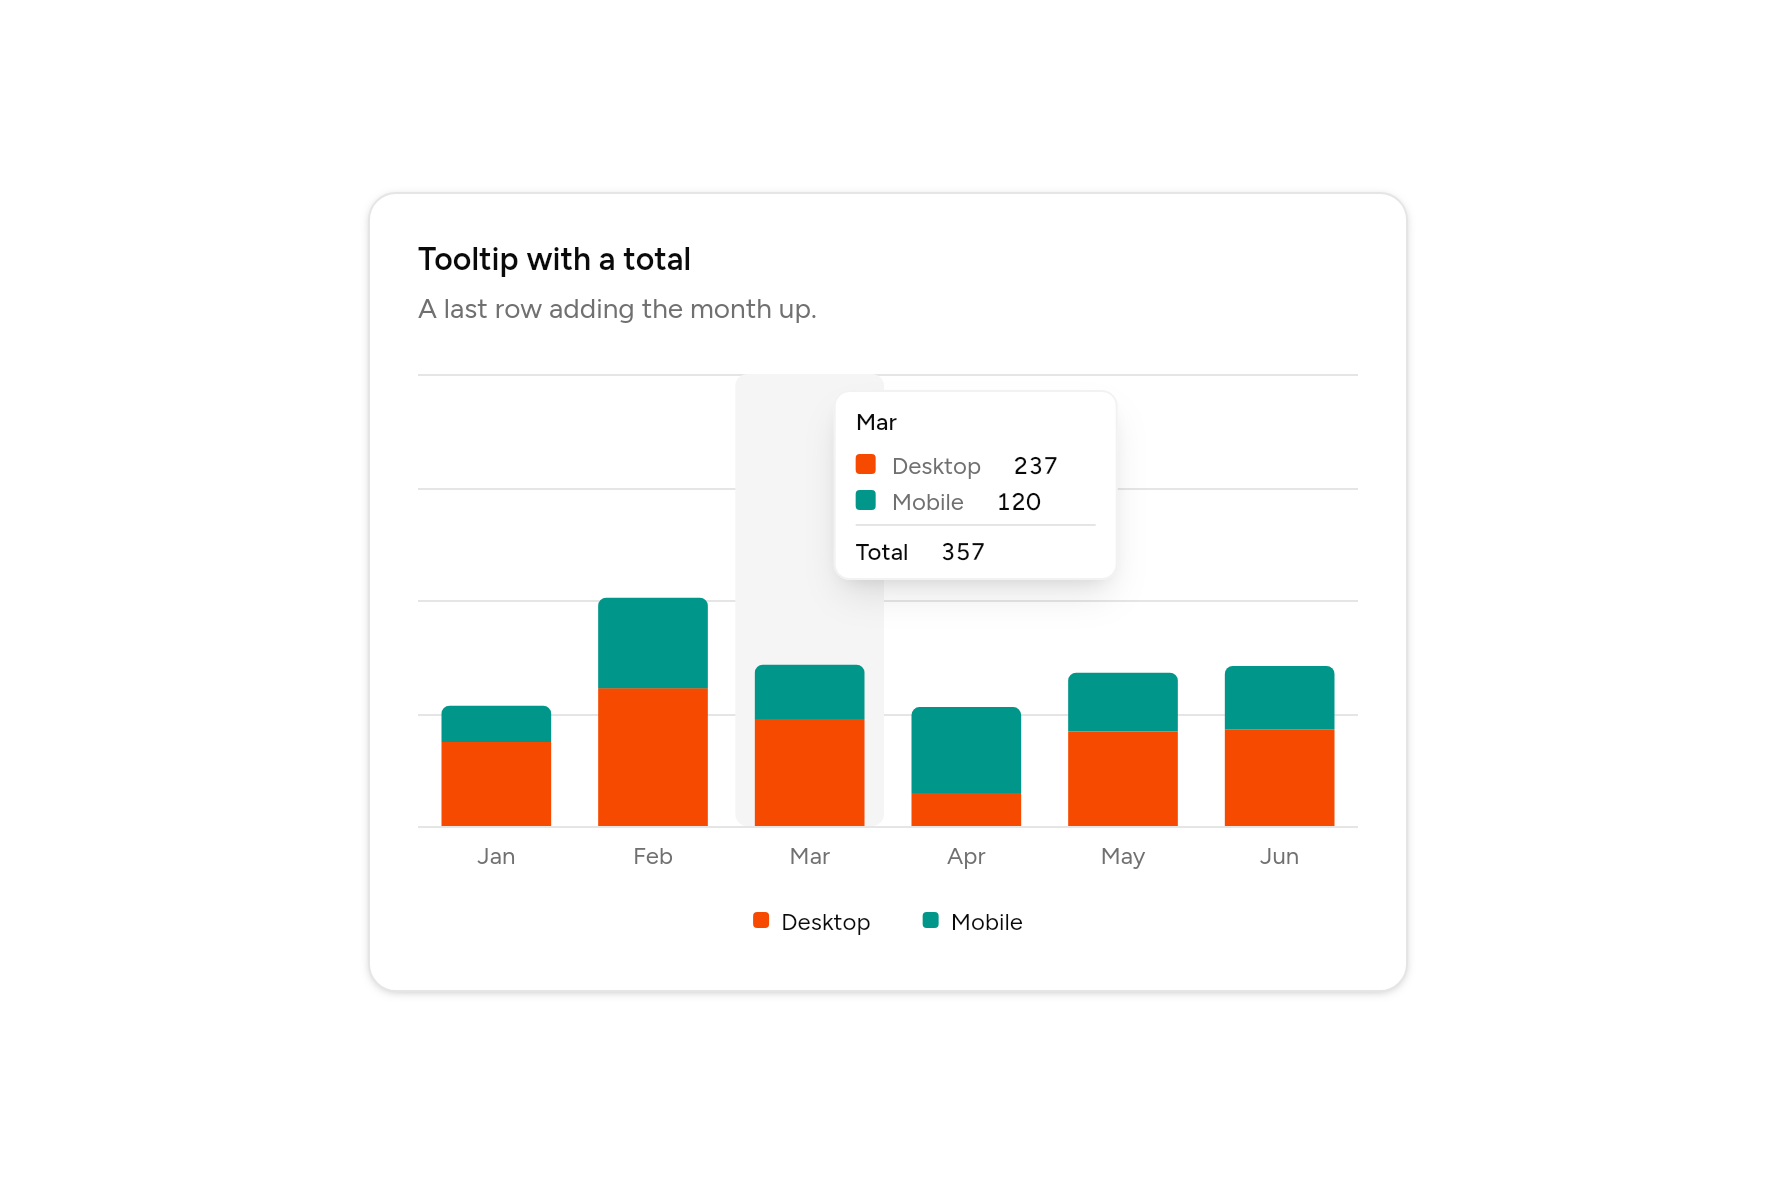
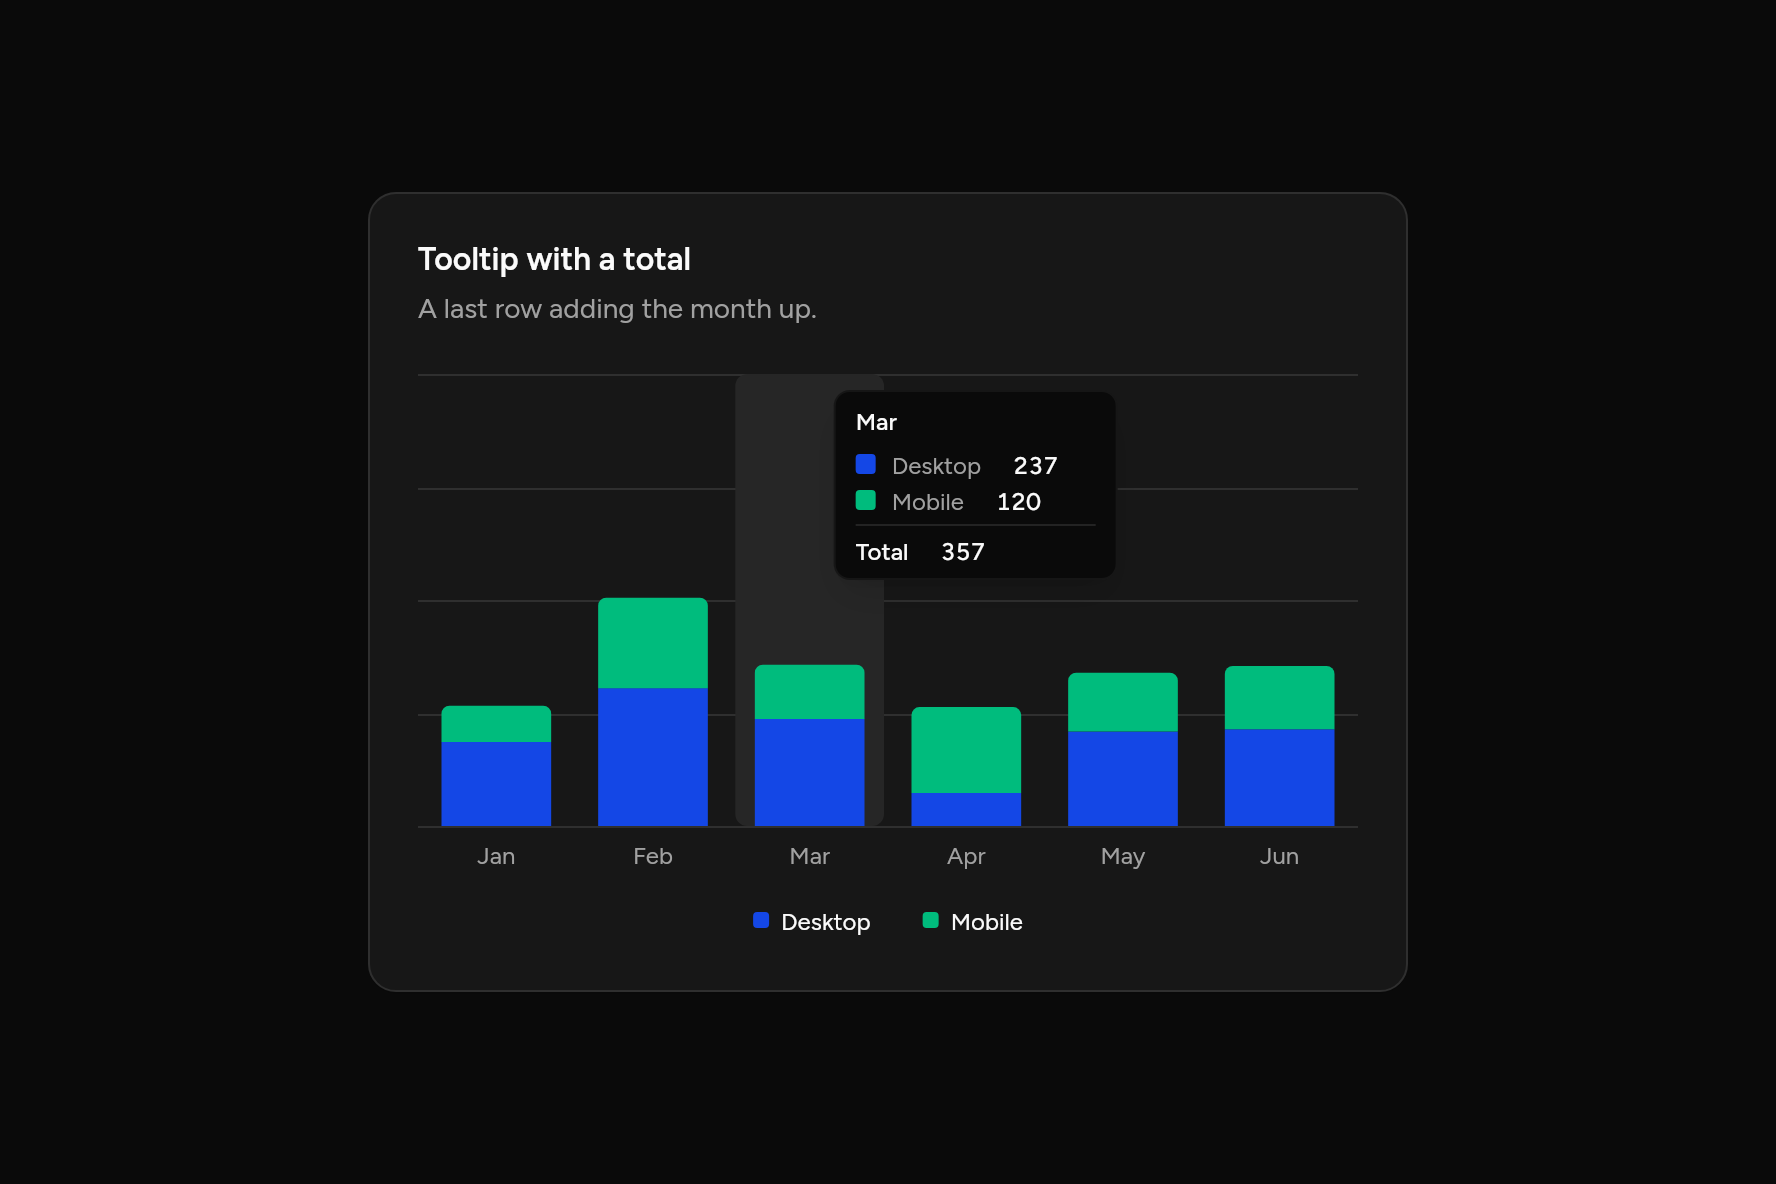
Tooltip with a total
A last row adding the month up.
Code
// Tooltip with a total: A last row adding the month up. Sample data.
import 'package:flutter/widgets.dart';

import 'ui/card.dart';
import 'ui/chart.dart';

class TooltipTotalChart extends StatelessWidget {
  const TooltipTotalChart({super.key});

  @override
  Widget build(BuildContext context) => SizedBox(
    width: 520,
    child: Card(
      children: [
        const CardHeader(
          title: Text("Tooltip with a total"),
          description: Text("A last row adding the month up."),
        ),
        CardContent(
          child: BarChart(
            labels: ['Jan', 'Feb', 'Mar', 'Apr', 'May', 'Jun'],
            series: const [
              ChartSeries('Desktop', [186, 305, 237, 73, 209, 214]),
              ChartSeries('Mobile', [80, 200, 120, 190, 130, 140]),
            ],
            stacked: true,
            tooltip: const ChartTooltip(total: true),
          ),
        ),
      ],
    ),
  );
}
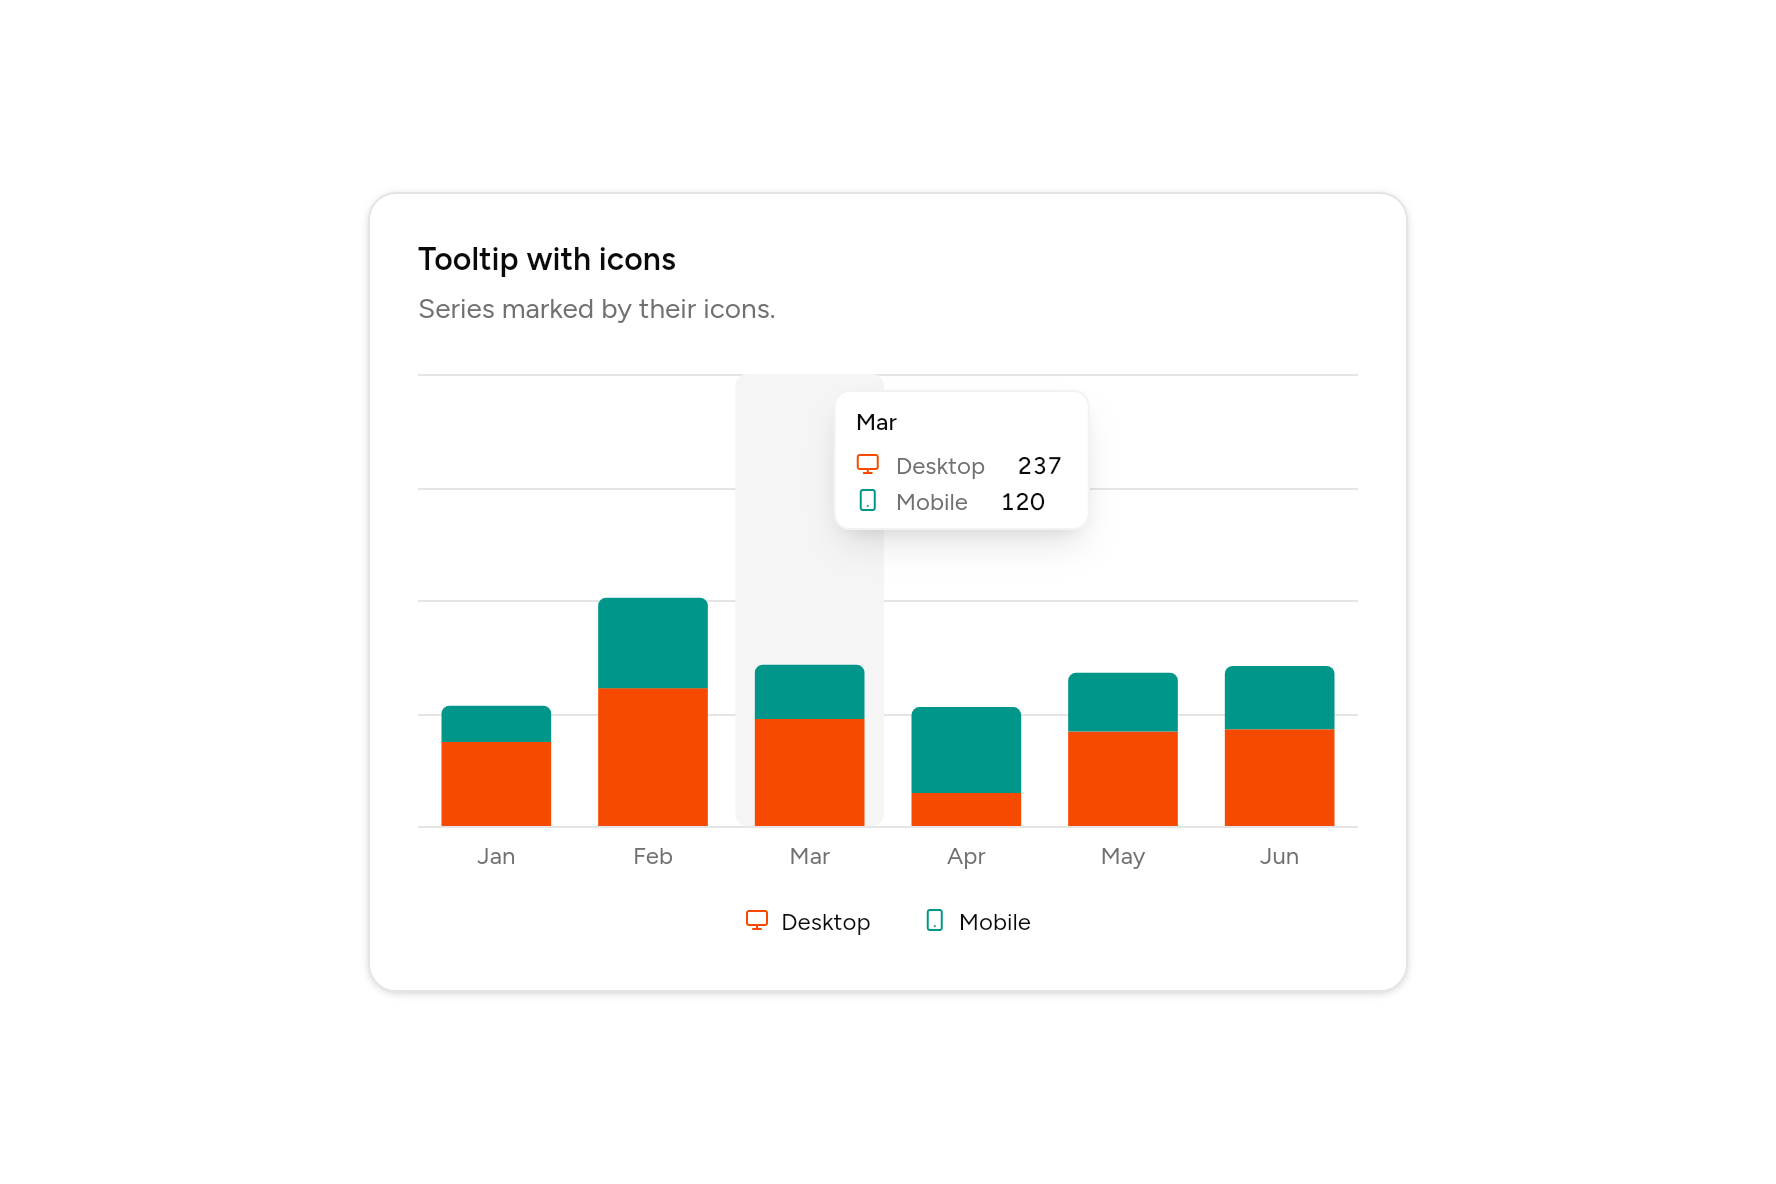
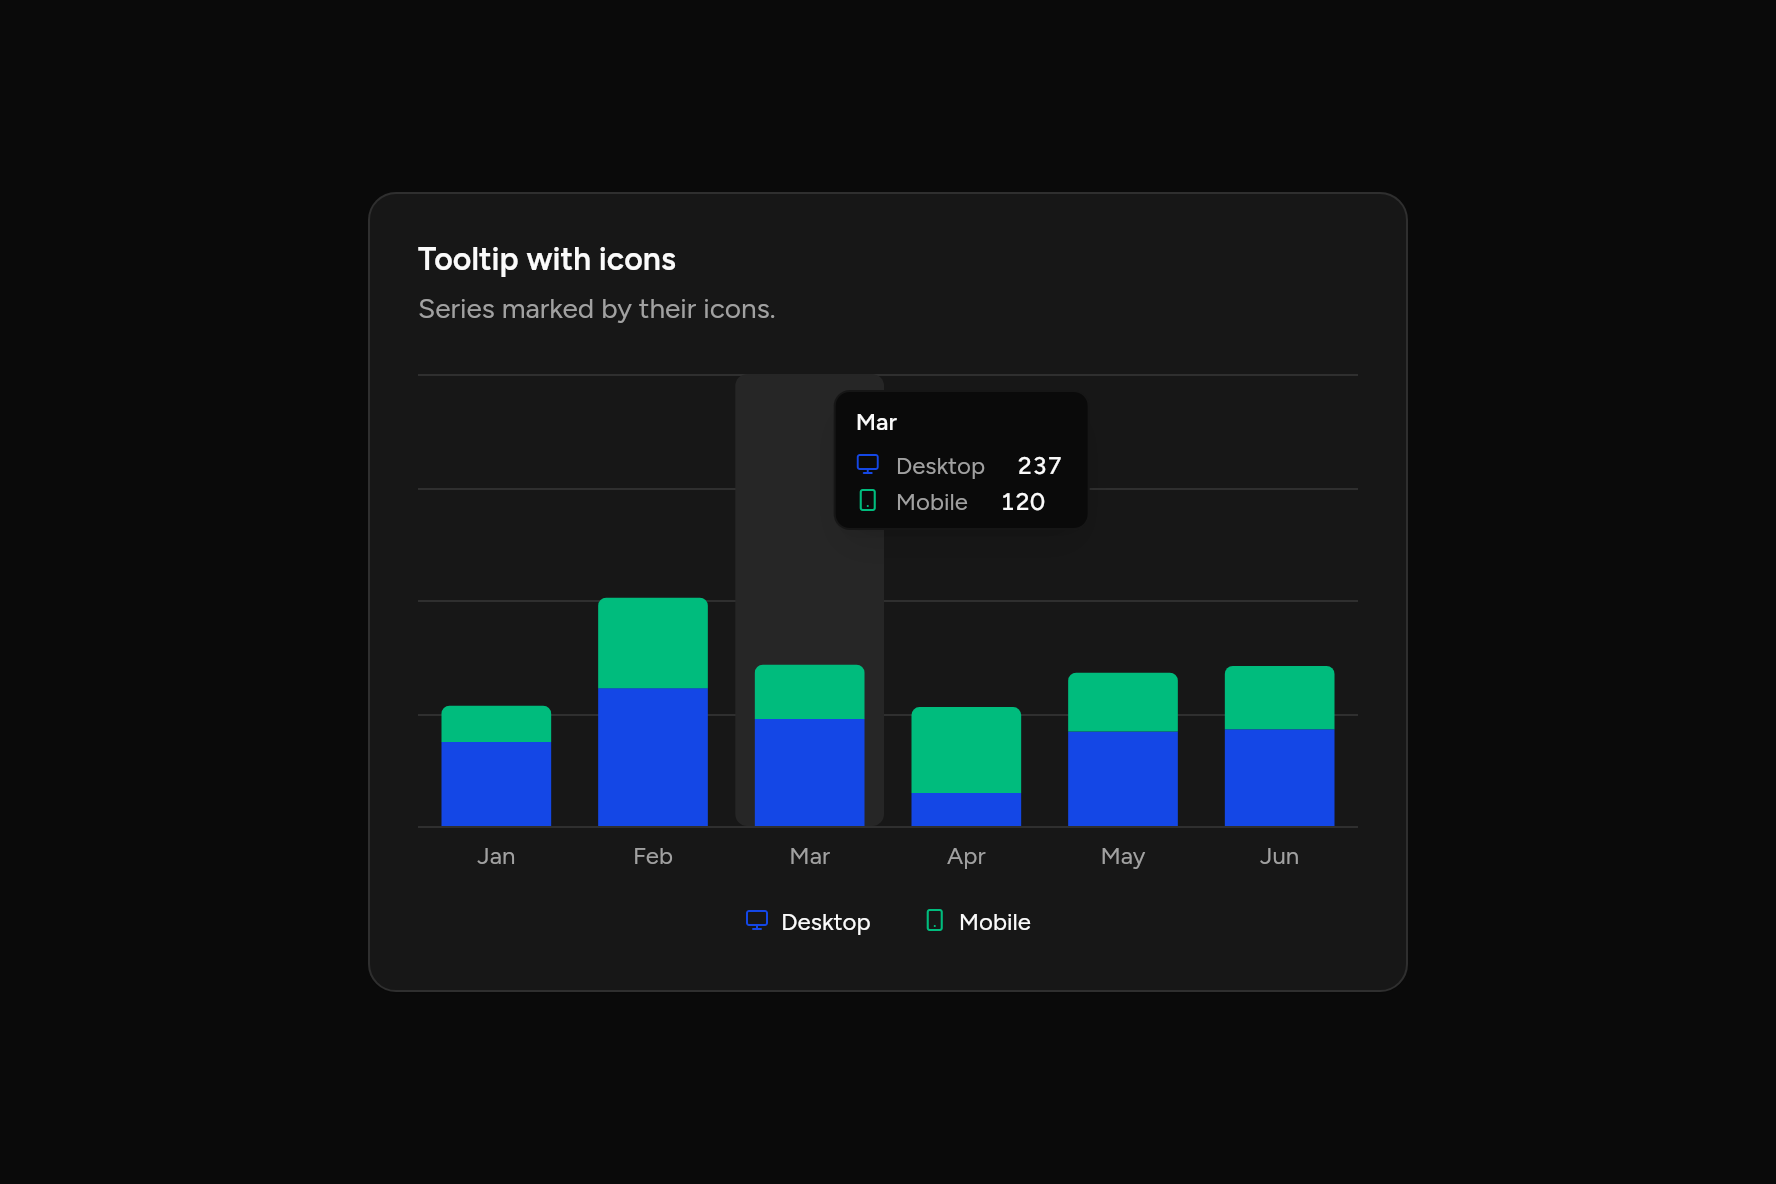
Tooltip with icons
Series marked by their icons.
Code
// Tooltip with icons: Series marked by their icons. Sample data.
import 'package:ashlar_icons/ashlar_icons.dart';
import 'package:flutter/widgets.dart';

import 'ui/card.dart';
import 'ui/chart.dart';

class TooltipIconsChart extends StatelessWidget {
  const TooltipIconsChart({super.key});

  @override
  Widget build(BuildContext context) => SizedBox(
    width: 520,
    child: Card(
      children: [
        const CardHeader(
          title: Text("Tooltip with icons"),
          description: Text("Series marked by their icons."),
        ),
        CardContent(
          child: BarChart(
            labels: ['Jan', 'Feb', 'Mar', 'Apr', 'May', 'Jun'],
            stacked: true,
            series: const [
              ChartSeries('Desktop', [186, 305, 237, 73, 209, 214], icon: AshlarIconsRoundedStroke.monitor),
              ChartSeries('Mobile', [80, 200, 120, 190, 130, 140], icon: AshlarIconsRoundedStroke.smartphone),
            ],
          ),
        ),
      ],
    ),
  );
}